The AI Soft Landing Scenario
Membership required
Membership is now required to use this feature. To learn more:
View Membership Benefits

For three years the AI build-out has blown through every forecast placed in front of it, with spending growth overshooting consensus so badly that investors, chipmakers and datacenter builders were repeatedly caught flat-footed, scrambling for capacity and components they had not budgeted for. The numbers for 2027 and 2028 suggest that run of upside surprise is ending — gently, if investors are lucky.
Wall Street's base case has hyperscalers' AI infrastructure spending roughly doubling in 2026 to about $800bn, then rising a further 54 per cent to $1.2tn in 2027, before decelerating sharply to just 12 per cent growth, or $1.4tn, in 2028. The rate of change, not the spending itself, is the story: capex is decelerating from exponential to merely large.
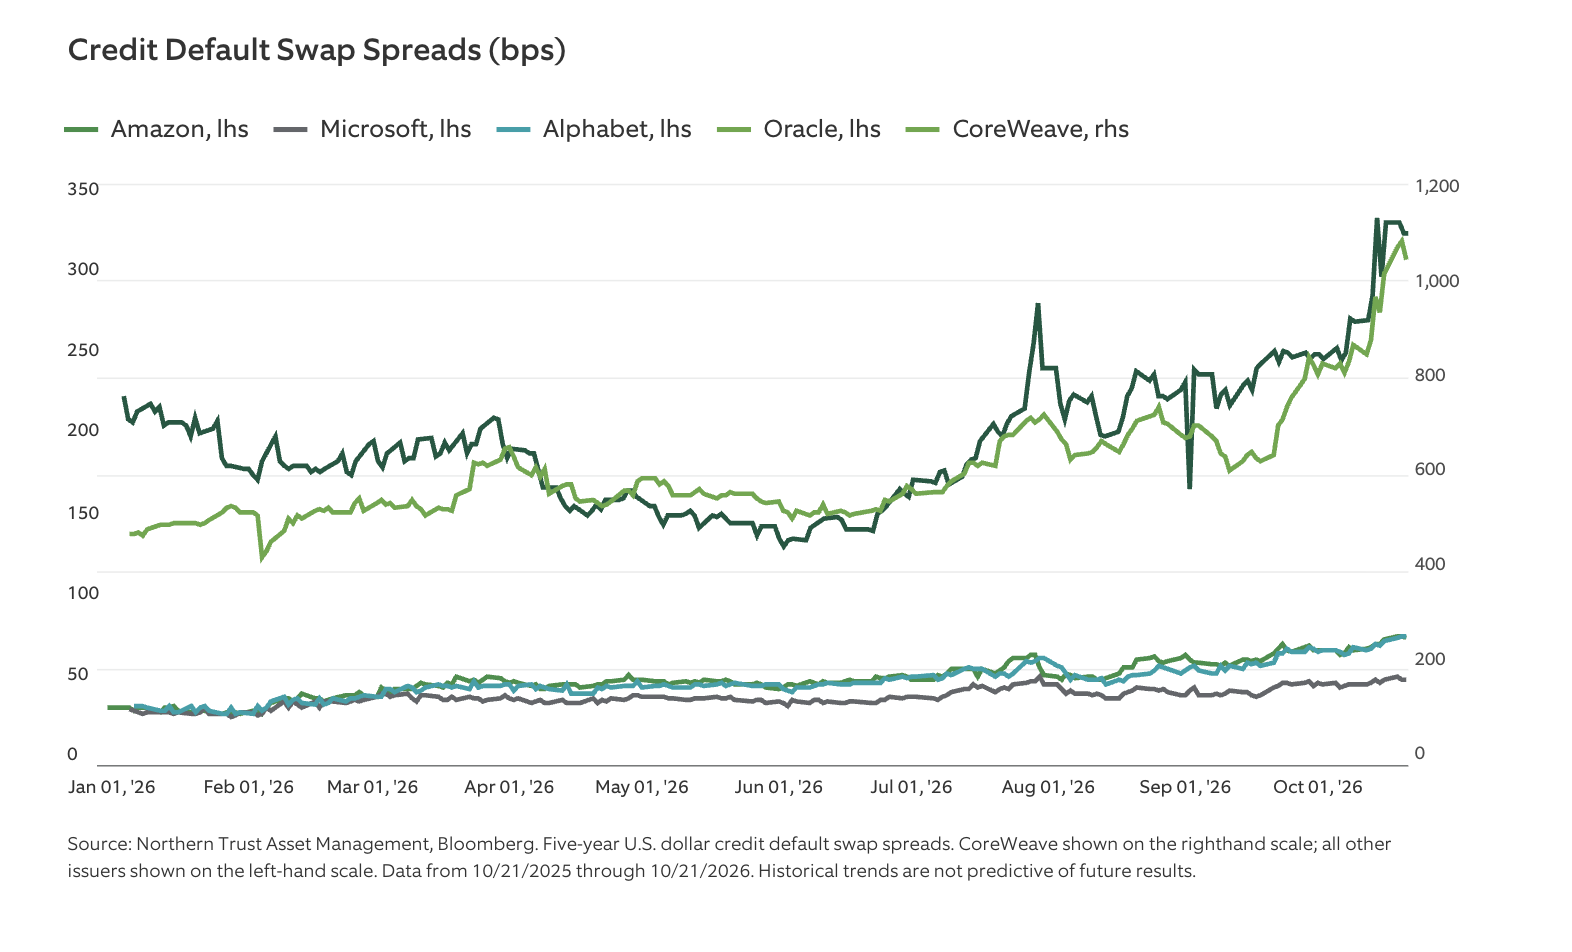
That matters most for the "neoclouds," GPU-cloud specialists that lack hyperscaler-grade balance sheets and have leaned on high yield debt to fund buildouts. Bonds issued at a high-single-digit coupon by one prominent neocloud now yield close to 15 per cent, with its credit default swaps trading at distressed levels and the stress rippling across sector equities. Investment grade issuers borrow in an entirely different universe, and that gap could widen into something structural: a well-capitalized operator may find it cheaper to acquire a cash-strained rival than keep underbidding it, seeding consolidation among the weakest high yield names.
Slower neocloud growth also has a hardware angle. 2026's great surprise was the memory squeeze: DRAM contract prices rose roughly 90-95 per cent quarter-on-quarter in early 2026, and spot commodity memory chips went from about $12 to a record $42.50, as datacenters competed with laptops and phones for scarce fabrication capacity. A capex slowdown should let that supply chain exhale.
The rate path is the hinge. Markets currently price at least 50 basis points of further hikes before policymakers contemplate easing, with projections holding rates near 4.5 per cent through 2027 rather than cutting. The optimistic logic: cooler component demand eases a genuine contributor to goods inflation, giving the Fed room to resume cutting in the second half of 2027 into 2028, once those hikes are banked. Lower rates compress credit spreads, easing refinancing pressure on the neoclouds that need it most — and narrowing the window in which they get bought rather than refinanced.
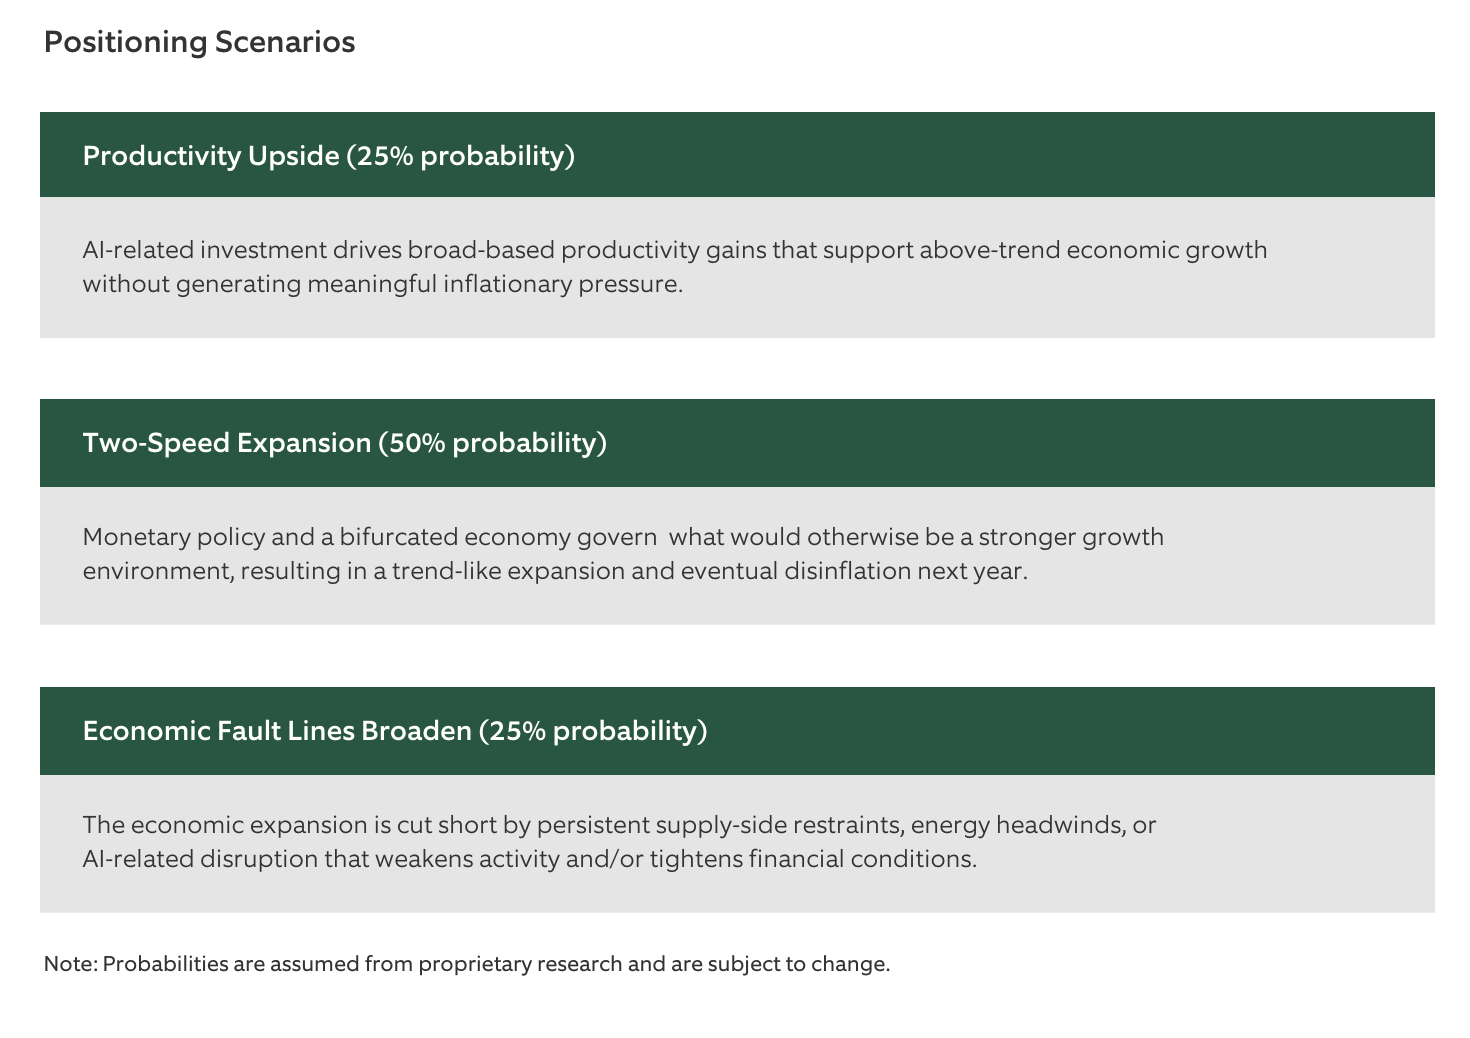
None of this requires the AI trade to end, only to mature. A deceleration from doubling to low double-digit growth sounds dull next to 2026's fireworks, but a maturing cycle should also be a more predictable one, with outcomes landing closer to initial expectations rather than blowing through them. After a year of surprises, markets would welcome nothing more than being right the first time. Investors should position for deceleration, not denial — and for a widening gap between cheap and expensive funders that consolidation, not just credit markets, may ultimately close.
— Peter Wilke, CFA – Head of Tactical Asset Allocation, Global Asset Allocation
THE PRICE OF AI FINANCING – CREDIT MARKETS ARE DRAWING A SHARPER DIVIDE
Interest Rates
Money market conditions remain orderly heading into the fourth quarter, despite a seasonal increase in Treasury bill supply. Net issuance is expected to total approximately $400 billion through mid-December before turning negative. We expect money markets to absorb this supply with only modest upward pressure on bill yields and repo rates. Typical fourth-quarter inflows into money market funds could provide additional demand and further temper pressure on front-end rates.
Repo rates have also remained well contained despite the Federal Reserve’s earlier pause in Reserve Management Purchases of T-bills. This contrasts with the fourth quarter of 2025, when SOFR periodically traded above the upper bound of the federal funds target range. Recent quarter-ends have passed without disruption, suggesting that current liquidity conditions should support an orderly year-end. Lower reserve balances or stronger-than-expected Treasury issuance could nevertheless produce temporary volatility around the turn. We will therefore continue to monitor money market fund flows, reserve balances and repo pricing for indications that supply is placing greater pressure on short-term funding markets.
— Dan LaRocco, Head of Liquidity, Global Fixed Income
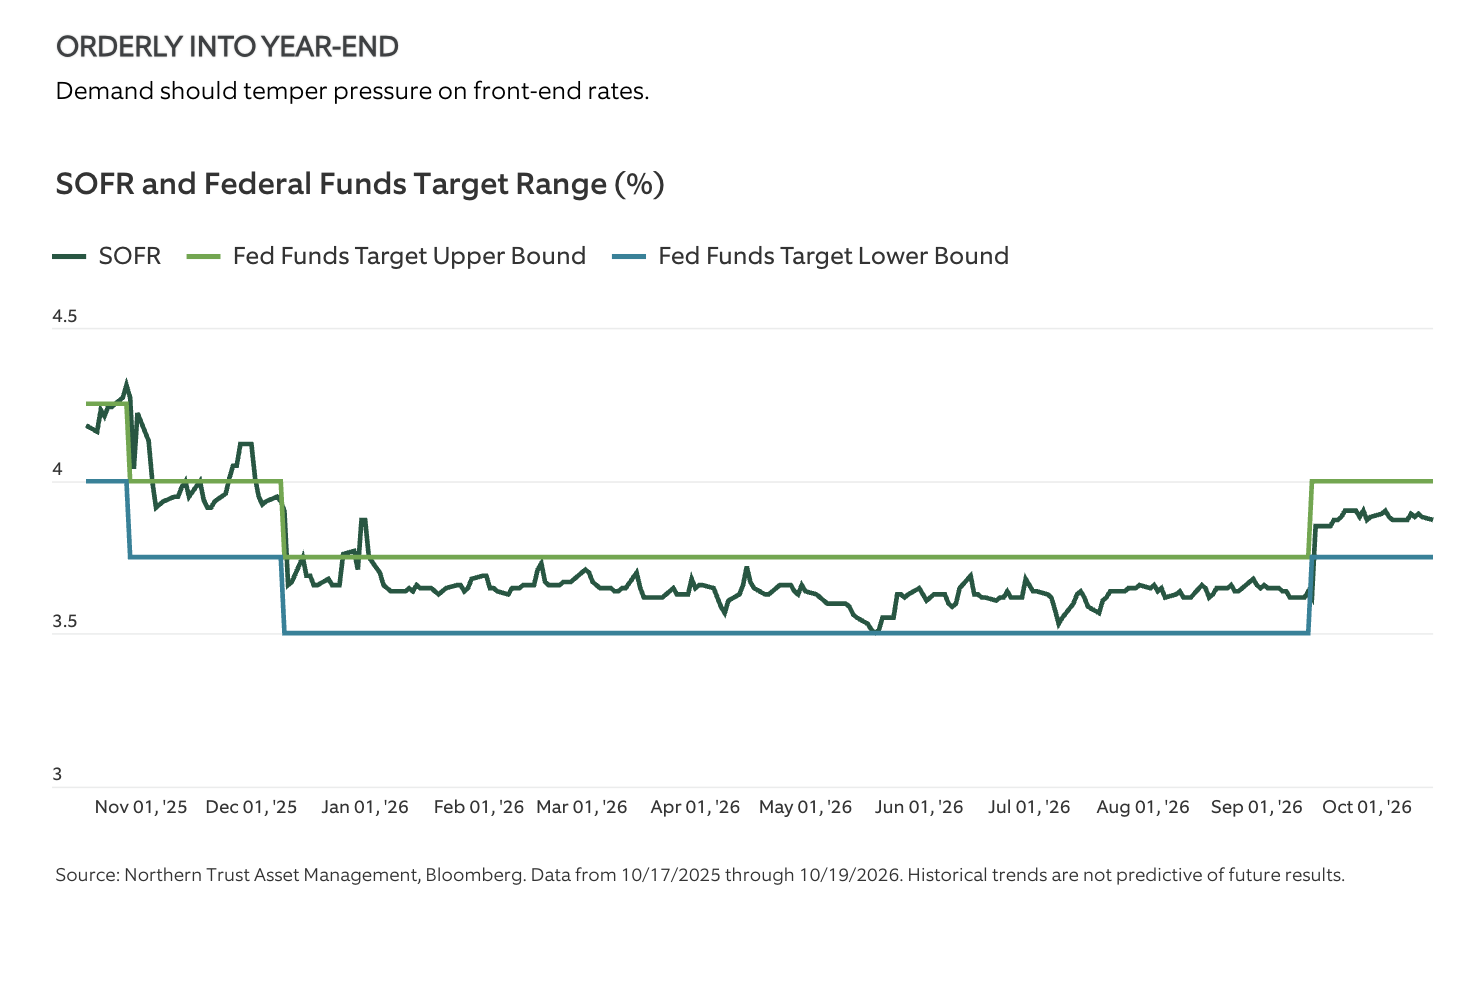
- Seasonal T-bill supply is expected to rise heading into the fourth quarter.
- Money market fund demand may limit upward pressure on bill yields and repo rates.
- We expect a relatively calm year-end, while monitoring reserves and issuance for temporary volatility.
Credit Markets
Interest rate volatility and heavy supply weighed on high yield bonds in September. Lower rated debt has continued to underperform this year, creating meaningful dispersion across rating categories. Bonds trading at spreads above 1,000 basis points increased by $6.4 billion in September, reaching $73 billion. They represented 5.2% of the high yield universe, up from 4.5% a year earlier. Distressed pricing can foreshadow defaults as investors increasingly focus on recovery values rather than contractual payments, making the increase worth monitoring.
The scale and concentration of distress temper that warning. The distressed balance remains roughly half its June 2022 level and a fraction of the March 2020 peak. Seven issuers account for 41% of distressed debt; excluding them brings the distressed ratio closer to 3%. While this does not rule out broader deterioration, it supports our expectation that defaults will remain concentrated and issuer-specific rather than develop into a broad cycle. Continued dispersion should create opportunities for managers able to identify mispriced securities through fundamental credit research.
— Ben McCubbin and Sau Mui, Co-Heads of High Yield, Global Fixed Income
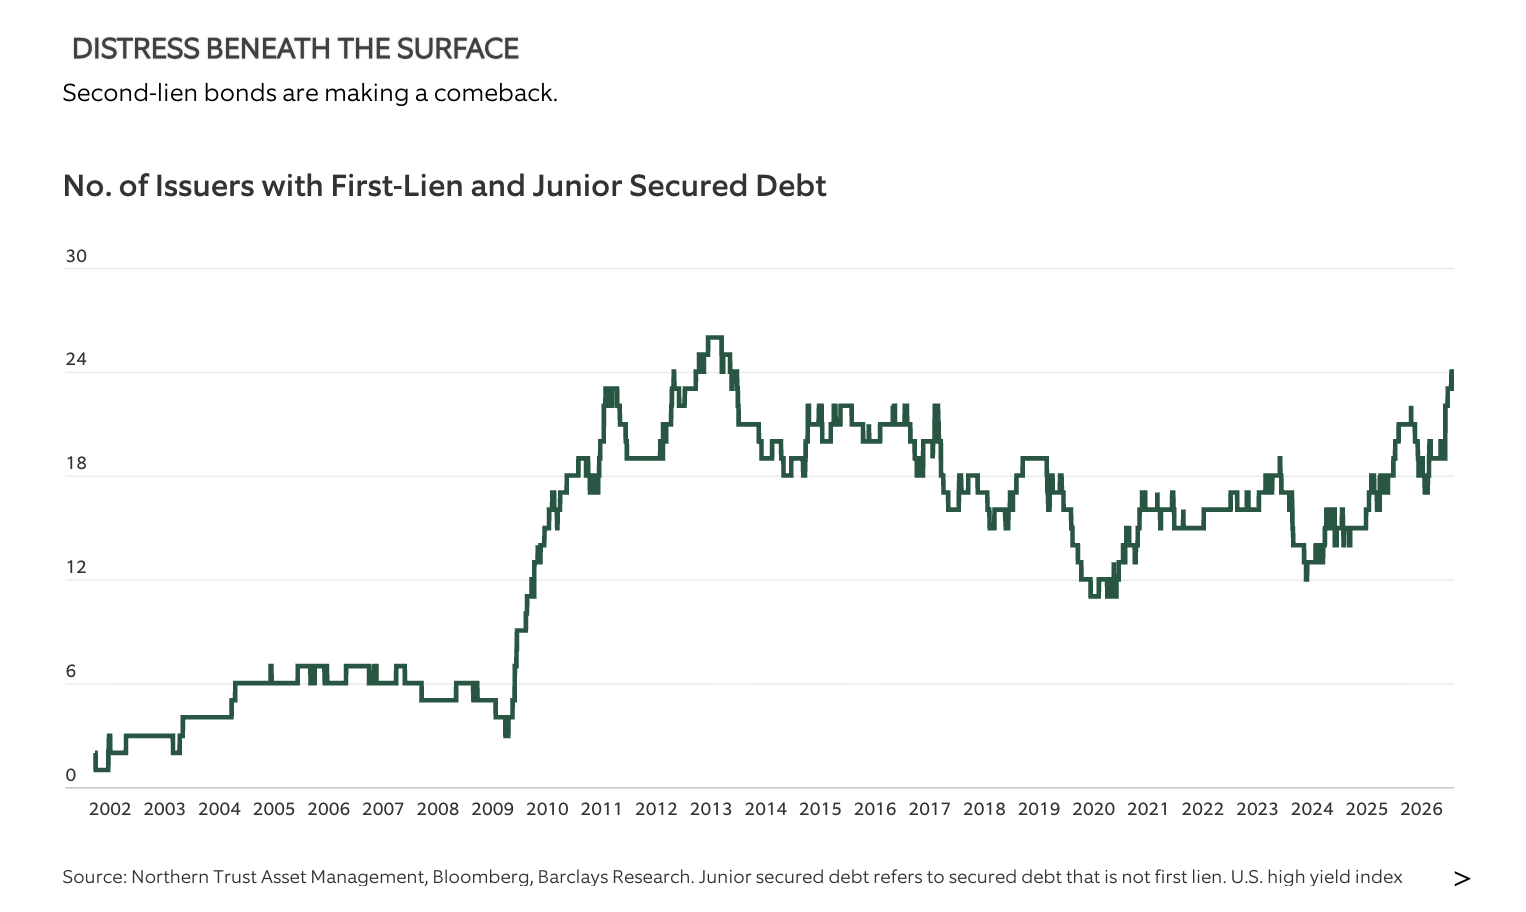
- Interest rate volatility and heavy supply weighed on high yield bonds in September.
- Distressed bonds underperformed performing high yield by more than 12 percentage points year to date.
- Distress remains concentrated, supporting our view that defaults should remain primarily issuer-specific and create opportunities for credit selection.
Equities
U.S. equities face a more demanding valuation backdrop as rising bond yields erode their relative appeal. The 10-year U.S. Treasury yield climbed roughly 50 basis points in September as markets repriced toward renewed Federal Reserve tightening. By mid-October, it stood near 5.1%, slightly above the S&P 500 Index’s forward earnings yield. The resulting earnings-yield gap is in the bottom few percentiles of observations since 2010, leaving earnings growth to do more of the work in supporting current valuations.
A narrow premium, by itself, is not a market-timing signal: historical outcomes have varied with earnings growth and the direction of interest rates. The greater challenge is the expectations embedded in equity prices. Following an exceptionally strong second quarter, third-quarter results and guidance will need to meet a high bar. Strong earnings can sustain further gains, but a meaningful Treasury yield leaves less room for disappointment. Earnings delivery and regional valuation differences should therefore become more important, with wider cushions in markets such as Europe warranting consideration.
— Jordan Dekhayser, Senior Equity Client Portfolio Manager and Daniel Kim, Associate Equity Client Portfolio Manager
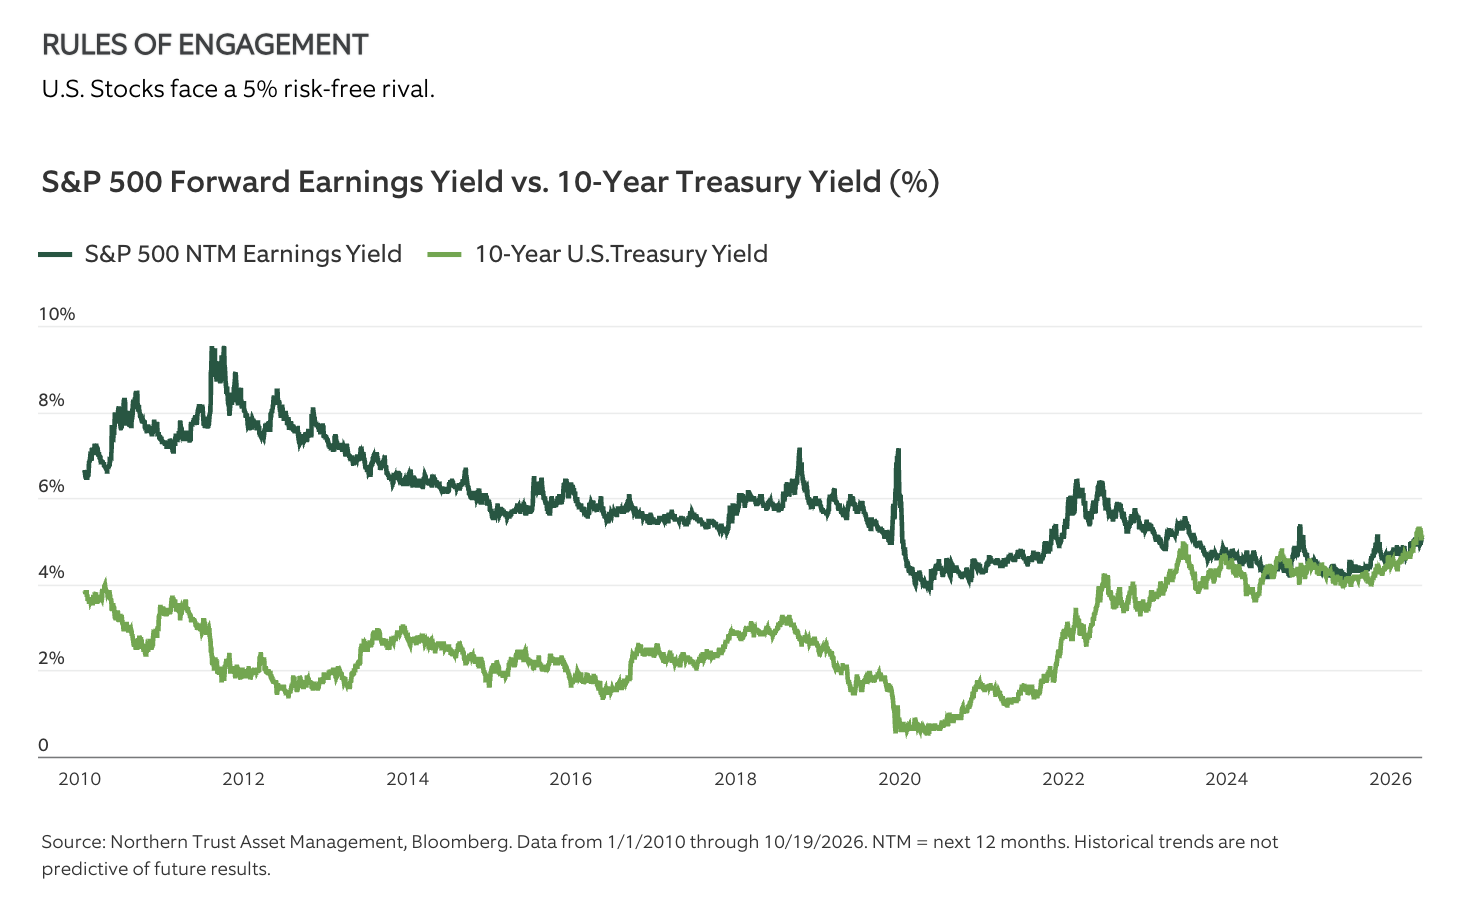
- The S&P 500 Index earnings yield has fallen slightly below the 10-year U.S. Treasury yield.
- Higher yields leave earnings delivery with less room for disappointment.
- Regional valuation differences are becoming more relevant, with Europe offering a wider cushion.
Real Assets
Diesel spot prices climbed sharply in September, outpacing crude oil as crack spreads reached historically elevated levels. The move reflected acute tightness in refined product markets rather than crude scarcity alone. Disrupted Middle East energy flows, reduced transit through the Strait of Hormuz, Russian refinery outages and export restrictions, and sustained global inventory draws constrained distillate supply. Refiners were already operating near capacity, limiting their ability to increase diesel production quickly despite elevated margins.
Looking ahead, diesel prices are likely to remain elevated in the near term given low inventories and continued vulnerability to geopolitical disruptions or refinery outages. However, we see increasing scope for prices to moderate. Elevated refining margins incentivize higher output where capacity is available, while higher prices should eventually restrain demand. If Middle East tensions ease and trade flows normalize, diesel cracks could narrow materially, potentially causing diesel prices to decline faster than crude oil prices. We affirm our neutral weight to global natural resource equities.
— Jim Hardman, Head of Real Assets, Multi-Manager
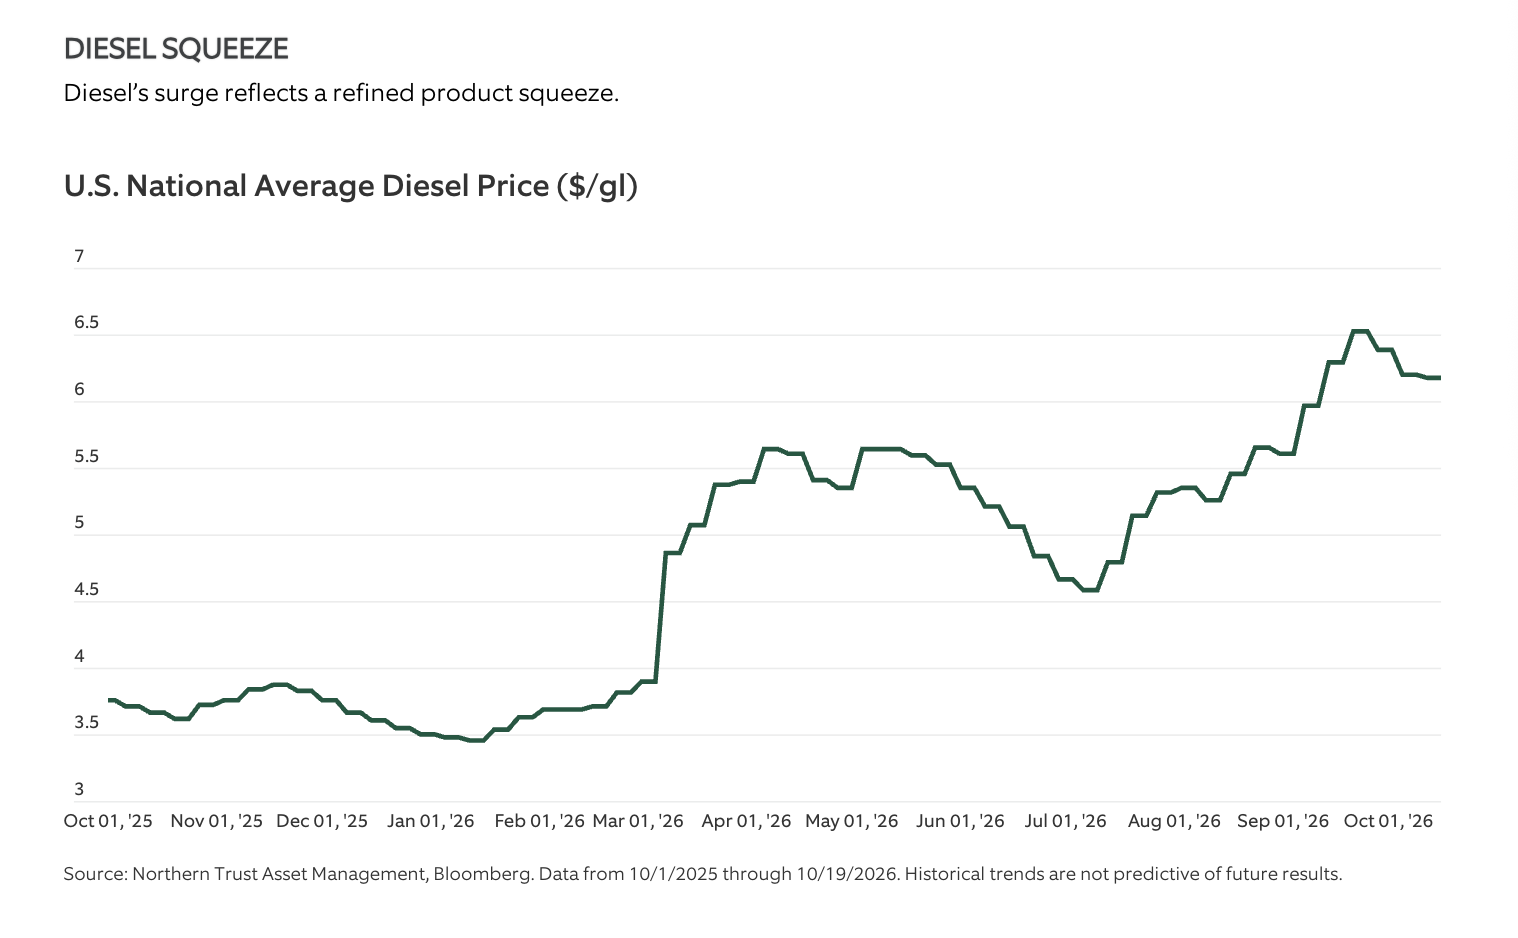
- Diesel prices surged as refinery constraints, low inventories and supply disruptions tightened distillate supply.
- Low inventories provide near-term support, but easing disruptions and increased refinery output where capacity is available could narrow crack spreads.
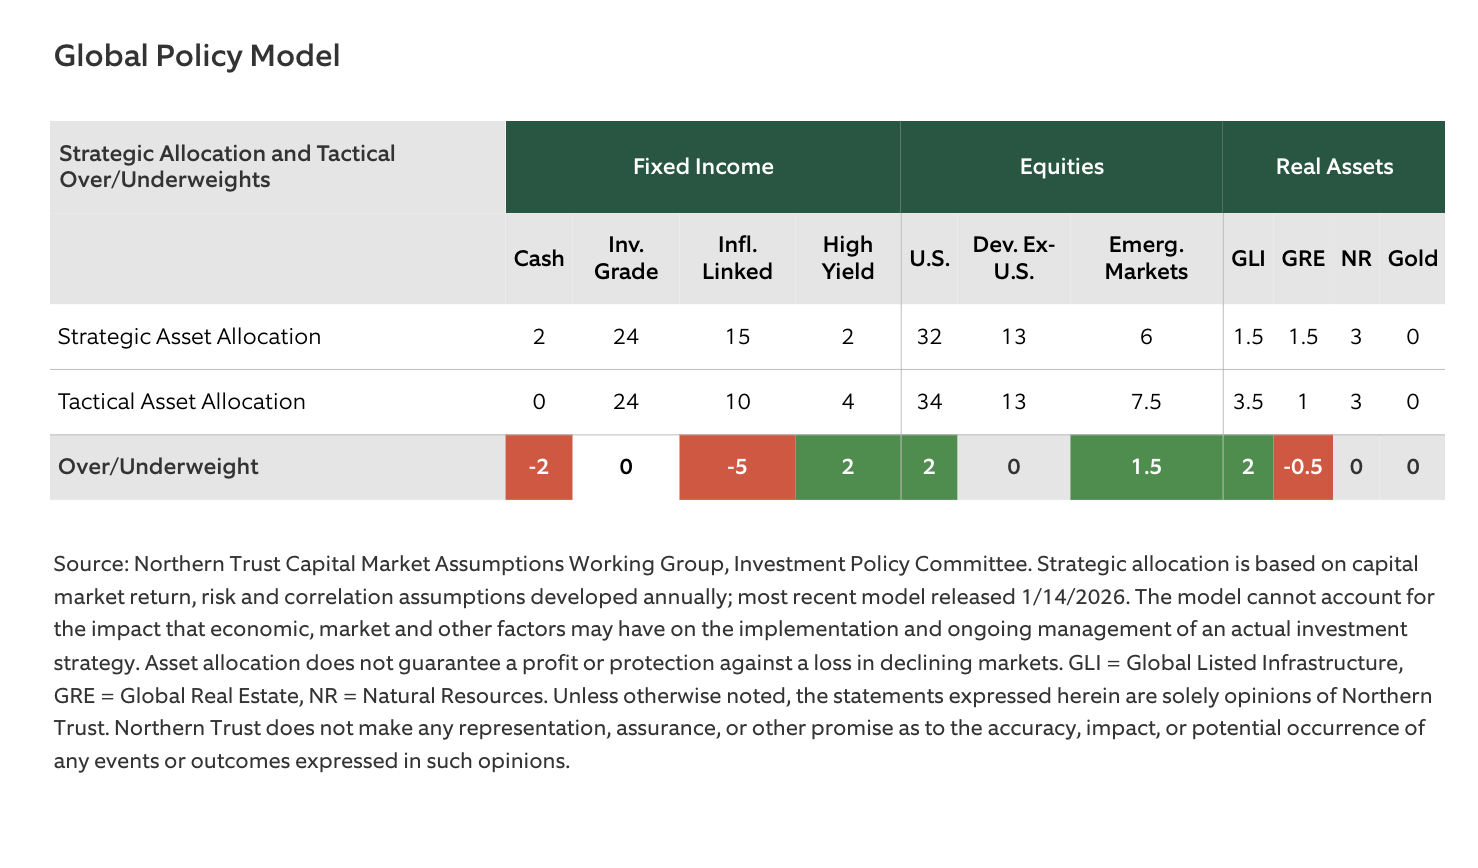
- We affirm our neutral weight to global natural-resource equities.
Unless noted otherwise, data in this piece is Sourced from Bloomberg as of October 2026.
Peter Wilke, Senior Vice President – Head of Tactical Asset Allocation
The Bloomberg 1 – 3 Month U.S. Treasury Bills Index is a sub segment of the Bloomberg U.S. Treasury Bill Index that tracks the market for treasury bills issued by the U.S. government. U.S. Treasury bills issued in fixed maturity terms of 4-, 13-, 26- and 52-weeks. The U.S. Treasury Bill Index is a component of the U.S. Short Treasury Index along with U.S. Treasury notes and bonds that have falled below one year to maturity. It is not possible to invest directly in an index.
Bloomberg U.S. Treasury Index measures U.S. dollar-denominated, fixed-rate, nominal debt issued by the U.S. Treasury. Treasury bills are excluded by the maturity constraint but are part of a separate Short Treasury Index. STRIPS are excluded from the index because their inclusion would result in double-counting. The U.S. Treasury Index is a component of the U.S. Aggregate, U.S. Universal, Global Aggregate and Global Treasury Indices. The index includes securities with remaining maturity of at least one year.
Bloomberg Global Treasury Index tracks fixed-rate, local currency government debt of investment grade countries, including both developed and emerging markets. The index represents the treasury sector of the Global Aggregate Index.
Bloomberg Municipal Bond Index is a flagship measure of the U.S. municipal tax-exempt investment grade bond market. Included in the index are securities from all 50 U.S. States and four other qualifying regions (Washington DC, Puerto Rico, Guam, and the Virgin Islands). The index includes state and local general obligation bonds and revenue bonds. All bonds in the Municipal Bond Index are tax exempt and hence are not eligible for other indices that include taxable bonds, such as the Bloomberg U.S. Aggregate.
Bloomberg U.S. Treasury Inflation-Linked Bond Index (Series-L) measures the performance of the U.S. Treasury Inflation Protected Securities (TIPS) market. Federal Reserve holdings of U.S. TIPS are not index eligible and are excluded from the face amount outstanding of each bond in the index.
Bloomberg Global Inflation Linked Index (Series-L) measures the investment-grade, government inflation-linked debt from 12 different developed market countries. Investability is a key criterion for inclusion of markets in this index, and it is designed to include only those markets in which a global government linker fund is likely and able to invest.
Bloomberg U.S. Aggregate Bond Index is a broad-based benchmark that measures the investment grade, U.S. dollar-denominated, fixed-rate taxable bond market, including Treasuries, government-related and corporate securities, mortgage-backed securities (agency fixed-rate and hybrid adjustable-rate mortgage pass-throughs), asset-backed securities, and commercial mortgage-backed securities (agency and non-agency). It is not possible to invest directly in an index.
Bloomberg Global Aggregate Index is a flagship measure of global investment grade debt from twenty-seven local currency markets. This multi-currency benchmark includes treasury, government-related, corporate and securitized fixed-rate bonds from both developed and emerging markets issuers.
JP Morgan GBI – EM Global Diversified Composite Index tracks the performance of local-currency-denominated government bonds issued by emerging-market countries that are accessible to international investors. The diversified methodology limits the weights of larger countries to reduce concentration.
The Bloomberg U.S. Corporate High Yield Bond Index measures the USD-denominated, high yield, fixed-rate corporate bond market. Securities are classified as high yield if the middle rating of Moody’s, Fitch and S&P is Ba1/BB+/BB+ or below. Bonds from issuers with an emerging markets country of risk, based on the indices’ EM country definition, are excluded. The U.S. Corporate High Yield Index is a component of the U.S. Universal and Global High Yield Indices. The index was created in 1998, with history backfilled to July 1, 1983.
Bloomberg Global High Yield Index is a multi-currency flagship measure of the global high yield debt market. The index represents the union of the U.S. High Yield, the Pan-European High Yield, and Emerging Markets (EM) Hard Currency High Yield Indices. The high yield and emerging markets sub-components are mutually exclusive.
MSCI All Country World Index (MSCI ACWI) is a stock index that tracks nearly 3,000 stocks in 48 developed and emerging market countries. It is not possible to invest directly in an index.
MSCI USA Index is designed to measure the performance of the large and mid cap segments of the U.S. market.
S&P 500 Equal Weight Index comprises the same constituents as the S&P 500 Index, with each constituent assigned an equal weight at each quarterly rebalance.
S&P 500® Index is an unmanaged index consisting of 500 stocks and is a widely recognized common measure of the performance of the overall U.S. stock market. It is not possible to invest directly in an index.
Russell 2000® Index is an unmanaged index which measures the performance of the 2,000 smallest of the 3,000 largest U.S. companies, based on market capitalization. It is not possible to invest directly in an index.
R1000 Growth: The Russell 1000® Growth Index measures the performance of the largecap growth segment of the U.S. equity universe. It includes those Russell 1000 companies with relatively higher price-to-book ratios, higher I/B/E/S forecast medium term (2 year) growth and higher sales per share historical growth (5 years). The Russell 1000® Growth Index is constructed to provide a comprehensive and unbiased barometer for the large-cap growth segment.
Russell 1000® Value Index is an unmanaged index measuring the performance of those companies included in the Russell 1000 Index having lower price-to-book ratios and forecasted growth values. It is not possible to invest directly in an index.
MSCI World Index is a free float-adjusted, market capitalization-weighted stock market index comprised of large- and mid-cap equity companies of developed markets in Asia Pacific, Europe and the Middle East, Canada and the United States. The Index represents a broad cross-section of global markets. The MSCI World is used as a comparative index without ESG considerations. It is not possible to invest directly in an index.
MSCI World ex USA Index is a free-float adjusted market capitalization weighted index that is designed to measure the equity market performance of developed markets excluding United States: Australia, Austria, Belgium, Canada, Denmark, Finland, France, Germany, Hong Kong, Ireland, Israel, Italy, Japan, Netherlands, New Zealand, Norway, Portugal, Singapore, Spain, Sweden, Switzerland and the United Kingdom. It is not possible to invest directly in an index.
MSCI Europe Index captures large and mid cap representation across Developed Markets (DM) countries in Europe. The index covers approximately 85% of the free float-adjusted market capitalization across the European Developed Markets equity universe.
MSCI Japan Index is designed to measure the performance of the large and mid cap segments of the Japanese market. The index covers approximately 85% of the free float-adjusted market capitalization in Japan.
MSCI Emerging Markets Index℠ is a free float-adjusted market capitalization index that is designed to measure equity market performance in the global emerging markets. It is not possible to invest directly in an index.
MSCI China Index captures large and mid cap representation across China A shares, H shares, B shares, Red chips, P chips and foreign listings (e.g. ADRs). The index covers about 85% of this China equity universe. Currently, the index includes Large Cap A and Mid Cap A shares represented at 20% of their free float adjusted market capitalization.
The S&P Global Natural Resources Index includes 90 of the largest publicly traded companies in natural resources and commodities businesses that meet specific investability requirements, offering investors diversified and investable equity exposures across 3 primary commodity-related sectors: agribusiness, energy, and metals & mining. It is not possible to invest directly in an index.
S&P Global Infrastructure Index provides liquid and tradable exposure to 75 companies from around the world that represent the listed infrastructure universe. The Index has balanced weights across three distinct infrastructure clusters: Utilities, Transportation, and Energy. It is not possible to invest directly in an index.
MSCI ACWI IMI Core Real Estate Index is a free float-adjusted market capitalization index that consists of large, mid- and small-cap stocks across 23 developed markets and 24 emerging markets countries engaged in the ownership, development and management of specific core property type real estate. It is not possible to invest directly in an index.
Secured Overnight Financing Rate (SOFR) is a broad measure of the cost of overnight borrowing collateralized by U.S. Treasuries. It is based on actual market transactions and has replaced LIBOR as the preferred benchmark for U.S. dollar interest rates.
ICE U.S. High Yield Performing and Distressed Indices series separate the U.S. high yield bond universe into performing and distressed segments. Distressed bonds are defined as bonds trading at spreads above 1,000 basis points.
Credit Default Swap (CDS) is a derivative contract designed to transfer the credit risk of a reference issuer. The CDS spread is the annual premium paid for credit protection, quoted in basis points. A wider spread generally indicates a higher market-implied assessment of credit risk.
U.S. National Average Diesel Price is the average U.S. diesel price, expressed in dollars per gallon.
IMPORTANT INFORMATION
The information contained herein is intended for use with current or prospective clients of Northern Trust Investments, Inc (NTI) or its affiliates. The information is not intended for distribution or use by any person in any jurisdiction where such distribution would be contrary to local law or regulation. Northern Trust Asset Management’s (NTAM) and its affiliates may have positions in and may effect transactions in the markets, contracts and related investments different than described in this information. This information is obtained from sources believed to be reliable, its accuracy and completeness are not guaranteed, and is subject to change. Information does not constitute a recommendation of any investment strategy, is not intended as investment advice and does not take into account all the circumstances of each investor.
This information is provided for informational purposes only and is not intended to be, and should not be construed as, an offer, solicitation or recommendation with respect to any transaction and should not be treated as legal advice, investment advice or tax advice. Recipients should not rely upon this information as a substitute for obtaining specific legal or tax advice from their own professional legal or tax advisors. References to specific securities and their issuers are for illustrative purposes only and are not intended and should not be interpreted as recommendations to purchase or sell such securities. Indices and trademarks are the property of their respective owners. Information is subject to change based on market or other conditions.
All securities investing and trading activities risk the loss of capital. Each portfolio is subject to substantial risks including market risks, strategy risks, advisor risk, and risks with respect to its investment in other structures. There can be no assurance that any portfolio investment objectives will be achieved, or that any investment will achieve profits or avoid incurring substantial losses. No investment strategy or risk management technique can guarantee returns or eliminate risk in any market environment. Risk controls and models do not promise any level of performance or guarantee against loss of principal. Any discussion of risk management is intended to describe NTAM’s efforts to monitor and manage risk but does not imply low risk.
Past performance is not a guarantee of future results. Performance returns and the principal value of an investment will fluctuate. Performance returns contained herein are subject to revision by NTAM. Comparative indices shown are provided as an indication of the performance of a particular segment of the capital markets and/or alternative strategies in general. Index performance returns do not reflect any management fees, transaction costs or expenses. It is not possible to invest directly in any index. Net performance returns are reduced by investment management fees and other expenses relating to the management of the account. Gross performance returns contained herein include reinvestment of dividends and other earnings, transaction costs, and all fees and expenses other than investment management fees, unless indicated otherwise. For U.S. NTI prospects or clients, please refer to Part 2a of the Form ADV or consult an NTI representative for additional information on fees.
Forward-looking statements and assumptions are NTAM’s current estimates or expectations of future events or future results based upon proprietary research and should not be construed as an estimate or promise of results that a portfolio may achieve. Actual results could differ materially from the results indicated by this information. Historical trends are not predictive of future results.
Northern Trust Asset Management is composed of Northern Trust Investments, Inc., Northern Trust Global Investments Limited, Northern Trust Fund Managers (Ireland) Limited, Northern Trust Global Investments Japan, K.K., NT Global Advisors, Inc., 50 South Capital Advisors, LLC, Northern Trust Asset Management Australia Pty Ltd, and investment personnel of The Northern Trust Company, The Northern Trust Company (Singapore Branch), and The Northern Trust Company of Hong Kong Limited.
Not FDIC insured | May lose value | No bank guarantee
A message from Advisor Perspectives and VettaFi: Discover something new! Click here to register for our upcoming webcasts.
Membership required
Membership is now required to use this feature. To learn more:
View Membership Benefits