Key takeaways:
- Higher yields do not automatically make longer-duration bonds attractive, as persistent inflation, resilient growth, and heavy debt issuance could maintain upward pressure on yields in the near term.
- Adding duration requires a change in conditions – not just a target Treasury yield. We would look for multiple market signals to turn before taking on more interest rate exposure.
- We continue to favor a lower-duration stance for now, emphasizing carry and limiting drawdown risk, while retaining the flexibility to add duration for potential returns and portfolio defense when conditions shift.
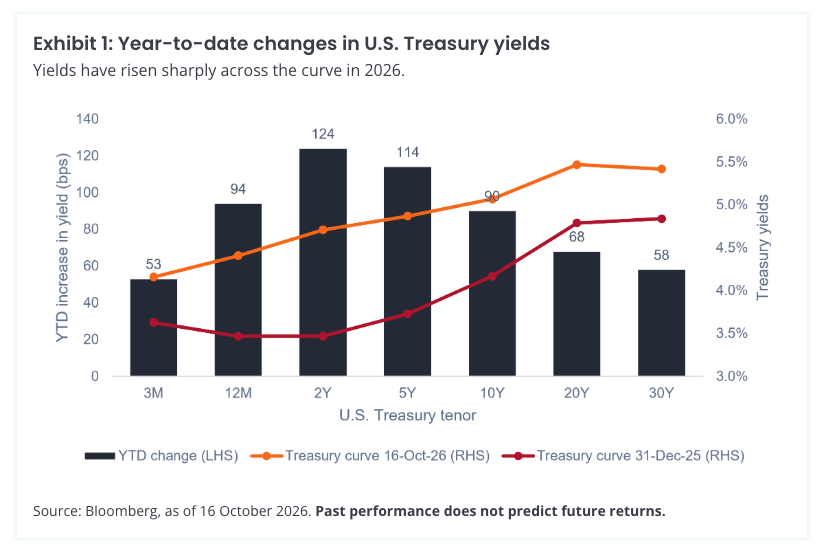
The word “whipsaw” probably best describes how government bond yields have behaved so far in 2026. We started off the year with expectations for three-to-four rate cuts and watched as the 10-year U.S. Treasury yield rallied to under 4% in March. Since then, yields have moved sharply higher, with futures markets now pricing in three rate hikes.
See more: 2 Fixed Income Solutions for Navigating Bond Instability
The about-turn stems from multiple conspiring factors, including higher energy prices and reaccelerating inflation due to the Iran War, strong U.S. corporate earnings, robust economic growth on the back of the artificial intelligence (AI) infrastructure buildout, heavy government and corporate debt issuance, large fiscal deficits and deteriorating government finances, and a more hawkish and less communicative Federal Reserve (Fed).
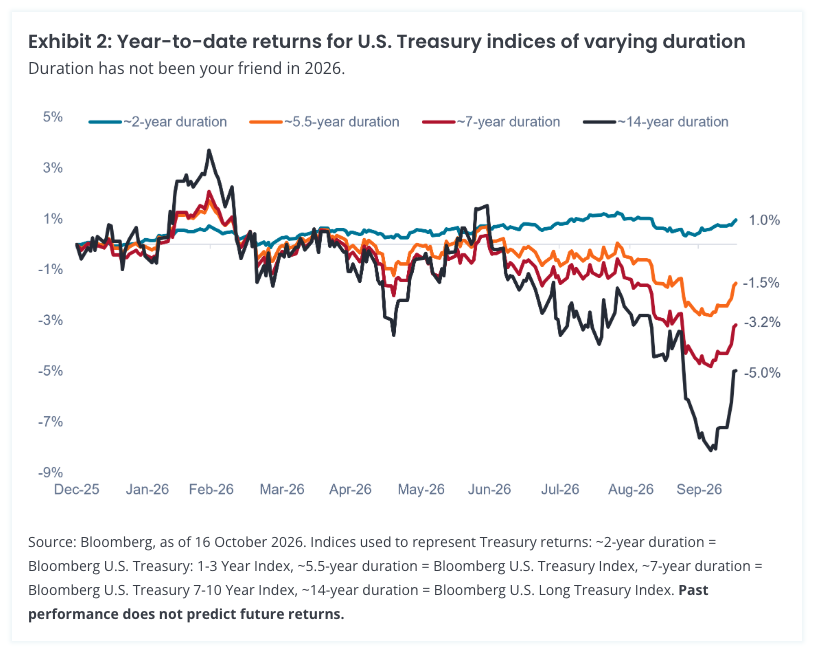
It goes without saying that the aggressive move up in yields has resulted in a bumpy ride for some fixed income investors – notably for anyone who has not been underweight duration or parked on the short end of the yield curve.
As is to be expected, longer-duration assets have suffered greater negative price movements compared to shorter-duration bonds, as shown in Exhibit 2.
Despite short-duration assets outperforming thus far in 2026, many investors are now asking when duration will be worth owning again. For some, the answer to that question hinges on a specific number, such as “6% on the 10-year Treasury”, which is the point at which 37% of fund managers in Bank of America’s October Global Fund Manager Survey said they would shift equities to bonds.
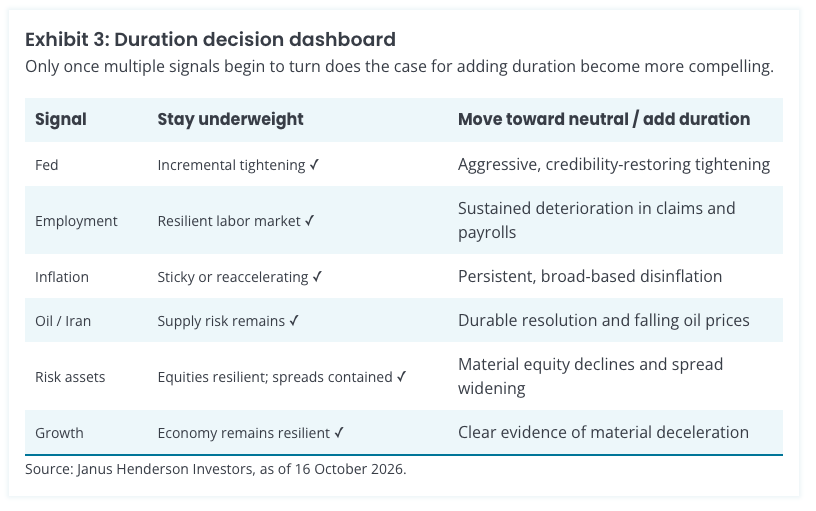
In our view, the decision is more nuanced: One must pay attention to the key themes driving bond markets and then watch for signals of a shift in those themes. Exhibit 3 breaks down the key signals we are paying attention to and what might precipitate a shift to adding duration.
For now, we believe the risks to longer-maturity yields are likely to persist, potentially with more volatility to come. Given these risks, we continue to favor a less volatile, lower-duration position that maximizes income per unit of risk by emphasizing carry while limiting drawdown risks and exposure to rate-sensitive assets.
While being underweight duration has made sense in 2026, a true active manager is prepared to adjust duration positioning to capture potential returns and add portfolio defense when conditions warrant a change. We continue to monitor the signals and stand ready to adjust our duration approach if, and when, the signals begin to turn.
A message from Advisor Perspectives and VettaFi: Discover something new! Click here to register for our upcoming webcasts.
IMPORTANT INFORMATION
Actively managed portfolios may fail to produce the intended results. No investment strategy can ensure a profit or eliminate the risk of loss.
Artificial intelligence (“AI”) focused companies, including those that develop or utilize AI technologies, may face rapid product obsolescence, intense competition, and increased regulatory scrutiny. These companies often rely heavily on intellectual property, invest significantly in research and development, and depend on maintaining and growing consumer demand. Their securities may be more volatile than those of companies offering more established technologies and may be affected by risks tied to the use of AI in business operations, including legal liability or reputational harm.
Credit spread risk is the potential for a financial loss on a debt security due to a widening of the spread (difference in yield) between that security and a risk-free benchmark, such as a U.S. Treasury bond. It represents changes in market value caused by increased market perception of credit risk, distinct from the actual risk of borrower default.
Diversification neither assures a profit nor eliminates the risk of experiencing investment losses.
Fixed income securities are subject to interest rate, inflation, credit and default risk. The bond market is volatile. As interest rates rise, bond prices usually fall, and vice versa. The return of principal is not guaranteed, and prices may decline if an issuer fails to make timely payments or its credit strength weakens.
Index performance does not reflect the expenses of managing a portfolio as an index is unmanaged and not available for direct investment.
Definitions
The 10-Year Treasury Yield is the interest rate on U.S. Treasury bonds that will mature 10 years from the date of purchase.
Basis point (bp) equals 1/100 of a percentage point. 1 bp = 0.01%, 100 bps = 1%.
Carry is the income or return generated from holding a position over time, excluding changes in its market price.
Credit Spread is the difference in yield between securities with similar maturity but different credit quality. Widening spreads generally indicate deteriorating creditworthiness of corporate borrowers, and narrowing indicate improving.
Duration measures a bond price’s sensitivity to changes in interest rates. The longer a bond’s duration, the higher its sensitivity to changes in interest rates and vice versa.
U.S. Treasury securities are direct debt obligations issued by the U.S. Government. With government bonds, the investor is a creditor of the government. Treasury Bills and U.S. Government Bonds are guaranteed by the full faith and credit of the United States government, are generally considered to be free of credit risk and typically carry lower yields than other securities.
Volatility measures risk using the dispersion of returns for a given investment.
A yield curve plots the yields or interest rates of government bonds that have equal credit quality but different maturity dates.
The opinions and views expressed are as of the date published and are subject to change. They are for information purposes only and should not be used or construed as an offer to sell, a solicitation of an offer to buy, or a recommendation to buy, sell or hold any security, investment strategy or market sector. No forecasts can be guaranteed. Opinions and examples are meant as an illustration of broader themes, are not an indication of trading intent and may not reflect the views of others in the organization. It is not intended to indicate or imply that any illustration/example mentioned is now or was ever held in any portfolio. Janus Henderson Group Ltd. through its subsidiaries may manage investment products with a financial interest in securities mentioned herein and any comments should not be construed as a reflection on the past or future profitability. There is no guarantee that the information supplied is accurate, complete, or timely, nor are there any warranties with regards to the results obtained from its use. Past performance is no guarantee of future results. Investing involves risk, including the possible loss of principal and fluctuation of value.
Janus Henderson® and any other trademarks used herein are trademarks of Janus Henderson Group Ltd. or one of its subsidiaries. © Janus Henderson Group Ltd.
© Janus Henderson Investors
Read more commentaries by Janus Henderson Investors