AI Is Proving Yet Again That Americans Are the Most Generous People on Earth
Membership required
Membership is now required to use this feature. To learn more:
View Membership Benefits
I’ve said it for years, and I’ll keep saying it: Americans are the most generous people in the world. No nation on earth gives more.
Last year, U.S. charitable giving hit a record $617.20 billion, according to Giving USA. That’s the first time it’s ever topped $600 billion. Individuals gave $394.2 billion of that, foundations gave $117.15 billion, bequests added $62.19 billion and corporations contributed $43.67 billion.
It isn’t just the dollar amount, either. A recent Bank of America study found that nearly nine in 10 wealthy Americans gave to charity in 2025, and 49% volunteered their time, up from 42% in 2023. Among the world’s ultra-wealth, North American donors gave $115 billion last year, and $107 billion of that came from the U.S.
See more: Are Bonds Pricing In a Fed Policy Mistake?
Giving USA credits “strong financial markets” for the record and says a strong stock market lifted individual giving 4.1%.
What this tells you is that capitalism and charity aren’t opposites. They go hand-in-hand. When Americans build wealth, they share it.
A New Wave of Wealth Looking for a Home
Today, the artificial intelligence (AI) boom is creating fortunes faster than anything I’ve seen in my career, and some of the people at the center of it are already working out how to give it away.
Anthropic, the maker of the Claude AI models, said earlier this week that it’s committing 5% of its shares to a new Anthropic Public Benefit Fund, subject to stockholder approval. The board can add another 2% for every 50% increase in the company’s value above a set baseline. Anthropic is preparing what could be one of the largest IPOs in history, at a valuation of $1.5 trillion to $2 trillion. Reuters puts that 5% stake at $75 billion to $100 billion.
On top of the corporate pledge, each of Anthropic’s cofounders has pledged to give 80% of their personal Anthropic equity to philanthropy, according to the company’s draft prospectus.
Writer Nan Ransohoff calls this the “third wave of American philanthropy.” She estimates that AI wealth could add $37 billion to $100 billion a year in new charitable spending, a 6% to 17% boost to what Americans already give.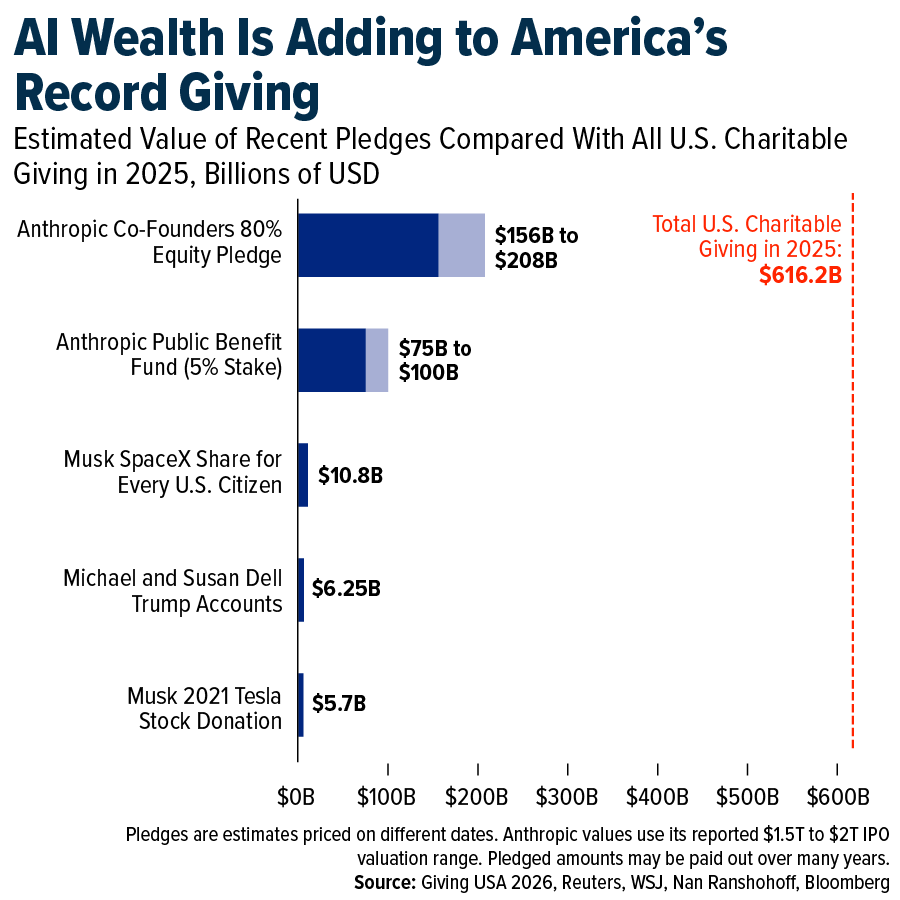
Shares, Not Checks
And then there’s Elon Musk, who on Monday had this to say: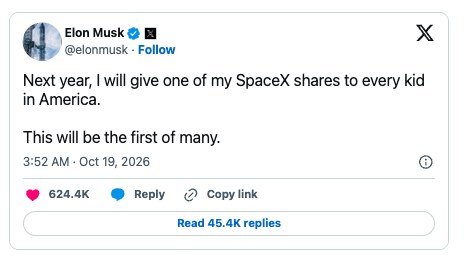
With roughly 73 million children in the U.S. and SpaceX closing at $147.96 that day, Musk’s gift works out to nearly $11 billion. The world’s richest man plans to deliver the shares through the new Trump Accounts. He argues that the best way to spread the AI windfall is by “giving the shares directly to the people.”
He isn’t alone. SpaceX President Gwynne Shotwell and her husband pledged in July to donate SpaceX stock to the accounts of more than 2 million low-income kids. Michael and Susan Dell have pledged $6.25 billion to Trump Accounts for underprivileged children. And Musk is no stranger to big gifts. Back in 2021, he gave roughly $5.7 billion worth of Tesla shares to charity.
I love this idea. A check can get spent immediately, but a share of stock is a stake in American ingenuity, and it can keep growing for decades. It also teaches a lesson I wish every young person learned early. You build wealth by owning things that produce value.
If you haven’t looked at Trump Accounts yet, here’s the short version. The Treasury automatically opens one for eligible children under 18 with a Social Security number, though a parent or guardian has to claim it. Kids born from 2025 through 2028 may qualify for a one-time $1,000 federal deposit. Families can add up to $5,000 a year, the money grows tax-deferred and it’s invested in low-cost U.S. stock index funds. At 18, the account converts to a traditional IRA. Approved philanthropic stock gifts, like Musk’s, don’t count toward the annual limit.
You Don’t Need to Be a Billionaire
The good news is that the principle behind these gifts works at any scale.
I looked at every 18-year period in the S&P 500 Total Return Index going back to 1989, assuming $1,000 invested at birth and $100 added every month. That’s $22,600 in total contributions. In every single period, the account finished ahead.
The worst outcome, which ended at the bottom of the financial crisis in February 2009, was still $27,914. The typical result was about $54,400. The most recent period, ending this September, came to $104,704.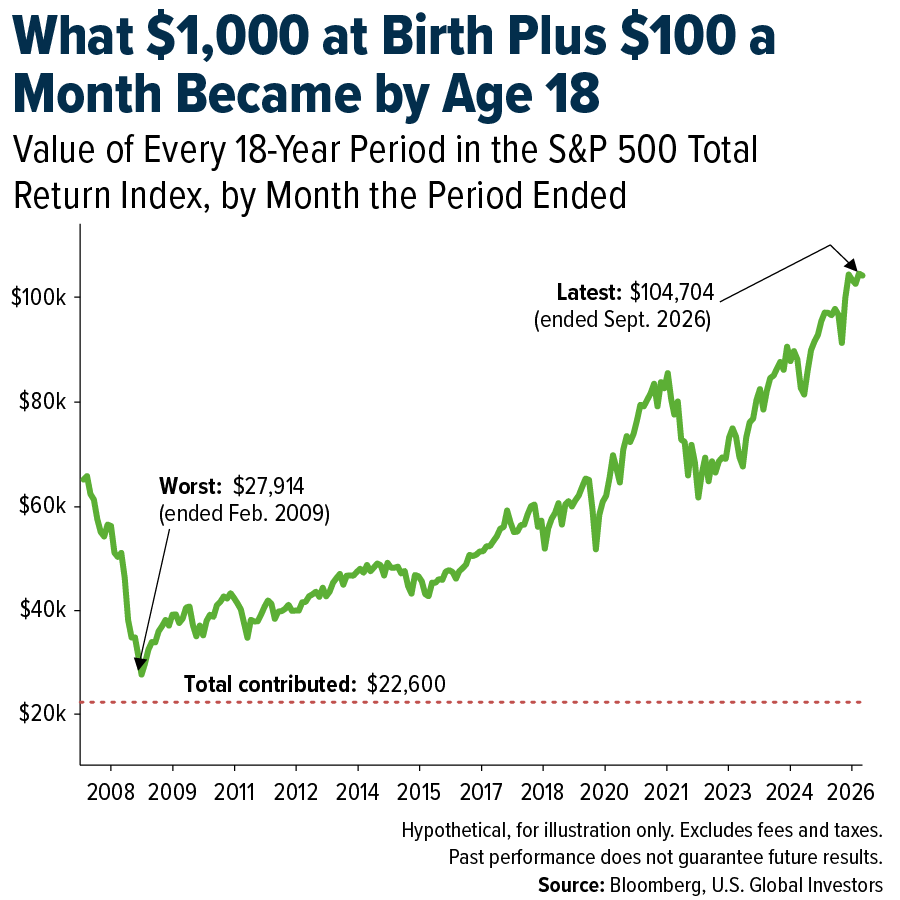
Compare that with $1,000 left alone for 18 years, which typically grew to about $4,150. The seed money helps. The habit of adding to it is what really builds wealth.
If you’re a parent or a grandparent, you can contribute to a child’s Trump Account. And if you’d like to put that same discipline to work for yourself or your family, our ABC Investment Plan lets you start with $1,000 and add $100 a month, automatically. It uses dollar-cost averaging, buying more shares when prices are low and fewer when they’re high, and it takes the guesswork out of market timing.
America’s generosity has always grown out of its prosperity. The AI boom is adding a new chapter, and some of the people building it want the next generation to own a piece of it. I can’t think of a better gift this upcoming holiday season.
Airlines and Shipping
Strengths
- The best-performing airline stock for the week was Grupo Aeropuerto Pacifico, up 8.7%, on better-than-expected earnings. Southwest Airlines reported third-quarter (Q3) adjusted earnings per share (EPS) of $0.66, above FactSet consensus of $0.60. The beat was driven primarily by better-than-expected unit revenue growth, which came in 210 basis points above the high end of the company’s guidance, according to Goldman Sachs.
- China’s port congestion index eased notably during China’s National Day holiday, writes Clarksons, returning to nearly the average level seen in the first half of 2026 (H1 2026). Clarksons has not observed further escalation of El Niño’s impact on Panama Canal transits. The climate phenomenon reduced daily canal transits from 36 to 32 vessels starting in September 2026.
- According to UBS, the 737 MAX 10 has been certified, removing a meaningful regulatory overhang. The MAX 10 represents more than 30% of the MAX order book, with 1,555 orders from more than 30 customers. The next focus is ramping up MAX production.
Weaknesses
- The worst-performing airline stock for the week was JetBlue, down 10.4%, with its bonds trading as low as 40 cents on the dollar. JetBlue shares fell nearly 10% to close at $2.65 on October 22, their lowest level since the company’s 2002 IPO. Shares fell as much as 18% intraday, marking their steepest intraday drop since January 2025. JetBlue bonds totaling $2 billion and due in 2031 plunged to about 40 cents on the dollar, also a record low.
- Hormuz transits are running at roughly 5% of prewar levels, averaging six vessels per day versus the 2025 average of 110, and are expected to remain depressed through late 2026. The first two weeks of October saw the sharpest spike in vessel attacks in recent months, with more than a dozen strikes in the second week alone, including attacks on two Singapore-registered container ships, according to Bloomberg.
- American Airlines cut its full-year outlook and projected a fourth-quarter (Q4) adjusted loss of $0.50 to $1.10 per share, versus the analyst estimate of a $0.49 loss. United Airlines projected Q4 adjusted earnings per share (EPS) of $0.50 to $1.50, below the analyst consensus of $1.88, after fuel expenses surged 61.6% to $4.84 billion in Q3. Southwest Airlines cut its full-year adjusted EPS guidance to $2.60–$2.85, down from its previous range of $3.25–$4.25, as soaring jet fuel costs squeezed profits, according to Bloomberg.
Opportunities
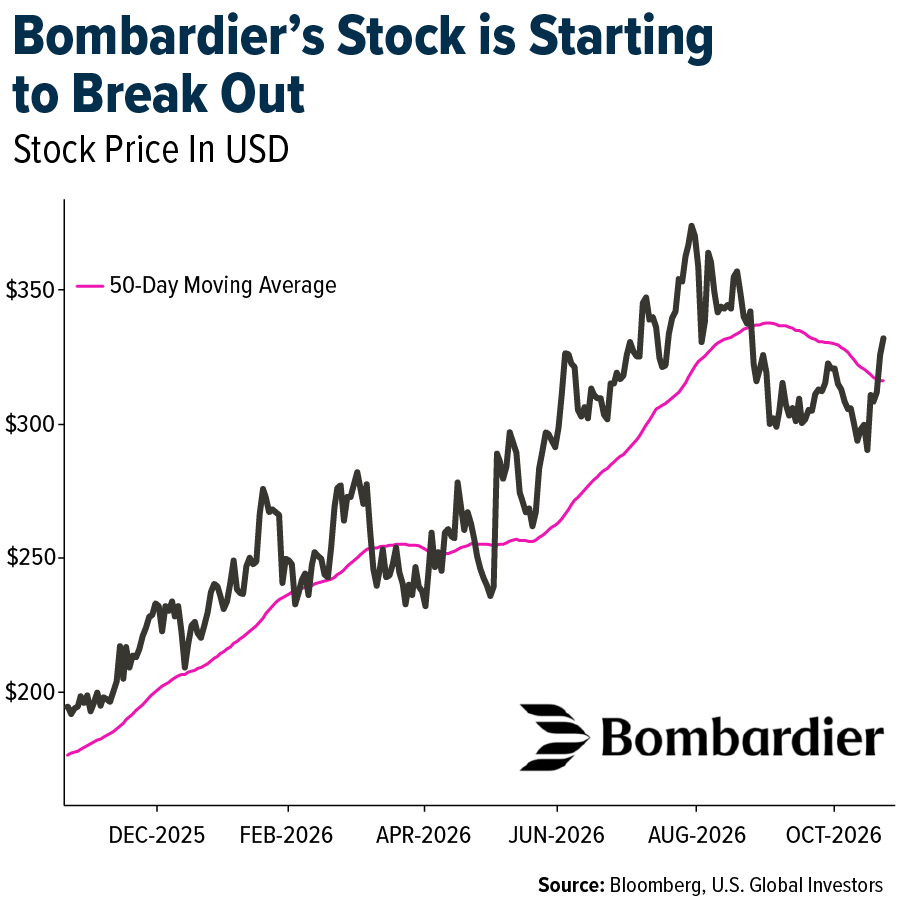
- President Trump indicated Monday that he would not pursue restrictions on Bombardier aircraft sales in the U.S., citing the company’s operations in Kansas and its employment footprint as key factors in his reassessment. The stock moved higher this week.
- According to the TAC Index, the average Hong Kong outbound air freight rate strengthened, with year-over-year (YoY) growth of 26% in September, up from 20% in August. Cathay Pacific expects passenger demand to remain healthy in the fourth quarter (Q4), with cargo demand improving further as the year-end peak season approaches, particularly for semiconductors.
- According to Goldman Sachs, Airbus indicated that it could make an early decision on increasing A350 production beyond its existing plans. Airbus is evaluating larger variants of the A350 and A220, potentially including the A350-2000 and A220-500, although neither program has been formally launched.
Threats
- Narita Airport announced that completion of the planned Runway C has been delayed to December 31, 2034, from the previous target of March 31, 2029. While the long-term growth potential from expanding annual flight capacity from 340,000 to 500,000 flights remains intact, the benefits are likely to be delayed significantly. For ANA Holdings, attention will focus on how management revises its international growth strategy, given that the Narita expansion had been positioned as a key growth driver beginning in FY2029 under its new medium-term plan, reports Morgan Stanley.
- China freight flows showed a sequential decrease of 13.5% in laden vessels traveling from China to the U.S., while volumes declined 3% year over year (YoY). Imports into the Port of Los Angeles are expected to fall 23%, measured in twenty-foot equivalent units (TEUs), Goldman Sachs reports.
- Ryanair CEO Michael O’Leary predicted that European airfares could rise by as much as 20% next year, warning that airline profit margins will remain under pressure because fuel surcharges will not cover the higher cost of oil, according to Bloomberg.
Luxury Goods and International Markets
Strengths
- Swiss watch exports rose 11.7% year-over-year (YoY) in September, marking the fourth consecutive month of growth. Growth was supported by strong shipments to the U.S., which increased 85.7%, while exports to France surged 128.2%.
- Tesla reported better-than-expected third-quarter (Q3) results, with adjusted earnings per share (EPS) of $0.48 versus $0.43 expected and revenue of $28.05 billion versus $27.9 billion expected. Vehicle deliveries also came in well above expectations, while adoption of Full Self-Driving (FSD) technology continued to increase.
- RH, an upscale furniture and home furnishings retailer, was the best-performing stock in the S&P Global Luxury Index over the past five days, with shares climbing 21.6%. Shares rebounded sharply after recently falling near a 52-week low.
Weaknesses
- Gucci continues to be a weak spot for Kering. Third-quarter sales fell 6% year over year to €1.29 billion. Kering said restoring Gucci’s momentum remains its top priority, highlighting the brand’s turnaround as a key challenge for the group.
- Miu Miu, Prada Group’s younger, fashion-focused luxury brand, showed a sharp slowdown in the third quarter. Retail sales fell 3%, compared with 29% growth a year earlier, partly reflecting difficult comparisons and weakness in the Middle East. Miu Miu had been a major growth driver for the group, and weaker momentum could make it harder for Prada Group to sustain its recent growth.
- The Italian Sea Group, a luxury superyacht manufacturer, was the worst-performing stock in the S&P Global Luxury Index, declining roughly 36.4% over the past five days. Shares lost ground as investors remain concerned about the company’s financial position and restructuring, even as it received five binding offers for its assets.
Opportunities
- Luxury travel represents an opportunity as affluent consumers continue to spend on experiences. Deloitte, a global professional services organization that researches major consumer and business trends, found that 36.2% of surveyed luxury executives view luxury travel as the segment with the highest growth potential. This highlights an opportunity for luxury brands to expand beyond traditional products and capture more spending on travel and experiences.
- Luxury hotels continue to outperform the broader hospitality market, supported by strong pricing power and resilient demand for high-end travel. Luxury revenue per available room (RevPAR) rose 13.3% year over year in the first half of 2026, as affluent travelers continued to spend on premium, experience-driven stays despite broader consumer pressures.
- Luxury companies that successfully create scarcity and exclusivity have an opportunity to position their products as stores of value, attracting customers who view certain items as both luxury purchases and collectible assets. Limited supply and restricted access can support strong resale values, particularly for sought-after Hermès bags and select Chanel pieces. This is also boosting the secondhand luxury market, where scarce and hard-to-find products can command higher resale prices, further enhancing the brands’ desirability.
Threats
- Hermès reported slower-than-expected third-quarter sales growth, with revenue rising 4.3% at constant exchange rates, below the 5.2% growth expected by analysts. The main weakness was China, where softer demand, particularly for more accessible accessories such as belts, hair clips and gloves, weighed on sales. These products often serve as entry points for aspirational luxury consumers, suggesting that lower-income luxury shoppers in China remain under pressure.
- Recent unrest in Paris and across France has hurt the luxury sector, with stores belonging to Louis Vuitton, Hermès, Dior and other brands damaged or looted. Industry estimates suggest retail-sector damage could reach several hundred million euros, while broader insured losses have reportedly potentially exceeded €1 billion. The unrest poses a challenge for luxury brands because it can disrupt store operations and shopping activity in key luxury districts.
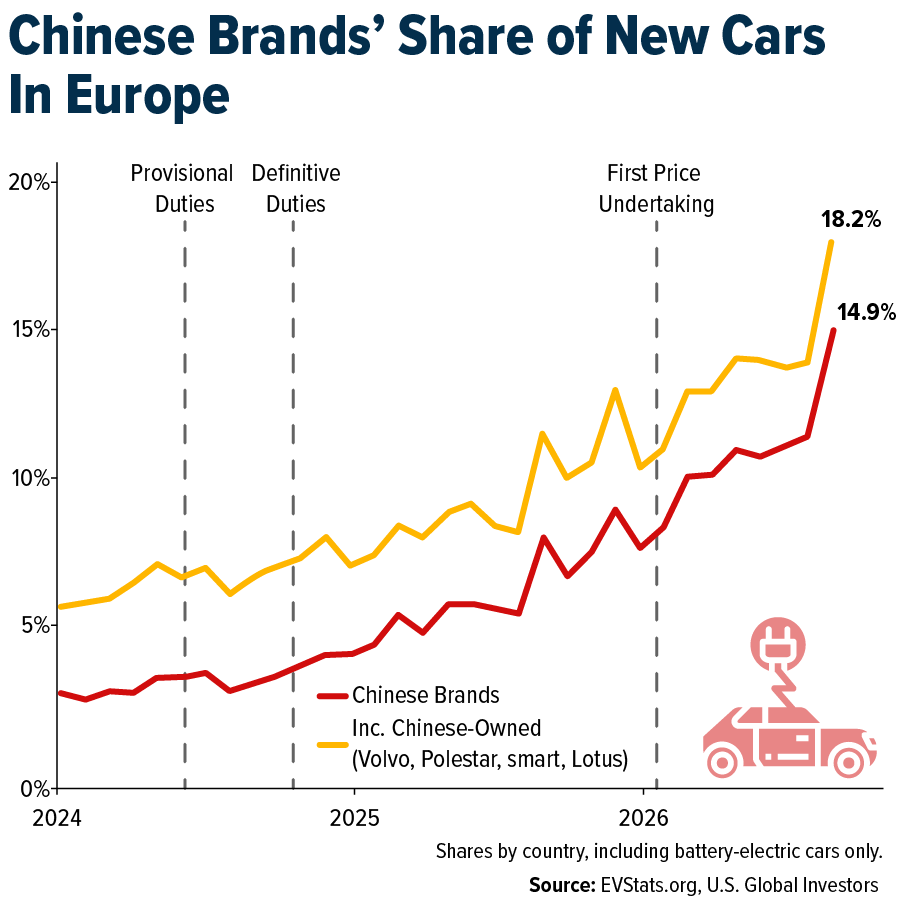
- Chinese automakers are becoming an increasingly important competitive force in Europe, with their share of new-car registrations rising to nearly 15% in September, roughly double the year-earlier level. These rapid gains suggest Chinese brands are capturing market share from established European and other global automakers.
Energy and Natural Resources
Strengths
- The best performing commodity for the week was nickel, up 5.04% on rumors of coordinated output cuts to address an oversupplied market. Cleveland-Cliffs reported strong third-quarter earnings, with adjusted EBITDA more than quadrupling to $612 million, surpassing consensus estimates of $591.5 million. Revenue increased 19% year-over-year to $5.61 billion, slightly below expectations of $5.71 billion. The company returned to profitability, posting net income of $152 million, or $0.26 per share, compared with a net loss of $251 million, or $0.51 per share, a year earlier.
- According to BMO, spot hot-rolled coil (HRC) steel prices continued to rise over the past two weeks, reaching their highest level since May 2022 and extending one of the longest sustained pricing uptrends in recent history. Steel mills continue to increase offer prices as lead times extend into late December, supported by relatively resilient demand.
- Brent crude oil prices climbed toward $111 per barrel amid escalating geopolitical tensions in the Strait of Hormuz. Brent crude is now up 20% since the start of the month with WTI crude up only 16%. UK Maritime Trade Operations reported that a vessel was struck near Oman, while Iran’s IRIB News reported that a supertanker had hit a sea mine in the strait, without identifying the vessel or specifying when the incident occurred. Despite intensifying attacks, oil shipments through the Strait of Hormuz have remained resilient, highlighting the strength of regional energy flows amid ongoing disruptions.
Weaknesses
- The worst performing commodity for the week was natural gas, down 15.73% on forecast that warm weather is expected in the US through November. China’s coal production declined 6.8% year-over-year in September to 385 million tons, extending a trend of annual declines since April, according to Bloomberg. Thermal power generation also fell 1.4%, signaling weaker coal demand from utilities. However, declining coal and gas production ahead of peak winter heating demand could strain domestic energy supplies and test the country’s accumulated fuel inventory.
- Japan’s next-day spot electricity prices surged to their highest level in nearly four years, rising more than 25% week-over-week to 31.15 yen ($0.19) per kilowatt-hour on October 19, according to Bloomberg. Regional increases were particularly sharp, with prices jumping 61% in Kansai and 19% in both Tokyo and Chubu, highlighting mounting electricity cost pressures across the country and the world.
- Soaring shipping costs are squeezing Asian refiners’ profitability despite recovering Middle East crude exports, with freight expenses consuming approximately 82% of gross refining margins, according to Reuters columnist Ron Bousso. Asian refining margins averaged around $40 per barrel in October, according to HiLo Analytics, but shipping costs of roughly $33 per barrel reduced net margins to just over $7 per barrel, highlighting significant pressure on refiners’ earnings.
Opportunities
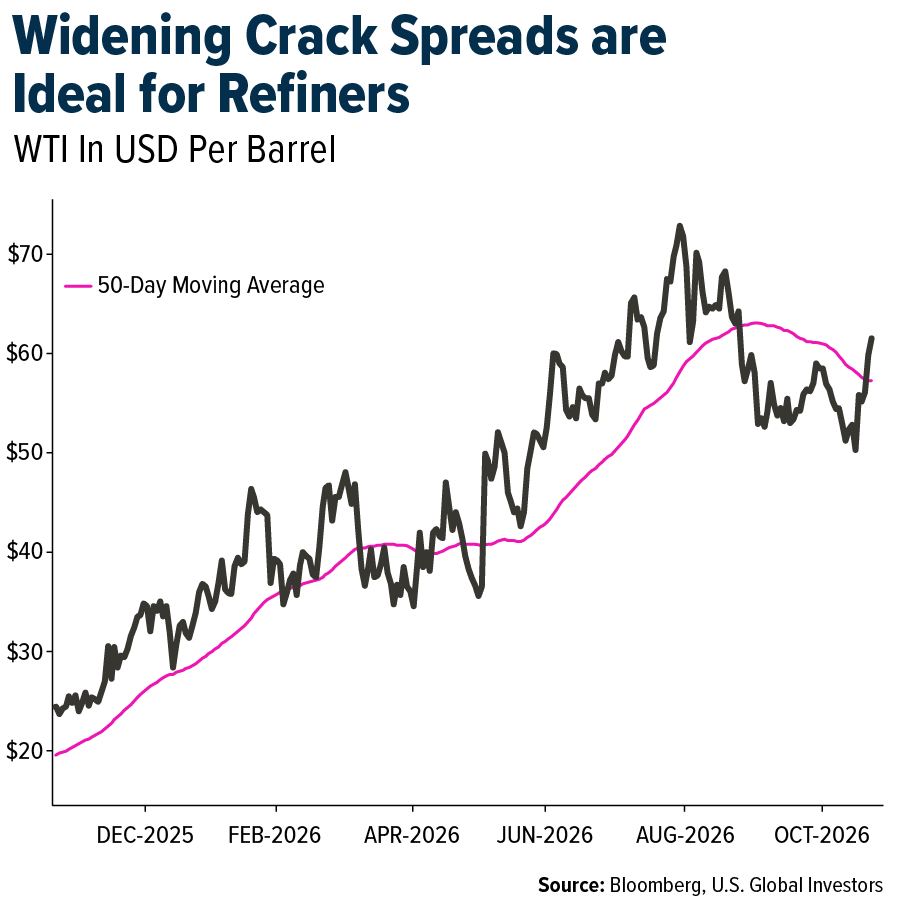
- Refining margins surged 60% quarter-over-quarter, creating opportunities for stronger earnings, free cash flow generation and shareholder returns, according to Morgan Stanley. Tight refined product markets continue to support profitability, although valuations above historical averages suggest further outperformance will depend on sustained supply constraints and favorable market conditions.
- Challenges to maintain existing copper mines and limited new growth coupled with copper demand from artificial intelligence infrastructure could keep the copper price supported. AI demand could reach 2.5 million to 3 million metric tons by 2028, up from approximately 1 million metric tons in 2026, according to Trafigura. Rising hyperscaler capital expenditures could create significant growth opportunities for copper producers as investments in data centers and supporting electrical infrastructure accelerate. Rising interest rates and capital availability could be a constraint.
- Hudbay Minerals and Mitsubishi formally approved construction of the Copper World mine in Arizona, with initial production expected in the second half of 2029, according to Finwire News. The project is projected to produce 102,000 metric tons of copper annually during its first decade, 11% above estimates from a 2023 study. Together with other growth initiatives, Copper World is expected to help double Hudbay’s annual copper production to approximately 250,000 metric tons, strengthening its long-term growth outlook amid rising copper demand.
Threats
- According to Canaccord, copper prices may have outpaced underlying market fundamentals, raising the risk of a correction in 2027. The firm views China’s near-term supply tightness as largely seasonal and amplified by U.S. stockpiling, while production disruptions in Chile are expected to have a limited impact on global supply. As COMEX premiums narrow and U.S. tariff expectations weaken, accumulated inventories could return to the market, adding downward pressure on prices. Meanwhile, data center demand has yet to meaningfully offset weakness in traditional sectors such as property and infrastructure, leaving more than 1 million metric tons of copper available on exchanges.
- Global yttrium supplies are facing significant disruptions, raising concerns about shortages across critical industries, according to Agence France-Presse. Exports of the rare earth metal have reportedly stalled, with Japan potentially facing supply shortages within months. Yttrium is essential for semiconductor manufacturing equipment, aviation engines, electronics, and other industrial applications. China accounts for nearly two-thirds of global rare earth mining and approximately 92% of refined output, highlighting significant supply-chain concentration risks.
- According to UBS, the nickel market continues to face a substantial supply surplus, elevated inventories and expectations of additional production from Indonesia, while a meaningful recovery in battery-related demand appears unlikely. These structural challenges could sustain downward pressure on nickel prices, currently around $15,000 per metric ton, a level that is already within the industry’s production cost curve, amid persistently negative market sentiment.
Bitcoin and Digital Assets
Strengths
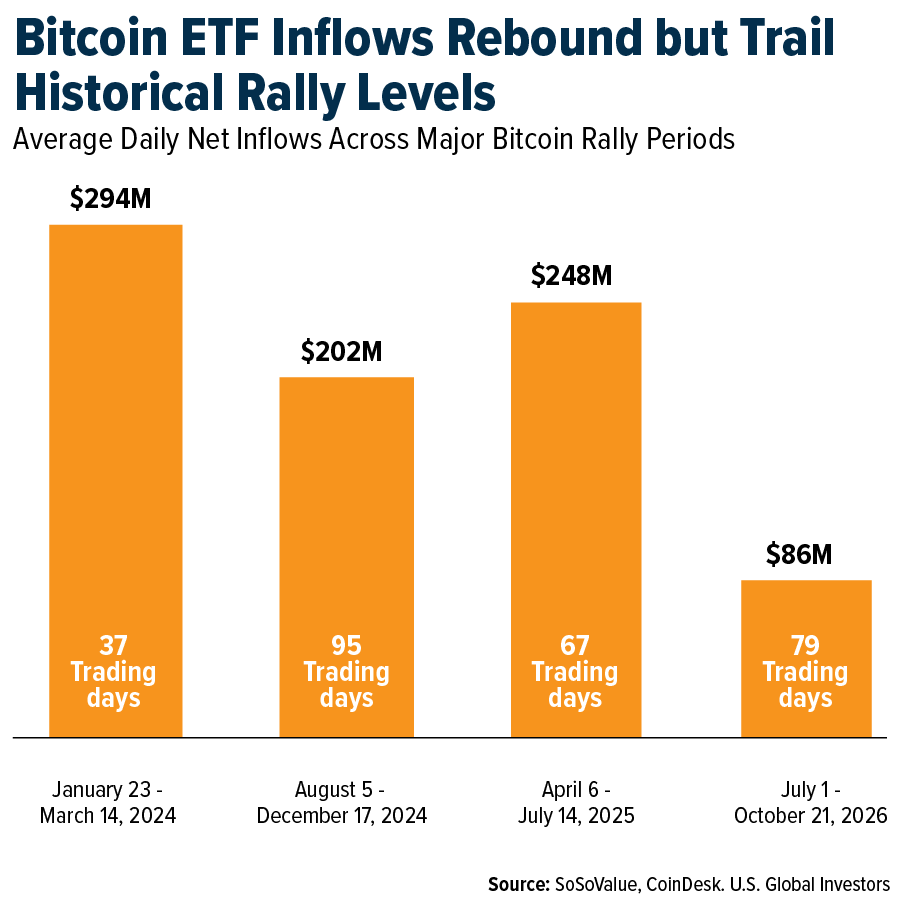
- U.S. spot Bitcoin ETFs recorded $1.08 billion in net inflows over three days, signaling renewed investor demand. However, average daily inflows since July 1 have reached just $86 million, compared with $202 million–$294 million during previous major rallies. The gap suggests that stronger and more sustained institutional buying may be needed to support further Bitcoin price gains.
- HSBC has launched RedCoin (RCHKD), its first Hong Kong dollar-denominated stablecoin, through its PayMe platform, enabling users to make peer-to-peer transfers and payments at more than 100,000 merchants. The launch follows HSBC’s receipt of a stablecoin issuer license in April 2026 and marks a step toward integrating blockchain-based payments into mainstream banking and retail transactions.
- JPMorgan has expanded its U.S. dollar-denominated deposit token, JPM Coin (JPMD), to Ethereum, enabling institutional clients to transfer tokenized deposits across Ethereum and Base. The bank’s Kinexys platform has processed more than $4 trillion in cumulative transactions, averaging $7 billion daily. The expansion highlights growing institutional adoption of public blockchain infrastructure for payments, liquidity management and settlement.
Weaknesses
- Bitcoin fell below $82,000 as renewed doubts about artificial intelligence valuations weighed on risk appetite. Decentralized finance (DeFi) tokens led the declines, falling 5.6%. Crypto liquidations surged 52% to $431.1 million, highlighting heightened market volatility and the sensitivity of digital assets to shifts in technology-sector sentiment.
- Ireland’s central bank fined Coinbase Ireland approximately $3.6 million for deficiencies in safeguarding customer funds after programming errors resulted in an average 0.54% shortfall in its safeguarding account during 2023 and the first half of 2024. Although no customers lost funds or access to their assets, the enforcement action highlights operational and compliance weaknesses that could undermine investor confidence in digital asset platforms.
- Total value locked (TVL) in decentralized finance (DeFi) fell approximately 2% to $90.2 billion on October 23, while weekly decentralized exchange (DEX) trading volume declined nearly 7%. The contraction points to reduced trading activity and less capital committed to DeFi protocols, potentially weighing on transaction fees, platform revenue and investor confidence.
Opportunities
- Southeast Asian central banks have expanded their stablecoin initiative to accelerate cross-border digital payments. The central banks of Malaysia and Thailand have joined Singapore’s BLOOM initiative to explore cross-border payments using regulated stablecoins and tokenized bank deposits. Participants include Ripple, Visa, Mastercard, JPMorgan, Circle and Coinbase, with Ripple testing RLUSD-based trade payments on the XRP Ledger. The initiative could enhance settlement efficiency, financial interoperability and institutional adoption of blockchain-based payments.
- Ethereum developers are exploring a plan to reduce settlement times to approximately four minutes, potentially lowering costs and liquidity requirements for digital asset transfers. For a service advancing $1 million per hour, tied-up capital could decline from approximately $267,000 to $67,000, a 75% reduction. The proposal could enhance Ethereum’s competitiveness in decentralized finance (DeFi), cross-chain transactions and institutional adoption.
- Ripple, a blockchain-based financial technology company specializing in cross-border payments and digital asset infrastructure, now allows institutional clients to trade swaps linked to more than 100 stock, commodity and currency markets around the clock through Ripple Prime, using its RLUSD stablecoin as collateral. Trading firm Virtu is already using the service, highlighting growing integration between traditional finance and digital assets, although limited market liquidity remains a challenge.
Threats
- Cryptocurrency industry involvement in U.S. elections is drawing increased scrutiny, with crypto-backed political action committee Fairshake spending at least $40 million to oppose Senator Sherrod Brown. Meanwhile, the Digital Asset Market Clarity Act failed to advance in the Senate last month, highlighting persistent legislative challenges. Growing political tensions could delay regulatory clarity and undermine investor confidence in digital assets.
- The U.S. Office of the Comptroller of the Currency (OCC) issued its final rule under the GENIUS Act, requiring existing stablecoin rewards programs to undergo regulatory review without automatic exemptions. Programs offering returns of 3.75% on USDC through Coinbase One and up to 4.5% on USDG through Kraken could face scrutiny when the rule takes effect on January 18, 2027, potentially limiting incentives for stablecoin adoption.
- The U.S. Department of Defense prohibited military personnel from using classified or nonpublic information to trade on prediction platforms such as Kalshi and Polymarket, following the indictment of a U.S. soldier accused of earning over $400,000 from bets linked to a military operation in Venezuela. The case exposes vulnerabilities to insider trading and market manipulation, potentially prompting stricter oversight, higher compliance costs and reduced investor confidence in prediction markets.
Defense and Cybersecurity
Strengths
- SpaceX reported very strong third-quarter results, with revenue rising 161% year over year (YoY) to $14.6 billion, driven by rapid growth in its AI-related Super Intelligence business and continued expansion of Starlink. Net income reached $4.4 billion, compared with a $1.1 billion loss a year earlier, while adjusted EBITDA increased 306% to $8.8 billion.
- RTX, a leading aerospace and defense company, reported strong third-quarter results, with sales rising 11% YoY to $25.0 billion and adjusted earnings per share (EPS) increasing 33% to $2.26. Strong demand across commercial aerospace and defense pushed the company’s backlog to a record $340 billion, prompting management to raise its full-year sales, earnings and free cash flow outlook.
- Amazon plans to invest more than €16 billion in Germany in 2027, including billions of euros to expand AWS data center, cloud and AI infrastructure. The investment highlights continued strong demand for AI computing capacity and represents an opportunity for companies supplying data centers with semiconductors, power equipment, cooling systems and other infrastructure.
Weaknesses
- The U.S. government has ordered federal civilian agencies to remove DeepSeek products, including third-party services built using its technology, and prohibited future procurement. The Department of Homeland Security cited risks involving sensitive U.S. government data and cybersecurity vulnerabilities. The move highlights a challenge for Chinese AI companies, as national security concerns can restrict their access to the large U.S. government market.
- Australian data center operator NextDC sharply cut its fiscal year 2027 (FY2027) revenue and earnings outlook this week because of power supply delays at its Melbourne facility. More broadly, grid connections in major data center markets can take four to eight years or longer, creating risks for the pace and cost of AI infrastructure expansion.
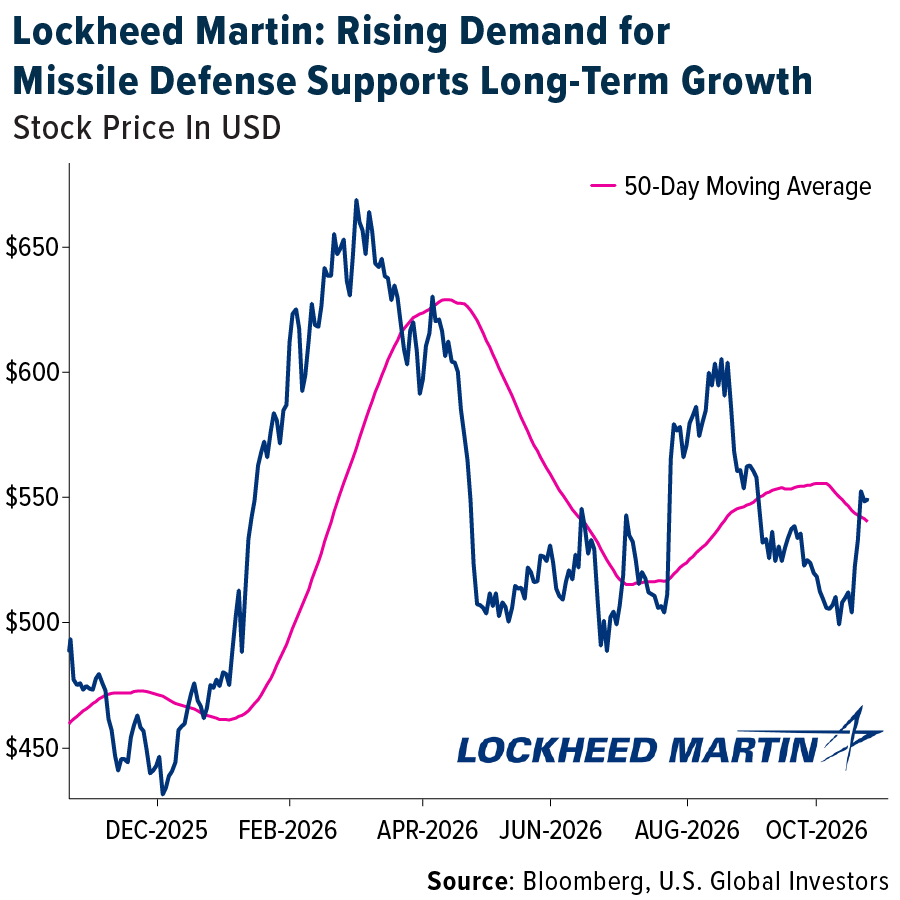
- Defense stocks have recently faced selling pressure, partly due to uncertainty over future U.S. defense spending. Investors are focused on the upcoming midterm elections, as a change in congressional control could make it more difficult to approve the administration’s proposed increase in defense spending. While defense demand remains strong, uncertainty over the size and timing of future budget increases creates a near-term risk for defense contractors.
Opportunities
- Lockheed Martin reported strong third-quarter (Q3) results, with sales up 11% to $20.7 billion, supported by higher aircraft and missile production. Orders reached a record $292 billion, highlighting strong future demand for aerospace and defense products.
- According to technology analyst Dan Ives, the rapid adoption of AI agents is creating new cybersecurity risks, as each autonomous agent becomes another endpoint that must be protected. Ives estimates that cybersecurity spending could increase from roughly 5% of corporate IT budgets today to 10% within the next three years. This could make security one of the fastest-growing areas of enterprise technology spending as organizations deploy more AI-driven systems.
- Chinese technology giants ByteDance, Alibaba and Tencent have reportedly ordered more than 3 million Nvidia RTX PRO 5500 GPUs, with a combined list value of more than $35 billion. The chips comply with current U.S. export restrictions, and reported demand significantly exceeds Nvidia’s planned production. This could present an opportunity for Nvidia, as it suggests demand for its AI computing technology in China remains strong despite U.S. restrictions, potentially providing additional growth opportunities if the company can fulfill more of these orders.
Threats
- Defense stocks have recently faced selling pressure amid uncertainty over future U.S. defense spending. Investors are focused on the upcoming midterm elections and the possibility that changes in congressional control could slow or reduce some proposed increases in defense spending, creating near-term uncertainty for defense contractors.
- On October 19, 2026, China announced tighter export controls on drones, drone components, autonomous navigation systems, autopilots and related technologies, with the new rules scheduled to take effect on November 18, 2026. The measures expand licensing and approval requirements for a range of unmanned aerial vehicle technologies, including systems used in both commercial and defense applications. These restrictions could affect global supply chains for drone and autonomous navigation equipment.
- Rising production costs remain a challenge for defense contractors despite strong demand. Companies such as Northrop Grumman have faced higher costs on fixed-price defense programs, where unexpected cost increases can pressure profit margins because contract prices are largely predetermined. This creates a risk that strong defense spending and growing order books may not fully translate into higher profitability.
Gold Market
This week gold futures closed the week at $4,010.10, down $171 per ounce, or 4.09%. Gold stocks, as measured by the NYSE Arca Gold Miners Index, ended the week lower by 8.49%. The S&P/TSX Venture Index came in off 2.88%. The U.S. Trade-Weighted Dollar fell 0.03%.
Strengths
- The best-performing precious metal for the week was gold, although it was still down 4.09%. Gold gained as much as 0.5% to nearly $4,190 per ounce as traders reduced the probability of a 25-basis-point rate hike to below 20%. Federal Reserve Chair Kevin Warsh’s comments reinforced expectations that interest rates would remain unchanged at next week’s policy meeting, according to Bloomberg. Lower expectations for higher interest rates support gold by reducing the opportunity cost of holding the non-yielding metal.
- Global gold ETF holdings climbed to 101.4 million ounces on Thursday, their highest level since August 2022, representing a 2.5% increase year to date. ETFs added 177,400 troy ounces, equivalent to approximately $734.6 million, in the latest session, bringing year-to-date net purchases to 2.43 million ounces, according to Bloomberg. Continued accumulation highlights sustained investor demand and provides additional support for gold prices.
- Central banks worldwide are reportedly accumulating gold at four times their usual pace while increasingly diversifying storage locations away from the U.S., according to Fortune. Wealthy investors are also relocating gold holdings to Singapore, attracted by its political neutrality and stable legal framework. Singapore’s 180,000-square-foot Reserve vault can accommodate approximately 10% of global annual gold supply, according to Bloomberg. These trends highlight gold’s growing appeal as a strategic reserve asset and safe-haven investment amid geopolitical and financial uncertainty.
Weaknesses
- The worst-performing precious metal for the week was palladium, down 6.58%, likely reflecting pessimistic consumer expectations, as illustrated by the University of Michigan Consumer Sentiment Index’s third consecutive monthly decline. Investors withdrew a net $1.56 billion from SPDR Gold Shares (GLD) in the latest session, marking the fund’s largest one-day outflow since March 4, according to Bloomberg. The fund’s assets declined 1.1% to $136.1 billion, their lowest level since August 4. The withdrawals highlight weakening investor sentiment and raise concerns about the sustainability of recent gold ETF accumulation amid declining bullion prices.
- Fresnillo’s attributable silver production fell 12% year over year to 10.3 million ounces in the third quarter of 2026, missing Scotia’s estimate by 13%, primarily due to weaker output at Saucito and San Julián Veins. Gold production declined 11% year over year to 135,100 ounces, coming in 2% below expectations, as lower ore-processing volumes and declining grades at Herradura and San Julián Veins weighed on output, according to Scotia.
- IAMGOLD’s Côté Gold mine produced 64,400 ounces in the third quarter, 9% below consensus estimates, as extended downtime reduced throughput and recovery rates. RBC estimates the shortfall could lower consolidated third-quarter production by 2–3%, all else equal. The company is now targeting the lower end of its 2026 Côté production guidance of 270,000–310,000 ounces, requiring more than 86,000 ounces in the fourth quarter to meet the minimum target.
Opportunities
- IAMGOLD’s fourth-quarter 2026 mine-plan review at Côté Gold is expected to outline potential expansion options aimed at mitigating margin pressure from declining gold grades beyond 2027, according to Bloomberg. These initiatives could support future production growth, improve operational efficiency and help sustain profitability over the longer term.
- Scotia expects robust free cash flow generation in the third quarter of 2026 and beyond to support continued shareholder returns through dividends and share buybacks. Healthy balance sheets also provide gold producers with financial flexibility to fund organic growth initiatives, potentially strengthening long-term profitability and shareholder value.
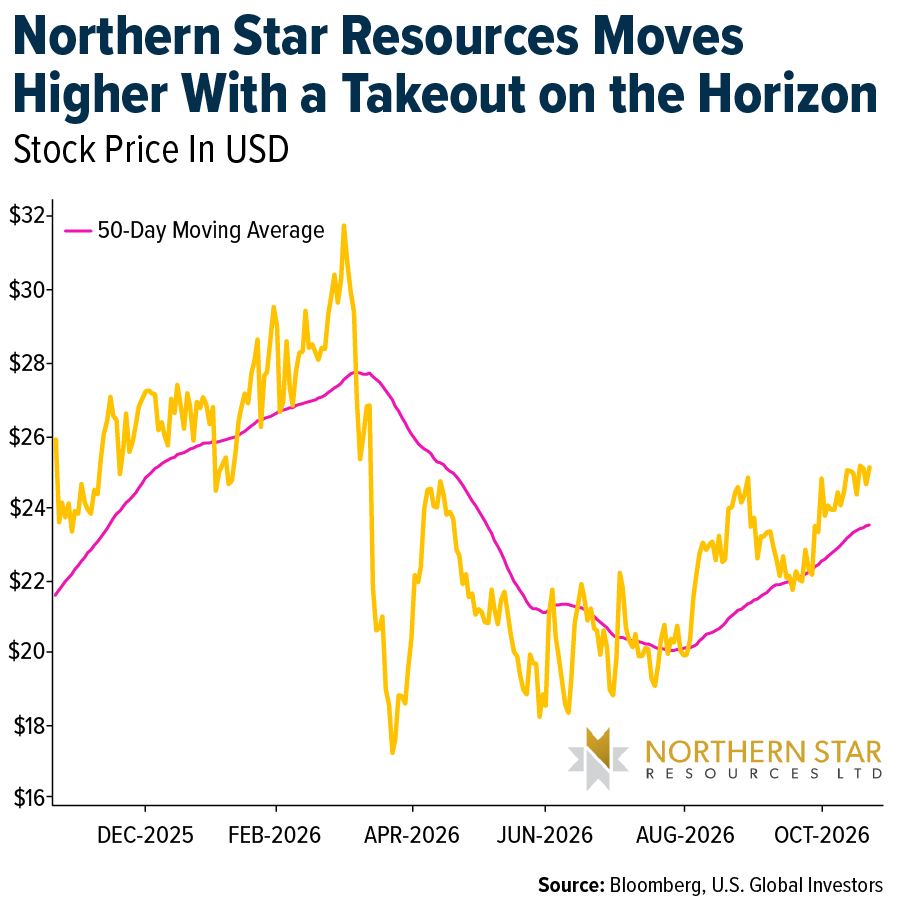
- Northern Star’s new CEO, Suresh Vadnagra, indicated that the company’s board is open to discussions with Gold Fields if the potential acquirer improves its offer, according to the Australian Financial Review. The proposed transaction, previously associated with an estimated $40 billion valuation, could create opportunities for greater operational scale, synergies and consolidation within the gold mining industry.
Threats
- Scotia expects third-quarter 2026 costs to increase across gold producers due to elevated sustaining capital expenditures, inflationary pressures, labor constraints, higher royalties and ongoing stripping activities. While most companies under coverage remain on track to meet their full-year cost guidance, these pressures could weigh on operating margins and profitability.
- Bellevue Gold reported weaker-than-expected gold production of 35,600 ounces, as the ramp-up of a new mining contractor progressed more slowly than anticipated. Ore processing volumes declined 16% quarter-over-quarter to 251,000 tons, while surface stockpiles fell from 47,000 to 10,000 tons as existing inventories were used to supplement underground ore supply, according to UBS. Continued mining constraints and declining stockpiles could threaten future production stability and increase operational risks.
- Ghana is evaluating whether domestic companies should take over major mining operations as the government considers renewing Gold Fields’ lease on a key asset, according to Bloomberg. The potential policy shift could increase regulatory uncertainty for international mining companies, threaten existing operating rights and discourage future foreign investment in the country’s gold sector.
A message from Advisor Perspectives and VettaFi: Discover something new! Click here to register for our upcoming webcasts.
U.S. Global Investors, Inc. is an investment adviser registered with the Securities and Exchange Commission (“SEC”). This does not mean that we are sponsored, recommended, or approved by the SEC, or that our abilities or qualifications in any respect have been passed upon by the SEC or any officer of the SEC.
This commentary should not be considered a solicitation or offering of any investment product. Certain materials in this commentary may contain dated information. The information provided was current at the time of publication. Some links above may be directed to third-party websites. U.S. Global Investors does not endorse all information supplied by these websites and is not responsible for their content. All opinions expressed and data provided are subject to change without notice. Some of these opinions may not be appropriate to every investor.
Holdings may change daily. Holdings are reported as of the most recent quarter-end. The following securities mentioned in the article were held by one or more accounts managed by U.S. Global Investors as of (09/30/2026):
Southwest Airlines
American Airlines
JetBlue Airways
United Airlines
Airbus
Bombardier
Cathay Pacific
ANA Holdings
Ryanair Holdings
NVIDIA Corp.
Tesla Inc.
Kering SA
IAMGOLD
Gold Fields
*The above-mentioned indices are not total returns. These returns reflect simple appreciation only and do not reflect dividend reinvestment.
The Dow Jones Industrial Average is a price-weighted average of 30 blue chip stocks that are generally leaders in their industry. The S&P 500 Stock Index is a widely recognized capitalization-weighted index of 500 common stock prices in U.S. companies. The Nasdaq Composite Index is a capitalization-weighted index of all Nasdaq National Market and SmallCap stocks. The Russell 2000 Index® is a U.S. equity index measuring the performance of the 2,000 smallest companies in the Russell 3000®, a widely recognized small-cap index.
The Hang Seng Composite Index is a market capitalization-weighted index that comprises the top 200 companies listed on Stock Exchange of Hong Kong, based on average market cap for the 12 months. The Taiwan Stock Exchange Index is a capitalization-weighted index of all listed common shares traded on the Taiwan Stock Exchange. The Korea Stock Price Index is a capitalization-weighted index of all common shares and preferred shares on the Korean Stock Exchanges.
The Philadelphia Stock Exchange Gold and Silver Index (XAU) is a capitalization-weighted index that includes the leading companies involved in the mining of gold and silver. The U.S. Trade Weighted Dollar Index provides a general indication of the international value of the U.S. dollar. The S&P/TSX Canadian Gold Capped Sector Index is a modified capitalization-weighted index, whose equity weights are capped 25 percent and index constituents are derived from a subset stock pool of S&P/TSX Composite Index stocks. The NYSE Arca Gold Miners Index is a modified market capitalization weighted index comprised of publicly traded companies involved primarily in the mining for gold and silver. The S&P/TSX Venture Composite Index is a broad market indicator for the Canadian venture capital market. The index is market capitalization weighted and, at its inception, included 531 companies. A quarterly revision process is used to remove companies that comprise less than 0.05% of the weight of the index, and add companies whose weight, when included, will be greater than 0.05% of the index.
The S&P 500 Energy Index is a capitalization-weighted index that tracks the companies in the energy sector as a subset of the S&P 500. The S&P 500 Materials Index is a capitalization-weighted index that tracks the companies in the material sector as a subset of the S&P 500. The S&P 500 Financials Index is a capitalization-weighted index. The index was developed with a base level of 10 for the 1941-43 base period. The S&P 500 Industrials Index is a Materials Index is a capitalization-weighted index that tracks the companies in the industrial sector as a subset of the S&P 500. The S&P 500 Consumer Discretionary Index is a capitalization-weighted index that tracks the companies in the consumer discretionary sector as a subset of the S&P 500. The S&P 500 Information Technology Index is a capitalization-weighted index that tracks the companies in the information technology sector as a subset of the S&P 500. The S&P 500 Consumer Staples Index is a Materials Index is a capitalization-weighted index that tracks the companies in the consumer staples sector as a subset of the S&P 500. The S&P 500 Utilities Index is a capitalization-weighted index that tracks the companies in the utilities sector as a subset of the S&P 500. The S&P 500 Healthcare Index is a capitalization-weighted index that tracks the companies in the healthcare sector as a subset of the S&P 500. The S&P 500 Telecom Index is a Materials Index is a capitalization-weighted index that tracks the companies in the telecom sector as a subset of the S&P 500.
The Consumer Price Index (CPI) is one of the most widely recognized price measures for tracking the price of a market basket of goods and services purchased by individuals. The weights of components are based on consumer spending patterns. The Purchasing Manager’s Index is an indicator of the economic health of the manufacturing sector. The PMI index is based on five major indicators: new orders, inventory levels, production, supplier deliveries and the employment environment. Gross domestic product (GDP) is the monetary value of all the finished goods and services produced within a country’s borders in a specific time period, though GDP is usually calculated on an annual basis. It includes all private and public consumption, government outlays, investments and exports less imports that occur within a defined territory.
The S&P Global Luxury Index is comprised of 80 of the largest publicly traded companies engaged in the production or distribution of luxury goods or the provision of luxury services that meet specific investibility requirements.
Please consider carefully a fund’s investment objectives, risks, charges and expenses. For this and other important information, obtain a fund prospectus by visiting our prospectus page or by calling 1-800-US-FUNDS (1-800-873-8637). Read it carefully before investing. Foreside Fund Services, LLC, Distributor. U.S. Global Investors is the investment adviser.
Bond funds are subject to interest-rate risk; their value declines as interest rates rise. Tax-exempt income is federal income tax free. A portion of this income may be subject to state and local income taxes, and if applicable, may subject certain investors to the Alternative Minimum Tax as well. The Near-Term Tax Free Fund may invest up to 20% of its assets in securities that pay taxable interest. Income or fund distributions attributable to capital gains are usually subject to both state and federal income taxes. The tax free funds may be exposed to risks related to a concentration of investments in a particular state or geographic area. These investments present risks resulting from changes in economic conditions of the region or issuer. Gold, precious metals, and precious minerals funds may be susceptible to adverse economic, political or regulatory developments due to concentrating in a single theme. The prices of gold, precious metals, and precious minerals are subject to substantial price fluctuations over short periods of time and may be affected by unpredicted international monetary and political policies. We suggest investing no more than 5% to 10% of your portfolio in these sectors. Foreign and emerging market investing involves special risks such as currency fluctuation and less public disclosure, as well as economic and political risk. By investing in a specific geographic region, a regional fund’s returns and share price may be more volatile than those of a less concentrated portfolio. The Emerging Europe Fund invests more than 25% of its investments in companies principally engaged in the oil & gas or banking industries. The risk of concentrating investments in this group of industries will make the fund more susceptible to risk in these industries than funds which do not concentrate their investments in an industry and may make the fund’s performance more volatile. Because the Global Resources Fund concentrates its investments in a specific industry, the fund may be subject to greater risks and fluctuations than a portfolio representing a broader range of industries. Stock markets can be volatile and share prices can fluctuate in response to sector-related and other risks as described in the fund prospectus.
Morningstar Ratings are based on risk-adjusted return. The Overall Morningstar Rating for a fund is derived from a weighted-average of the performance figures associated with its three-, five- and ten-year (if applicable) Morningstar Rating metrics. Past performance does not guarantee future results. For each fund with at least a three-year history, Morningstar calculates a Morningstar Rating? based on a Morningstar Risk-Adjusted Return measure that accounts for variation in a fund’s monthly performance (including the effects of sales charges, loads, and redemption fees), placing more emphasis on downward variations and rewarding consistent performance. The top 10% of funds in each category receive 5 stars, the next 22.5% receive 4 stars, the next 35% receive 3 stars, the next 22.5% receive 2 stars and the bottom 10% receive 1 star. (Each share class is counted as a fraction of one fund within this scale and rated separately, which may cause slight variations in the distribution percentages.)
Each of the mutual funds or services referred to in the U.S. Global Investors, Inc. website may be offered only to persons in the United States. This website should not be considered a solicitation or offering of any investment product or service to investors residing outside the United States. Certain materials on the site may contain dated information. The information provided was current at the time of publication. For current information regarding any of the funds mentioned in such materials, please visit the fund performance page. Some link(s) above may be directed to a third-party website(s). U.S. Global Investors does not endorse all information supplied by this/these website(s) and is not responsible for its/their content. All opinions expressed and data provided are subject to change without notice. Some of these opinions may not be appropriate to every investor.
Membership required
Membership is now required to use this feature. To learn more:
View Membership Benefits