Stocks chopped this summer as high hopes for AI product and infrastructure development were offset by rising inflation and an increasingly hawkish Federal Reserve. The large company S&P 500 rose 2.0%, while the small cap Russell 2000 index dropped by 7.5%. As energy, healthcare, and technology stocks led the charge, gaining 15.8%, 6.2%, and 2.7% over the quarter, rate-sensitive consumer staples, utilities, and industrial stocks lagged.
From the midterm elections to geopolitics and rapidly evolving monetary policy changes, the rest of 2026 is bound to have surprises in store. Below are six charts we’re watching closely as we kick off the final quarter of the year.
Gas Prices vs. Election Results
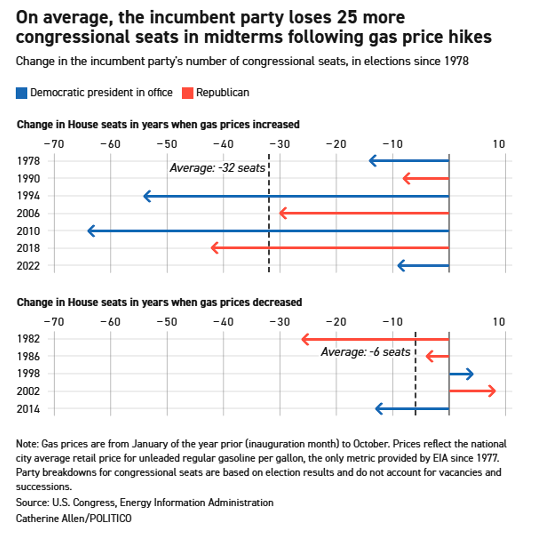
In our July commentary, we speculated that Republicans may not want conflict combat in Iran to drag out, as the war is unpopular among Americans and the shutdown of the Strait of Hormuz and regional oil refining capacity is spiking the cost of energy. While there are dozens of factors that impact an election outcome, rising gasoline and diesel prices are acutely painful for consumers and businesses and have historically led to substantial election losses for the incumbent political party.
With just one month before the elections, conflict in the Middle East is ongoing, and gasoline prices are at their highest level in an election year in modern history. Historically low levels in emergency global oil reserves also reduce the ability of governments to provide relief to consumers and businesses.
In our opinion, the conflict in Iran appears likely to drag on through year-end, suggesting oil prices will stay in the high double digits and low triple digits. Higher energy costs impact the prices of most goods within an economy and may lead to elevated inflationary pressures as well.
See more: Investing After a Liquidity Event
#2 Federal Reserve Interest Rate Projections
Members of the Federal Reserve met on September 16th to announce policy changes to combat the ongoing threat of higher prices. They highlighted that inflation had been above their target of 2.0% for 65 consecutive months and that prices need to stabilize. In a unanimous decision, they voted to increase their benchmark “Federal Funds Rate” by 0.25% and issued guidance for another rate increase before year-end.
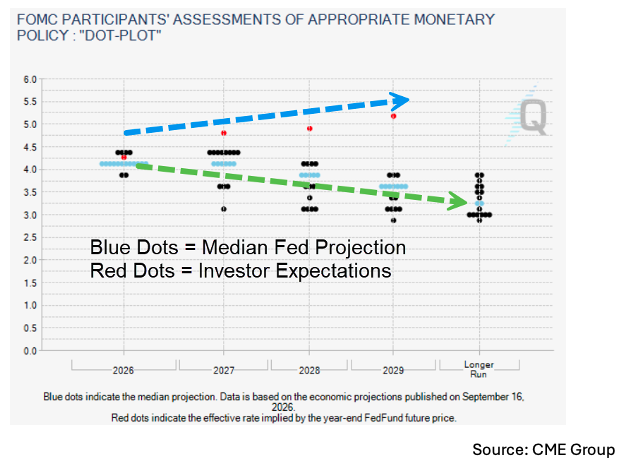
The Federal Reserve’s Federal Open Market Committee (FOMC) publishes their “dot-plot” every quarter with their projections of where they expect rates to be in the future. The “median” dots, highlighted in blue below, are often viewed as a type of consensus estimate from the FOMC. As the graph shows, Fed officials expect one hike before year-end, no hikes next year, and then rate cuts through 2028 and 2029.
Market expectations, as represented by the red dots, predict a completely different rate path, with two more hikes this year, two next year, and another before 2029. Will it really take rates above 5.00%, like in 2022, to conquer inflation? We don’t think so, as the majority of current inflation has been energy/event driven, and it seems reasonable to think the Iran conflict will end by 2029 (our opinion). Or, if not, perhaps alternate means of transportation could be developed over the next few years to bypass the volatile Strait of Hormuz.
#3 & #4 Record P/E Ratios Meet Record Earnings Growth
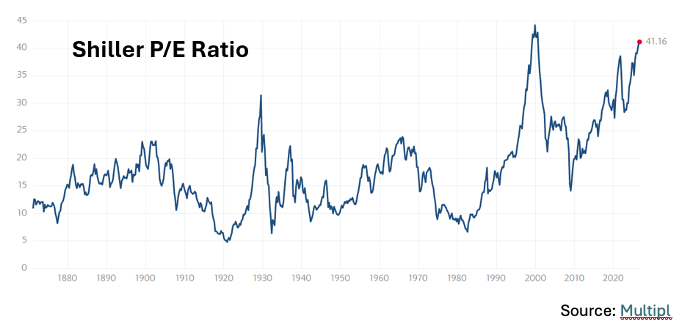
As stocks touched new all-time highs in August, so did their valuations, making equities comparably more expensive versus history to own. One metric we watch closely is the “Shiller Price/Earnings Ratio (Shiller P/E),” which is rising and approaching its highest level since the dot-com bubble of the late 1990s. Those who lived through the dot-com bubble may see parallels to today, such as a handful of mega cap technology stocks driving most of the gains in the S&P 500 recently, just as they did during the dot-com bubble.
In other aspects, today’s market is completely different, with the top stocks in the S&P 500 posting near all-time high profit margins compared to the early 2000s, when many dot-com companies struggled to even post a profit.
Earnings growth is important and potentially the reason why stocks have been able to shrug off record high Shiller P/Es thus far. In other words, valuations are elevated but may be justified due to blistering profit margin expansion and robust expectations for the future.
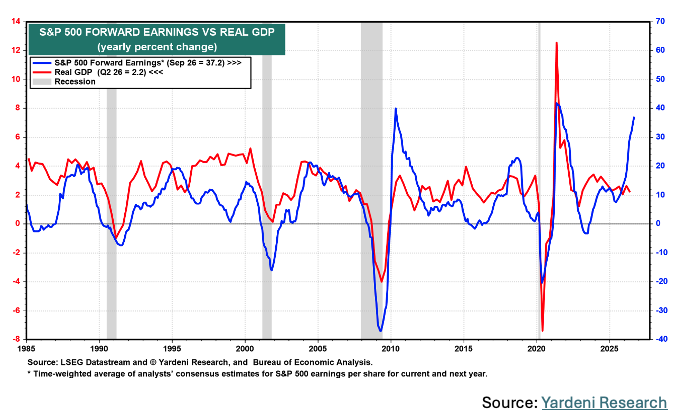
For reference, the chart below shows anticipated annual earnings growth for the S&P 500 versus real GDP. Earnings growth is currently at 37.2% over the last year—that kind of increase has not been seen over the last 40 years, aside from the initial months coming out of a recession. To have this kind of earnings expansion during the middle of a market cycle is nearly unheard of.
The bottom line is that growth is likely currently justifying stock valuations. However, a growth-driven market is not a risk-free one, and stocks could react negatively if a profitability scare ever develops. Some items we’re watching closely include how high borrowing costs are affecting margins, a potentially stretched American consumer, and how elevated fuel and energy costs are impacting the economy as a whole.
#5 – The Federal Debt & Rising Interest Costs
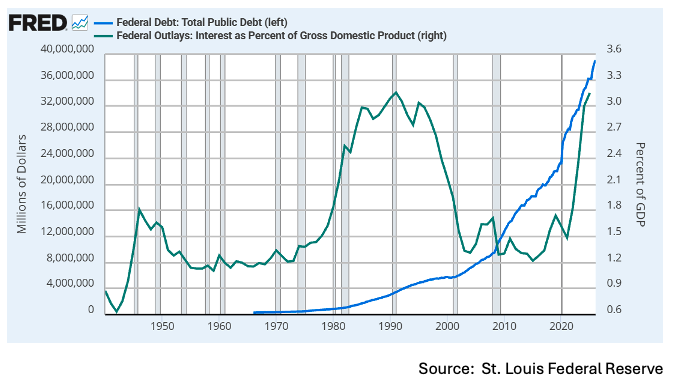
The US national debt crossed $40 trillion in September, marking a grim milestone for the nation’s balance sheet. Social Security/Medicare, combined with COVID-era stimulus and ongoing defense spending related to international conflicts (Ukraine, Israel/Hamas, Iran) account for the majority of spending, while the tax cuts from July’s One Big Beautiful Bill Act have been reducing cash inflows to the Treasury’s coffers.
Up until 2021, the deficits were concerning, but low interest rates made borrowing for stimulus relatively cheap, and debt servicing costs remained contained. That changed in 2022 as the Federal Reserve began raising rates to fight inflation. Borrowing costs have continued to increase since, with ten-year Treasury yields rising from around 1.50% in 2021 to 5.29% as of last week. As a result of rising yields and interest rates, debt servicing costs have jumped from 1.20% to 3.15% of Gross Domestic Product, while interest payments now account for 15% of all federal spending.
Previous Federal Reserve Chair Jerome Powell spoke about the deficit earlier this year, noting that while the national debt isn’t causing large and immediate negative consequences to the economy, the rate of spending is unsustainable and needs to be addressed. We suspect deficits will become an increasingly important issue after the midterms, as investors are becoming hesitant to give loans to the US government (via purchases of Treasury bonds). This can cause intermediate- and long-term Treasury rates to increase further, complicating funding even more and increasing the costs for financing (especially business loans and mortgages) for Americans.
For now, deficit spending has helped stimulate the economy and has likely done the same corporate profits and stock performance. Deficit-fueled growth isn’t sustainable for the long-term, however, and the government will need to make some difficult decisions in the years to come. Otherwise, there’s a real risk that rising interest payments begin eating into longer-term economic growth.
#6 - A Robust Labor Market
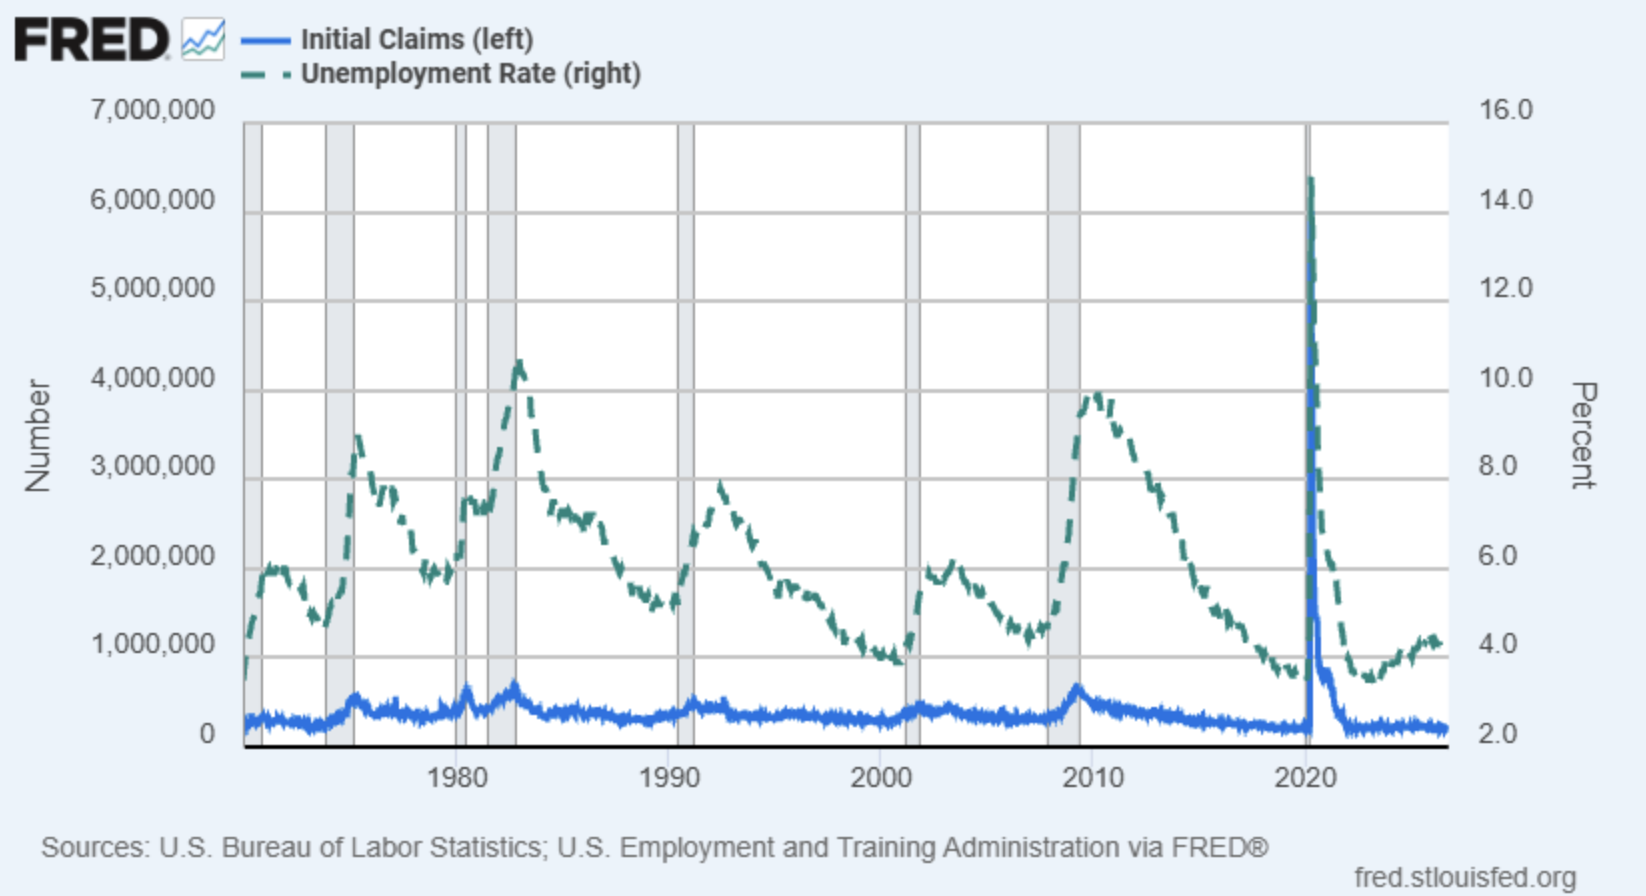
Despite rising energy prices, interest rates, and uncertainty surrounding global trade policies (e.g., tariffs), the labor market is strong. In fact, weekly claims for unemployment benefits recently touched a 57-year low, while the unemployment rate has steadily drifted lower this year. Given that joblessness and layoffs are two of the most important signs of an economic slowdown, recent labor market data suggests a low level of recession risk heading into the final months of the year.
Complementing strong employment data are an increasing number of job openings and falling layoff activity in 2026, indicating that the late-2025 weakness in the labor market has largely reversed. This should increase the ability of the global economy to withstand future exogenous shocks and government policy changes without falling into a period of negative growth.
The Bottom Line – A Bullish Outlook, But Plenty of Data to Monitor
The bottom line is that stocks have climbed a “wall of worry” in 2026, rising despite a news reel that has dispensed countless reasons to potentially sell. Based on our analysis of the economy, stocks, and other leading business cycle indicators, growth is expected to continue through year-end. As always, there’s still the potential for pullbacks and corrections, but they should likely be viewed as buying opportunities.
On behalf of WELLth Financial Planning, we wish you a happy fall and look forward to serving you through the holiday season and beyond.
A message from Advisor Perspectives and VettaFi: Discover something new! Click here to register for our upcoming webcasts.
© WELLth Financial Planning
More Municipal Bonds Topics >