This month’s Muni Monthly covers performance, supply and demand technicals, fundamentals and valuations for the month ending August 2026.
Performance Overview: Long-end municipals underperformed in August.
Market volatility persisted in August as investors were again forced to reassess escalating tensions and an exchange of military strikes in the Middle East, while softer labor-market data was countered by mixed inflation readings. Total nonfarm payroll jobs declined by 23,000 in July and headline Consumer Price Index (CPI) eased modestly to 3.4% from 3.5% year-over-year, while core Personal Consumption Expenditures (PCE) remained unchanged at 3.3%. Against this backdrop, the Treasury curve flattened, with yields rising approximately 5 basis points (bps) in shorter maturities and declining approximately 3 bps in longer maturities.
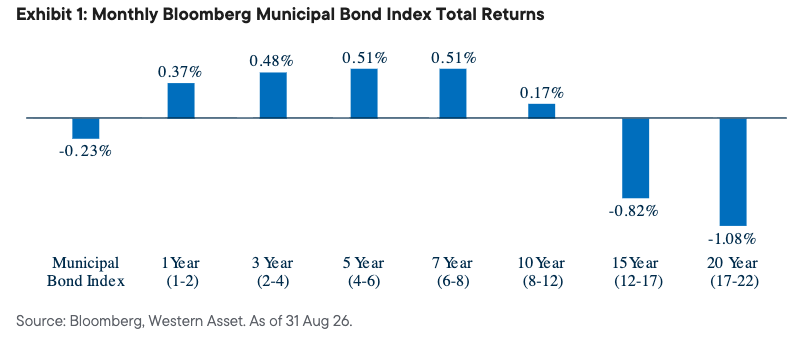
Municipals posted negative returns in August, underperforming taxable investment-grade fixed-income sectors, which largely posted positive returns (the Bloomberg Municipal Index returned -0.23% for the month, while the U.S. Aggregate Index returned 0.39%). Municipal underperformance was largely driven by curve steepening, which contrasted with the flattening observed in taxable markets and weighed on returns in the longest maturities, amid elevated rate volatility and a continued record pace of issuance.
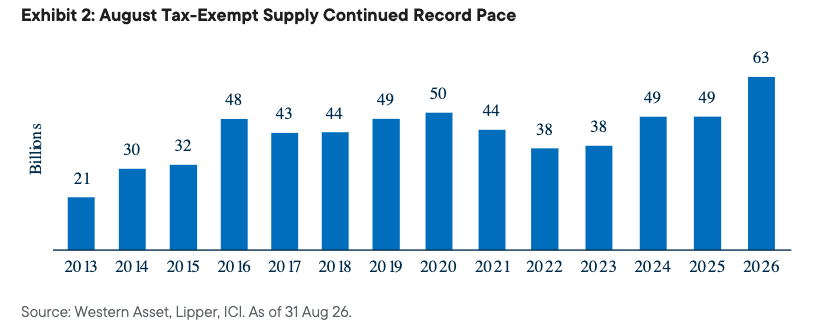
Technicals: Elevated issuance in August continued a record trend.
See more: Muni Monthly: July 2026
Municipal technicals remained dominated by record supply levels. Total municipal issuance reached $63 billion in August, up 30% from July and 35% above the 10-year average. Meanwhile, fund flows continued to reflect steady demand for municipal securities. According to Lipper, municipal funds recorded $8.4 billion of inflows, bringing year-to-date (YTD) net inflows to $77 billion, well above the $60 billion recorded for the full 2025 calendar year. The current inflow cycle began in December 2023 and has generated approximately $181 billion of net inflows, now the second-largest cycle by cumulative flows, only $3 billion below the post-pandemic record ($184 billion), and the second-longest by duration (141 weeks), according to ICI and Lipper data.
Fundamentals: Strong credit fundamentals drive continued rating upgrades across the municipal market.
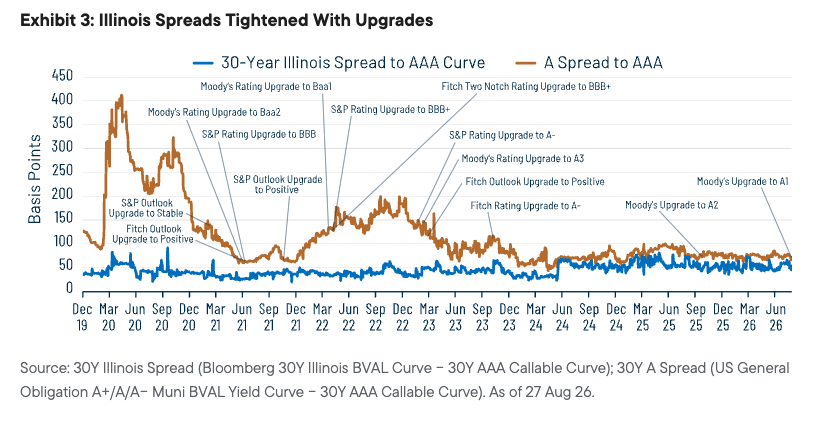
Strong municipal credit fundamentals continued to support rating upgrades across the market. Moody’s upgraded the State of Illinois’ general obligation bonds by one notch, from A2 to A1, and maintained a stable outlook. The agency also upgraded Illinois sales tax bonds and Metropolitan Pier and Exposition Authority bonds. These actions mark the 14th consecutive positive rating action by Moody’s, S&P or Fitch since the pandemic-related market disruption in April 2020, when Illinois carried ratings equivalent to BBB− across the three agencies, with negative outlooks or watches.
Despite Illinois’ outperformance and the substantial spread compression since 2020, the market continues to price a modest concession relative to similarly rated municipal securities. This may present opportunities for investors who believe the state’s positive credit trajectory can continue. However, with much of the credit improvement now reflected in valuations, we believe generating further outperformance in this tighter-spread environment will require increasingly rigorous credit analysis and security selection.