Key takeaways
- Investor sentiment is unusually split: subdued surveys contrast with elevated stock allocations, persistent ETF inflows, and record margin debt, so the market is not yet showing a uniformly euphoric extreme.
- Recent speculative excess has been unwound mainly through sharp rotations—especially in artificial intelligence (AI)-related industries—rather than a broad index decline, creating the potential for reflexive rallies (sharp, short-lived market rebounds occurring after a period of heavy selling or a deep correction) in beaten-down market leaders.
- Longer-term risks remain elevated: near-record household equity exposure and surging leverage have historically pointed to weaker forward returns, while the economy's growing reliance on the stock-market wealth effect raises the stakes of a potential prolonged downturn.
The equity market has continued to defy gravity this year amidst a stop-and-start war in the Middle East, questions over how the Federal Reserve plans to tackle inflation, and a 19-year high in 30-year Treasury bond yields. Considering the persistent nature of geopolitical and policy-related stress, the S&P 500's high single-digit return year-to-date looks respectable. It has made for an interesting investor sentiment backdrop: while investors have continued to pile into the market via strong ETF flows and high margin debt balances, they have done so reluctantly as attitudes have been more subdued.
See more: Margin Debt Jumps 7.9% in June to Another Record High
Typically, when behavioral (e.g., ETF flows, margin debt, real money positioning, etc.) and attitudinal (e.g., surveys, sentiment indexes, etc.) sentiment congregate in one extreme, they provide contrarian signals for the stock market. We aren't yet seeing that dynamic today, given there is still a gap between the behavioral and attitudinal sentiment metrics we track. More recently, some of the froth in the former has been wrung out, driven by the significant unwind in industries that became central to the AI momentum trade (semiconductors and memory chips, to name a few).
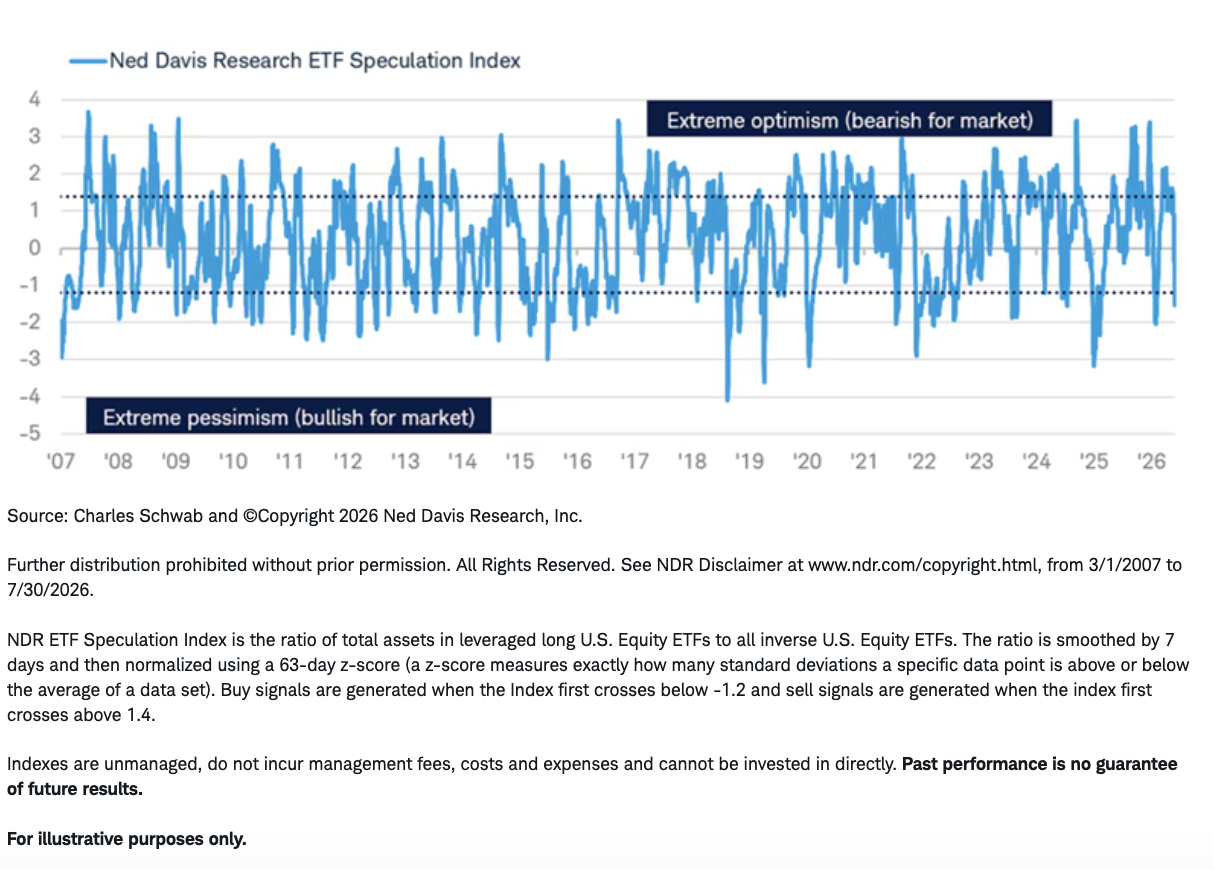
That shows up clearly in the ETF Speculation Index from our friends at Ned Davis Research (NDR). The index compares assets in leveraged long ETFs versus those in inverse ETFs, so it's a good behavioral gauge of investor optimism. As you can see in the chart below, the index had recently been in extreme optimism territory but has reversed sharply into extreme pessimism territory in a matter of two weeks—triggering what NDR calls a "buy signal." We are not market timers, nor are we recommending you buy or sell, but we point this out to say that given momentum's severe washout of late, investors shouldn't be surprised by strong, reflexive rallies in some AI mega caps.
Strong momentum reversal
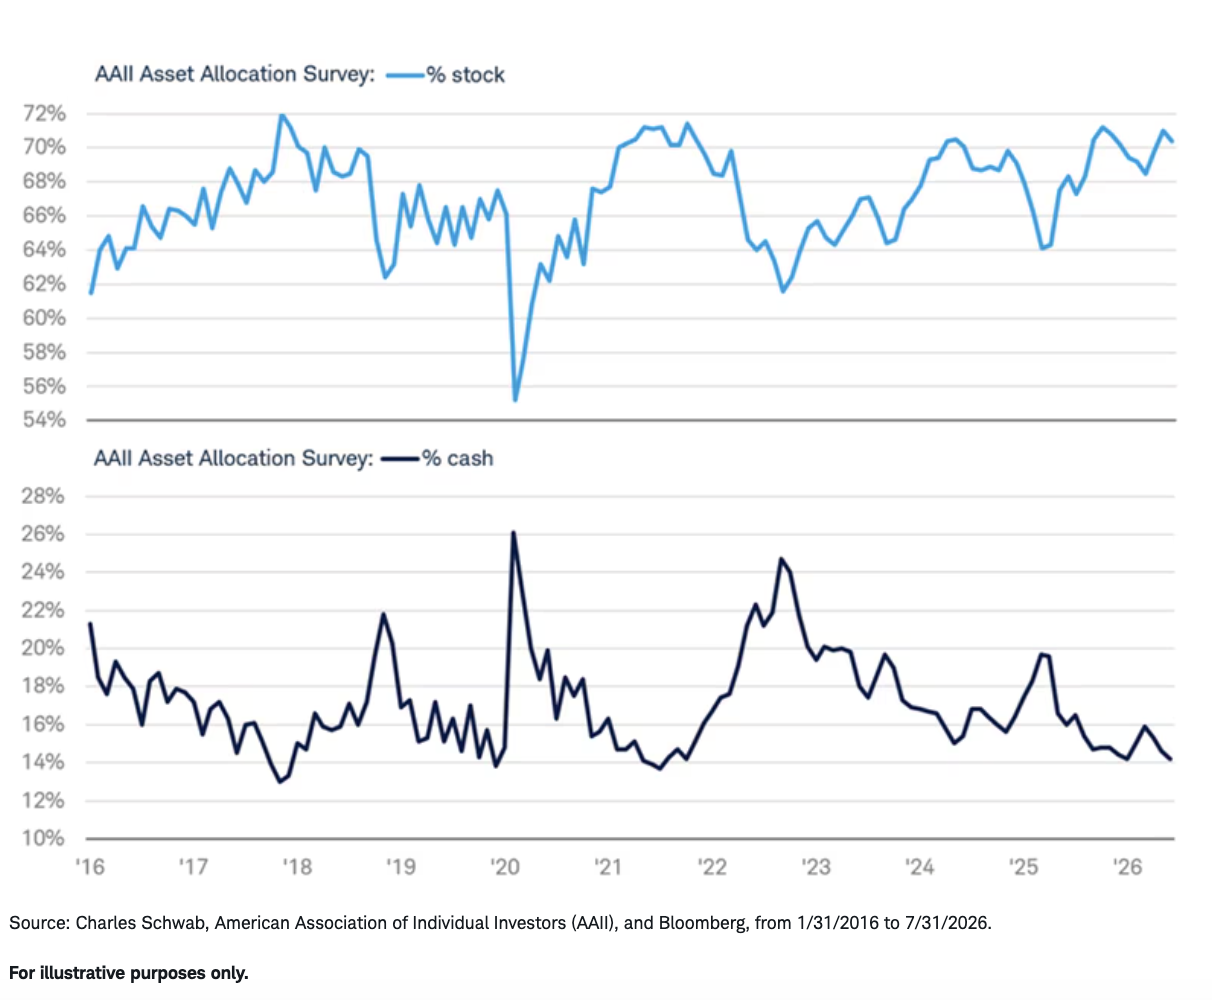
As we mentioned, investor attitudes have not been consistent with their behavior this year. Shown below are two components of the weekly American Association of Individual Investors (AAII) Sentiment Survey: the percentage of respondents saying they are bullish or bearish on stocks. We like to look at the spread between the two and right now not only is it negative, it's nowhere near prior periods that were consistent with major market tops.
Market vibes are not great
However, this lack of excitement about the market's path has not stopped respondents from reporting higher stock allocations. You can see in this next chart that equity positions have been rebuilt strongly over the past year—now near the highs in 2021 and 2018. At the same time, cash seems to have been shunned.
Investors' positioning supports stocks
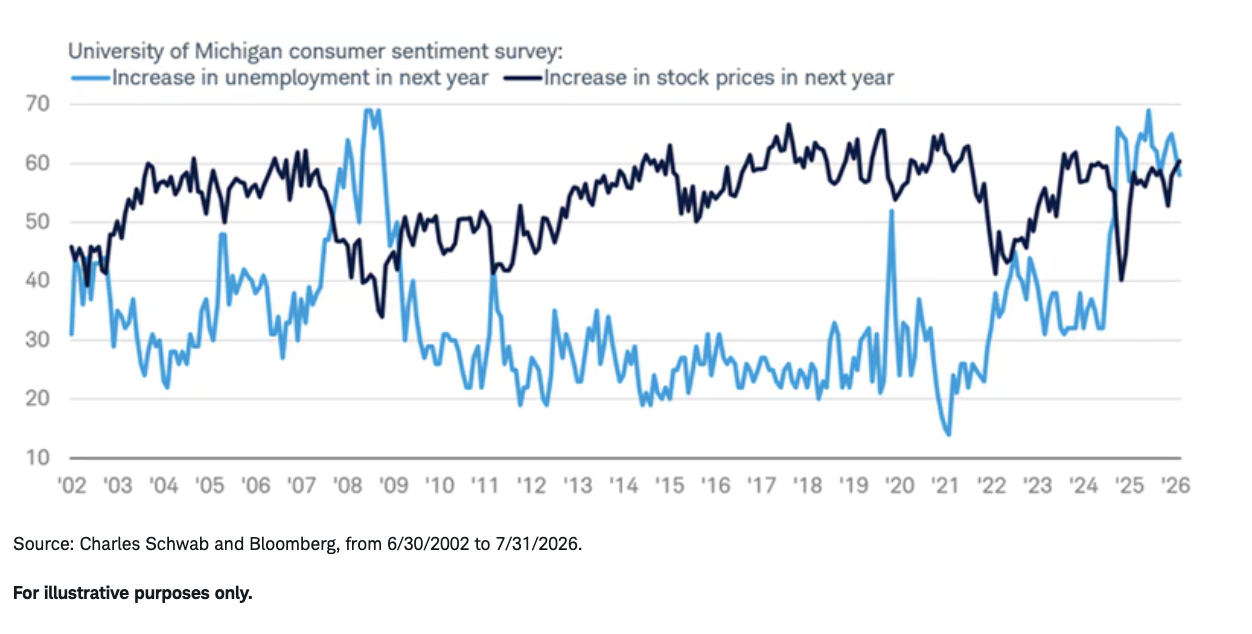
Not all surveys lean pessimistic, though. When asked if they expect stocks to move higher in the next year, a majority of respondents to the University of Michigan's consumer sentiment survey said yes as of July, as you can see in the chart below. While this metric has moved up over the past year, it isn't yet in what we would consider an extreme zone. Plus, you can also see that consumers are still quite anxious about the labor market, with a recession-like majority expecting an increase in unemployment in the next year. This chart would be flashing a bigger warning if both lines were at opposite extremes; 2021 is a clear, classic example of complacency setting in when it comes to market and economic vibes.
Market optimism, economic pessimism
Saying vs. doing
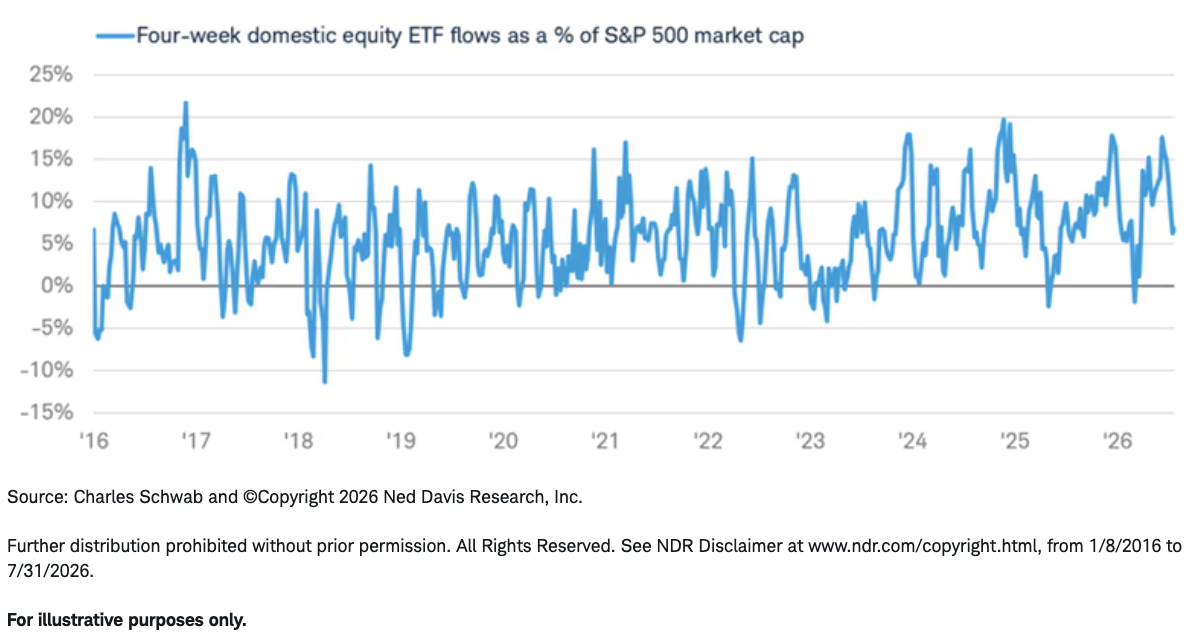
Shifting focus to investor behavior is where we see more enthusiasm and optimism. Shown below is the rolling four-week total of flows into equity ETFs as a percentage of S&P 500 market cap. With the exception of some brief instances, this has been net positive for the past couple of years. Some air has come out recently, consistent with the reversal in ETF speculation we mentioned earlier, but the general message is that investors have treated dips as buying opportunities.
Buying the dips
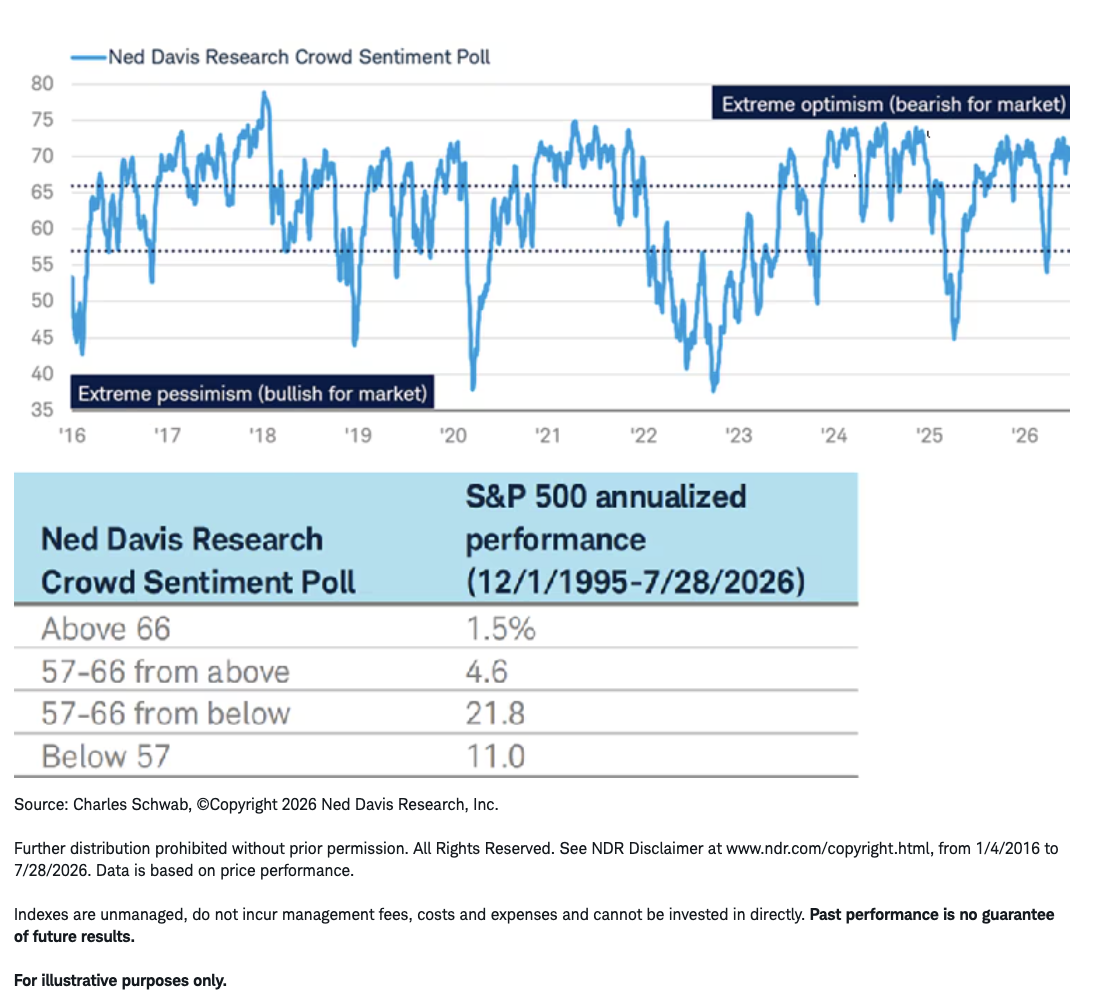
Longer-term, aggregate sentiment metrics underscore that complacency might be setting in. Shown below is NDR's Crowd Sentiment Poll (CSP)—an amalgamation of several behavioral and attitudinal metrics with a long history—which has been in extreme optimism territory since mid-April (not coincidentally, shortly after the market's low of the year). As is typically the case after a major correction and subsequent rally, sentiment is now in a zone consistent with weaker returns historically, which is confirmed by the accompanying table.
Extreme optimism, weaker returns
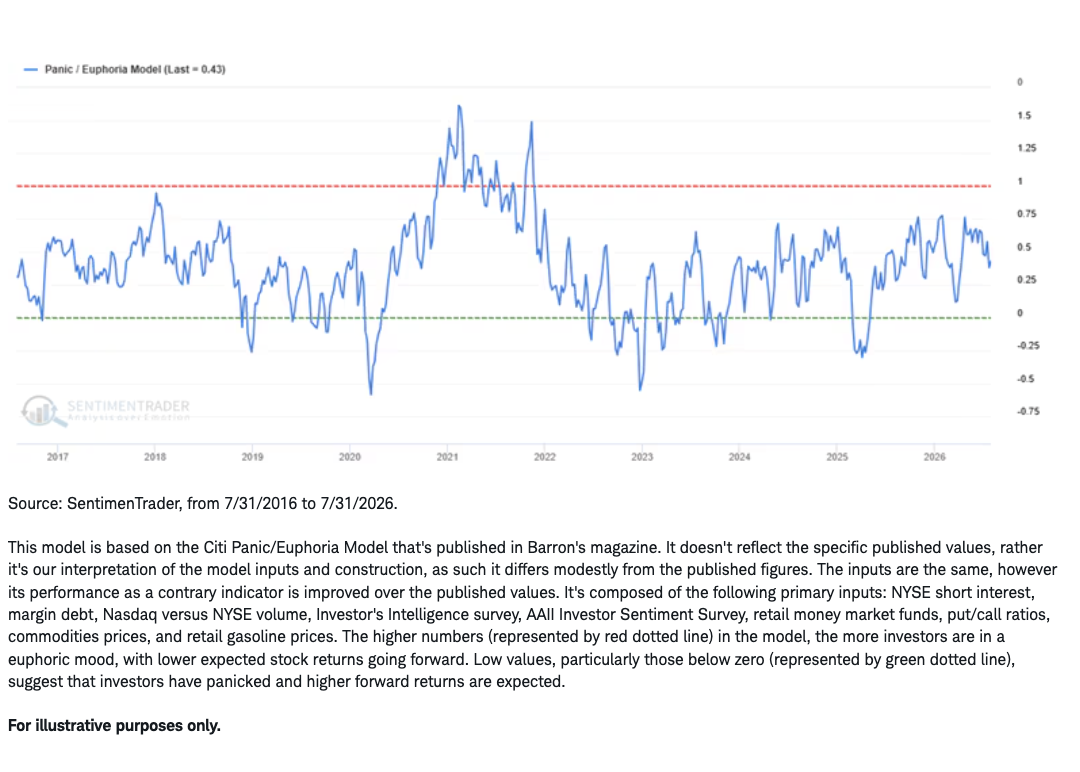
Not all aggregate metrics are telling the same story of extreme optimism. SentimenTrader's Panic/Euphoria Model remains far from euphoric territory. Like NDR's CSP, it includes behavioral and attitudinal measures of sentiment, but also has commodities and gasoline prices as well. The latter could very well be one of the key reasons for a more subdued reading lately.
No euphoria in Panic/Euphoria
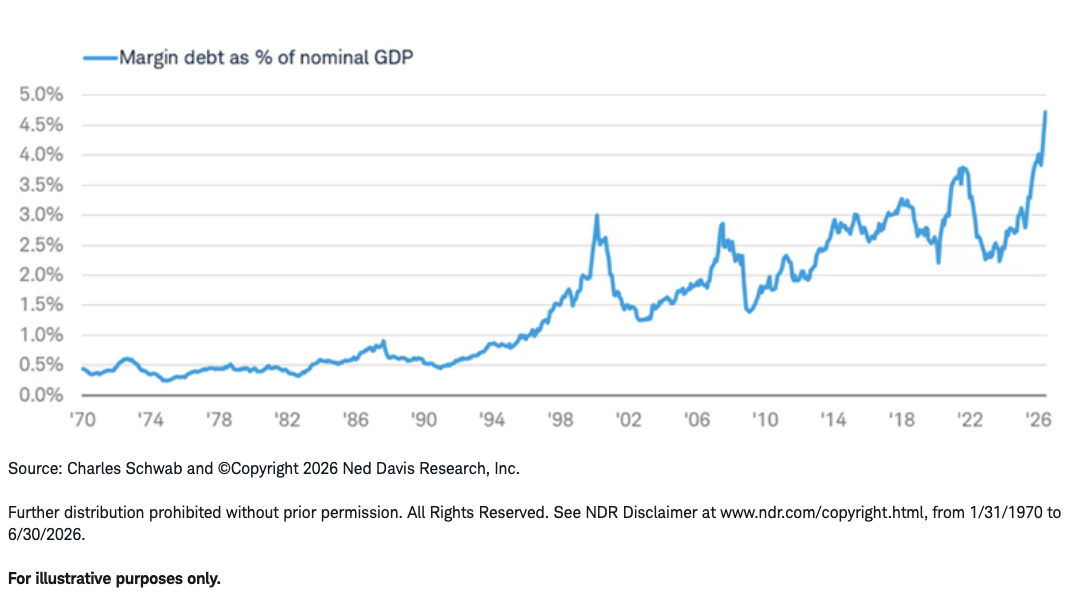
Among the indicators we track, margin debt is perhaps giving the biggest warning sign. As a share of nominal GDP, it has spiked to an all-time high. Casually eyeing this chart, one can see that peaks in margin debt's GDP share have historically coincided with major market peaks: the late 1990s/early 2000s, the housing bubble, and the 2021 meme craze, to name a few.
Margin debt soars
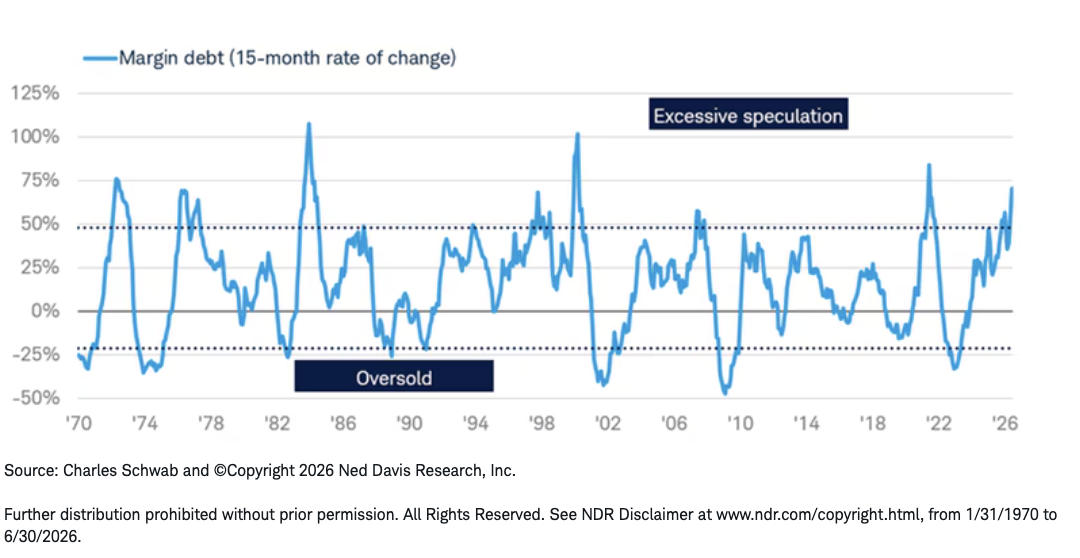
However, looking at just the level of debt paints an incomplete picture—it's the change in debt that provides a clearer signal for the market. Shown below is the 15-month rate of change in margin debt. Like the level of debt, it also sends a warning sign of excessive speculation. The key with this metric, though, is when it moves back into neutral territory (below the upper dotted line). Historically, the market has suffered most when margin debt's 15-month change is reversing sharply from excessive speculation territory after making a peak.
Growth in debt peaking?
Summing it up
The collection of sentiment metrics we keep an eye on is not yet painting a purely euphoric environment. Of course, there have been indicators consistent with shorter-term froth, but as we have learned from market behavior over the past couple of months, said froth has been taken out of the market via rotational corrections as opposed to a major, index-level decline. Case in point: the S&P 500 is unchanged over the past two months, while the Philadelphia Stock Exchange Semiconductor Index is down by 11.5%.
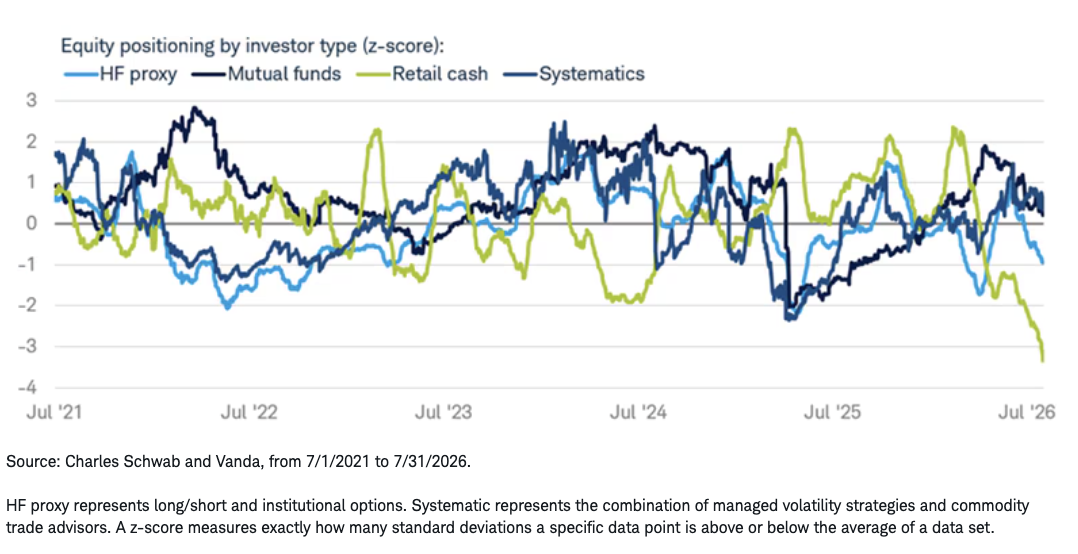
As corrections have been confined to certain industries and themes, the same can be said of equity positioning adjustments among investor cohorts. Data from our friends at Vanda Research show that for the past several months, retail positioning has declined sharply while mutual funds and systematics have held higher conviction in the equity market (essentially, the opposite of where things were at this point last year). The retail cohort is in a prolonged period of derisking, so we'll be watching as to whether investors turn bullish on beaten-down AI baskets. Should that be the case, it could exacerbate some of the reflexive rallies we mentioned earlier.
Retail takes a breather
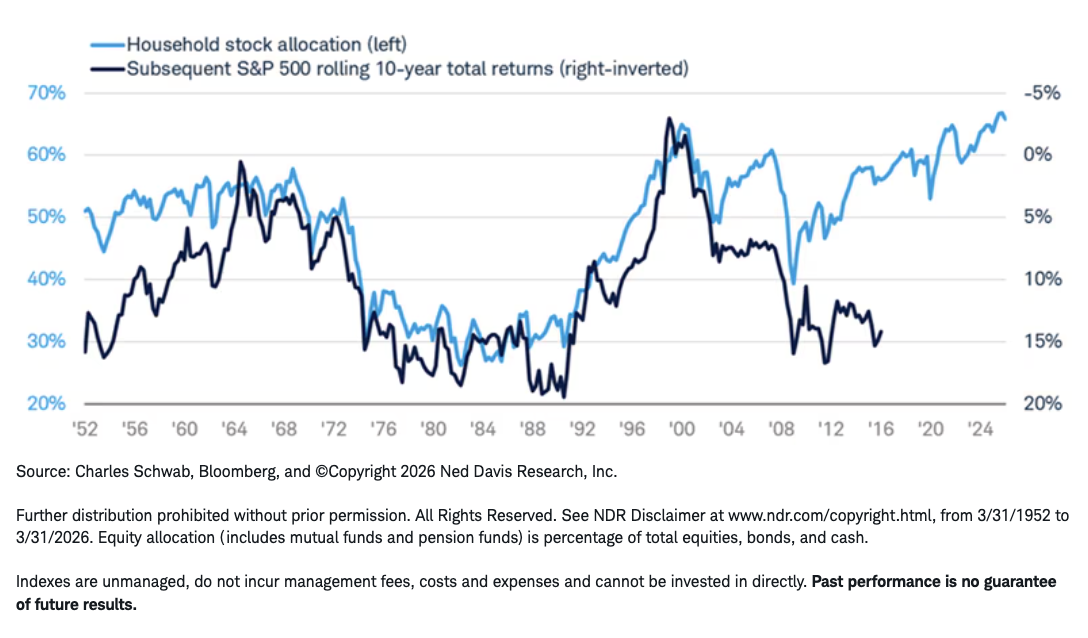
Taking a longer-term look at sentiment, the "ultimate" behavioral metric continues to show that U.S. investors are extremely bullish on the stock market. Household stock allocations are right near an all-time high and remain slightly above the peak at the beginning of 2000. As you can see in the chart below, this much of an allocation historically coincides with weaker returns for the stock market in the following 10 years.
Households firmly holding onto equities
It's not a perfect relationship, however, and has in fact started to fray in recent years. If anything, we would focus more on what this means for the economy. As savings have been drawn down immensely and consumer income growth has been constrained by supply-driven inflation, the wealth effect from stocks has become an increasingly important factor in helping drive consumption. This raises the risk of a prolonged slump in the equity market leading to economic weakness, as was the case in the early 2000s. As we have learned over the past several years, it's not necessarily the depth of the drawdown in stocks that matters, but the duration.
A message from Advisor Perspectives and VettaFi: Discover something new! Click here to register for our upcoming webcasts.
Investment and Insurance Products Are: Not FDIC Insured • Not Insured by Any Federal Government Agency • Not a Deposit or Other Obligation of, or Guaranteed by, the Bank or any of its Affiliates • Subject to Investment Risks, Including Possible Loss of Principal Amount Invested
The Charles Schwab Corporation provides a full range of brokerage, banking and financial advisory services through its operating subsidiaries. Its broker-dealer subsidiary, Charles Schwab & Co., Inc. (member SIPC), and its affiliates offer investment services and products. Its banking subsidiary, Charles Schwab Bank, SSB (member FDIC and an Equal Housing Lender) provides deposit and lending services and product. Its banking subsidiary, Charles Schwab Premier Bank, SSB (member FDIC) provides cryptocurrency services and products.
© Charles Schwab
More Practice Management Topics >