QuantStreet August 2026 Letter: Sector Rotation Continues
Membership required
Membership is now required to use this feature. To learn more:
View Membership Benefits
July 2026 was a flattish month for markets. The S&P 500 index was down slightly. Value did well, while momentum did poorly. Smallcaps, midcaps, and emerging markets, all of which have been the year’s best performers, had a bad month. Commodities, driven largely by oil prices, led the pack, as the fragile ceasefire in Iran failed to hold.
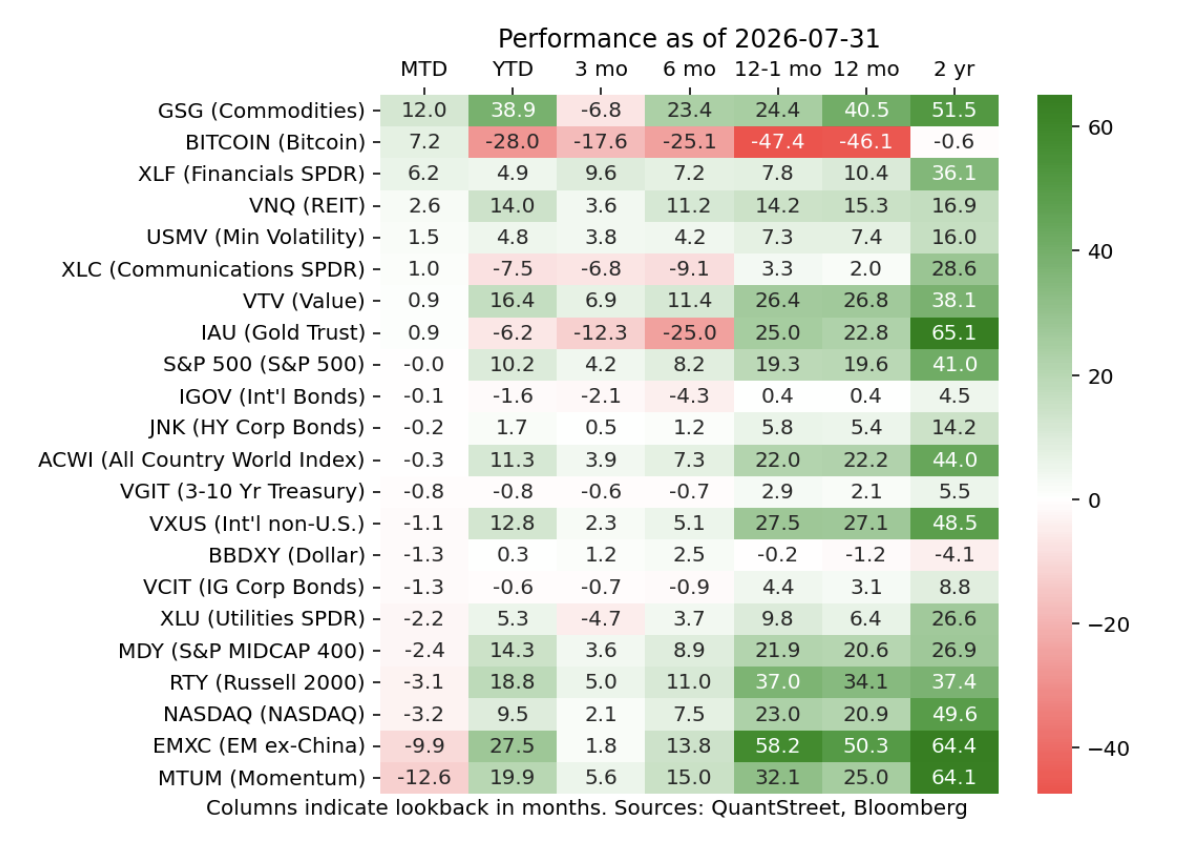
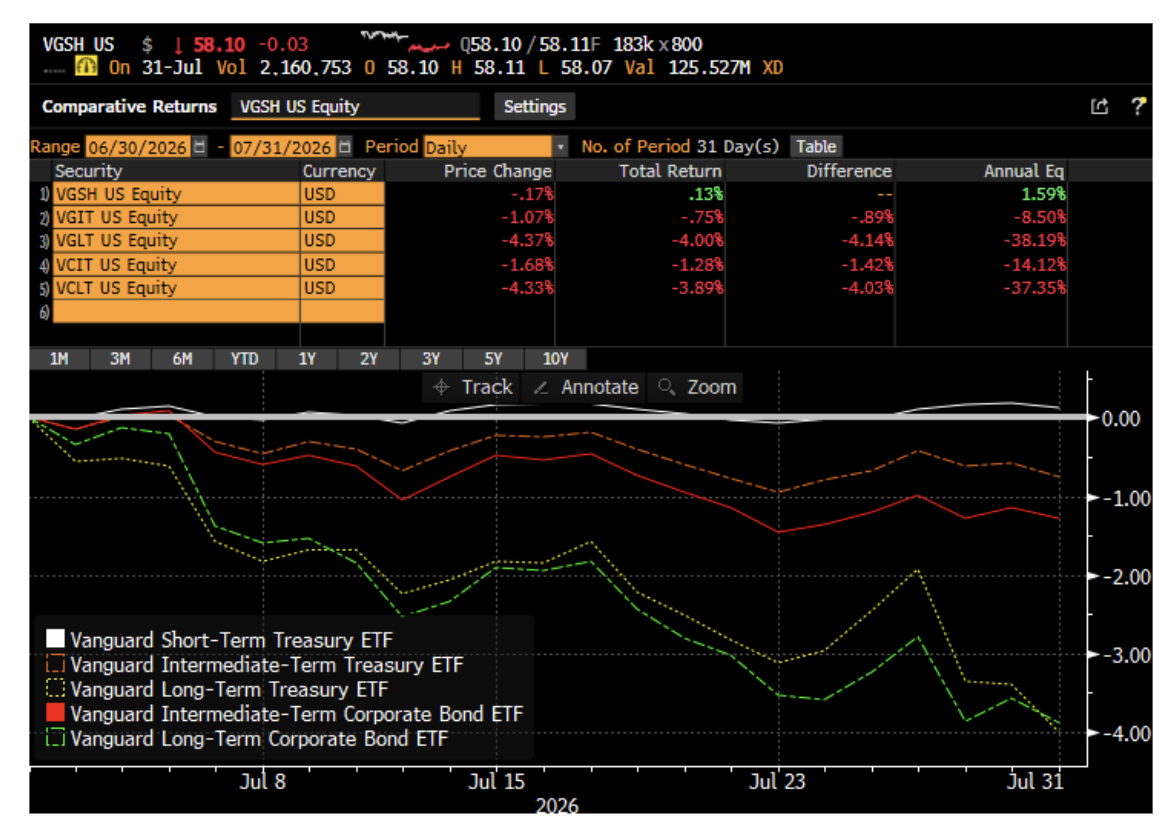
Bonds had an awful month in July as the new Warsh Federal Reserve, on the one hand, raised concerns about inflation which has run above the Fed’s 2% target for the last five years, while, on the other hand, failing to persuade investors that it had a good solution to the problem. Ten- and thirty-year bonds—both Treasury and corporate—sold off, with the longer-dated bonds down over 4%. Two-year Treasuries, however, managed to eke out a small positive return and QuantStreet’s short-duration exposure, which we maintain into August, served us well in July. On the other hand, our international exposures proved to be a drag across different portfolios, as VXUS was a laggard.
You can see QuantStreet’s performance numbers here. If you would like to see our performance relative to benchmarks, please contact us at [email protected].
See more: Where Stock Picking Still Pays: Adding Dispersion to the Rotation Graph
Looking Ahead
We remain quite bullish on the capabilities of AI and on the AI-led boom the US economy is now experiencing. (Indeed, the first few days’ price action in August suggests the market is in agreement.) However, prices have come very far, very fast. On our machine learning forecasting models, we see asset class after asset class as richly valued. For something to be richly valued on our model runs, two things need to happen. First, a valuation metric needs to have had historical forecasting power for the asset class in question. Second, the valuation metric needs to be high at the moment. This combination holds true for smallcaps, midcaps, the Nasdaq index, equal-weighted S&P 500, semiconductors, among others. In addition, the prevailing high price-to-earnings ratio for the overall market forecasts low returns on high duration assets, like longer dated Treasury and corporate bonds (elevated P/Es presumably imply high growth expectations, which are associated with higher future interest rates). This latter finding, which could of course turn out to be incorrect, points us to a lower duration exposure across all portfolios.
Two asset classes that do not fall squarely into the high-valuation bucket at the moment are value stocks (which we discussed last month) and low volatility stocks (whose expected returns are also lower than usual due to high valuations, though the effect is not as pronounced as for other stock sectors). Low volatility stocks have a special place in financial economics, thanks to the pioneering work of Fischer Black and his coauthors. Their idea was that, because many investors are leverage-constrained, they can only achieve high beta (a measure of market exposure) by buying high-beta stocks, which become artificially overpriced. On the other hand, low beta stocks, which happen to also be low volatility stocks (see Appendix), are underowned (because you can always achieve lower beta by moving partially into cash) and thus underpriced.
A hint of this effect is visible in the next chart, which shows the annualized volatility of different asset classes on the x-axis along with their average excess returns (returns above a short-term T-bill rate) on the y-axis. If you visualize a line running from US Treasuries at the bottom left of the chart to the Nasdaq index at the upper right, this line represents the efficient frontier, or the highest historical return that could have been realized at a given level of historical volatility.
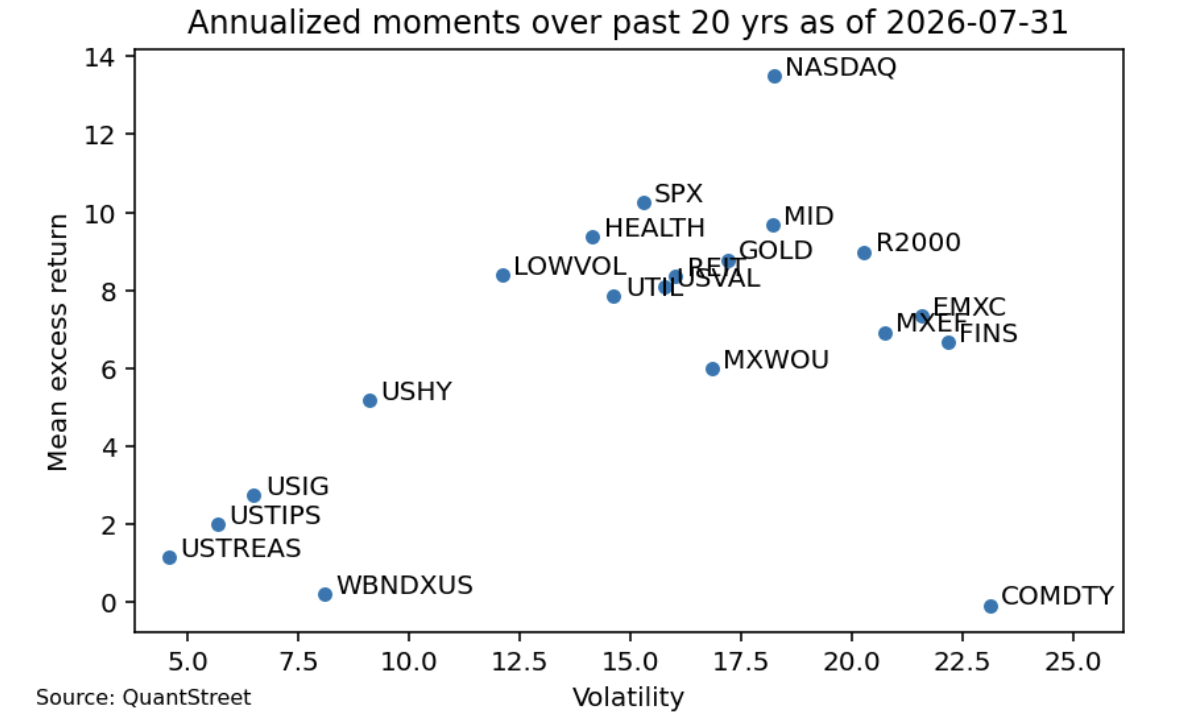
Note, also, that low volatility stocks seem to lie just slightly above this imaginary efficient frontier line. This means that they have historically earned a slightly higher return than what would have been implied given their historical realized return volatility. This slight risk-adjusted outperformance is the added kicker that Fischer Black and his coauthors originally identified back in the early ‘70s.
Practically speaking, our continuing allocation to value and low volatility stocks moves the portfolio slightly away from the AI theme, and more towards other parts of the market, which should also benefit from the AI-led productivity gains that are anticipated to occur across much of the economy (with some early evidence from the national accounts data that this productivity boost is indeed starting to take shape). Our preferred exposure to low volatility stocks comes through BlackRock’s USMV ETF. The ETF has a slightly higher expense ratio (0.15% per annum) than our usual portfolio components, but it is very liquid and still relatively low cost. The ETF’s sector exposures, taken from the BlackRock website, show a large IT allocation.
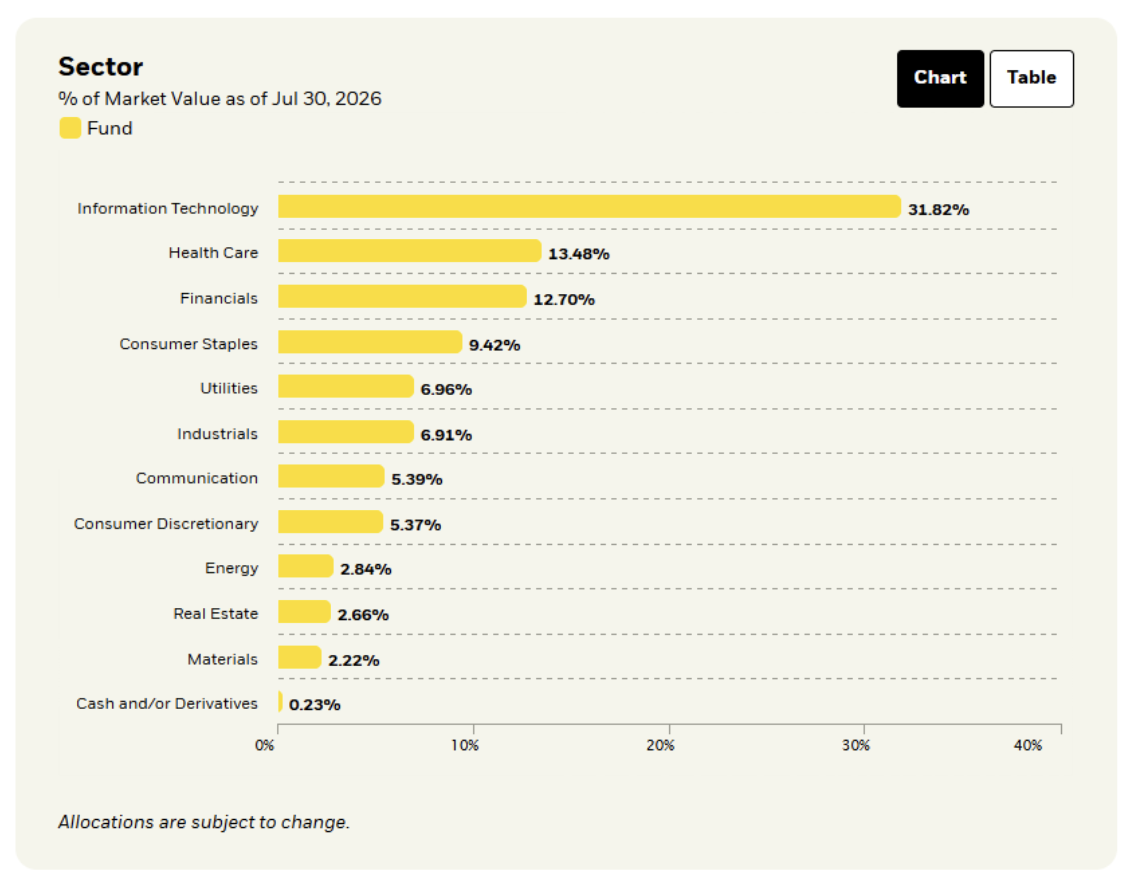
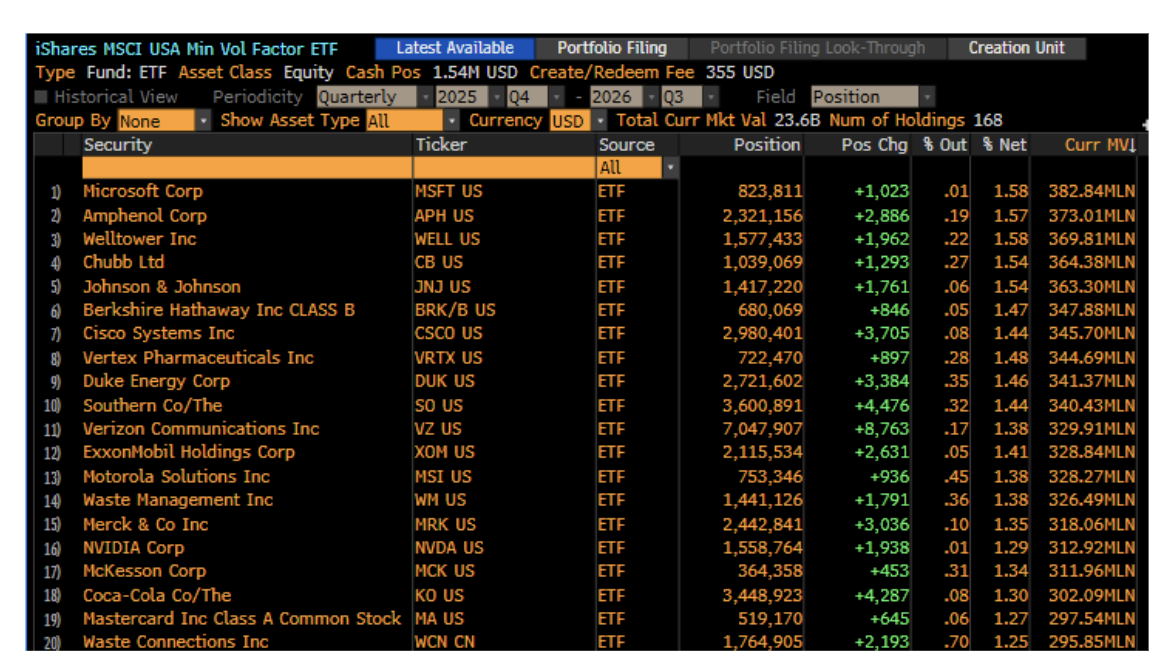
However, looking at the actual single name components of the ETF (see below), we observe two things. First, a lot of traditional-economy (not pure AI plays) companies show up among the ETF’s largest holdings. Second, there is much less single name concentration than found in the S&P 500 at the moment as the top 20 names all come in with weights in the 1.25-1.58% range.
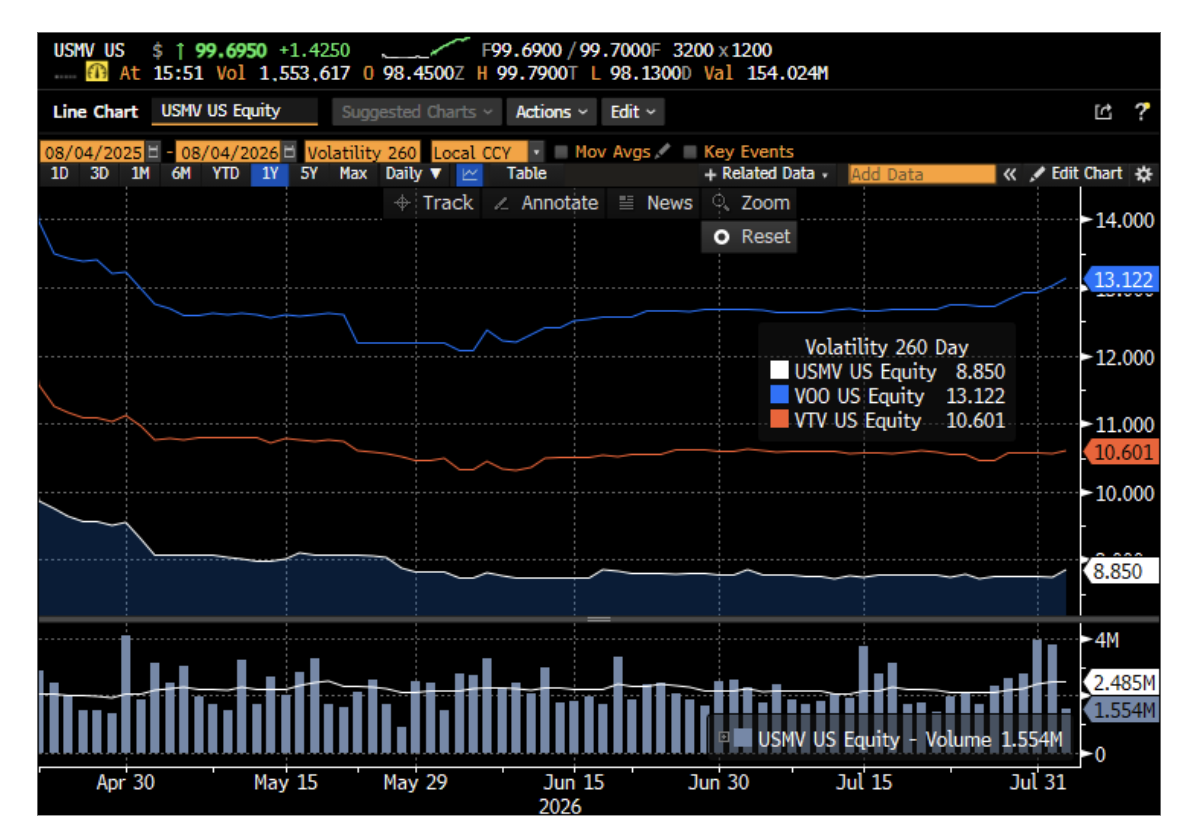
Finally, true to its name (iShares MSCI USA Min Vol Factor ETF), USMV has exhibited historical realized volatility and tail risk that are far lower than those the S&P 500 index. The next chart shows a rolling estimate of the 260-day realized volatility for the USMV (low volatility), VTV (value) and VOO (S&P 500) ETFs. As is clear, the S&P 500 index has the highest historical volatility, followed by value stocks, followed by low volatility stocks. Allocating from the S&P 500 to low volatility and value stocks thus, at the margin, decreases the risk levels of the portfolios.
Finally, this month we introduce a small commodities exposure across all our portfolio via BlackRock’s GSG ETF. This ETF, while quite liquid, has an extremely high expense ratio of 0.75%, but we are not aware of more cost-effective alternative. Roughly 50% of the ETF reflects energy prices, so this position serves as a hedge against a deterioration in the situation in the Strait of Hormuz. The underlying logic of the position is the following:
- First, our model likes the exposure based on a measure of economic policy uncertainty. When this measure is elevated, like now, the commodity space tends to do well. Though, of course, this is just a forecast and commodities may do very poorly this time around.
- Second, commodities have an almost zero correlation with just about everything else in the portfolio. Further, gold and commodities, which both sit at just under 2% in our more aggressive portfolios, have been negatively correlated of late. If this iteration of the Iran ceasefire really takes hold, then gold will do well because people will think the Fed is likely to cut rates sooner. If the Iran conflict deteriorates, then gold will do poorly while GSG will do well. In addition, our more aggressive portfolios are very stock-heavy, and likely to do well if the Iran situation improves, so commodities provide a hedge against wider portfolio deterioration. Again, this is just one possible scenario and things may play out differently in reality.
- From what I've read, a lot of the oil inventories that were in place six months ago are getting depleted. If the Strait of Hormuz stays closed for another few months, there may be a far higher oil price jump than what we had in the past.
The base case seems to be that oil prices will fall, but having a small commodities exposure in the portfolio provides a bit of a hedge against things in Iran getting worse, which, based on the very spotty track record of prior agreements, may well yet happen.
Appendix
To see that the USMV ETF does indeed load on the Black low-beta anomaly, we regressed its monthly returns on the returns of the Fama-French five factor model plus momentum plus our own version of the betting-against-beta factor (a zero-beta long-short portfolio that is long low beta stocks and short high beta stocks). As the next table shows, USMV indeed has a low market beta (of 0.70) and no factor exposures outside of the zero-beta betting-against-beta factor. This ETF thus provides exactly the exposure the low-beta anomaly calls for. Standard errors are plain vanilla OLS ones, but given the extreme t-values for the market (MktRF) and the betting-against-beta (BAB) factors, controlling for autocorrelation and heteroscedasticity is unlikely to change the results.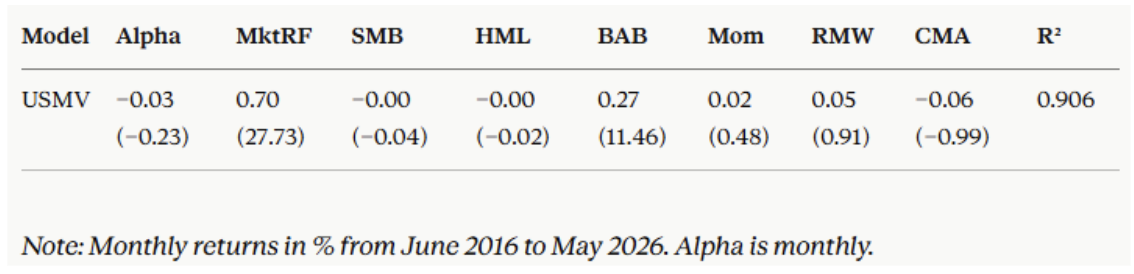
The code is implemented in R and the pretty formatting comes from Claude.
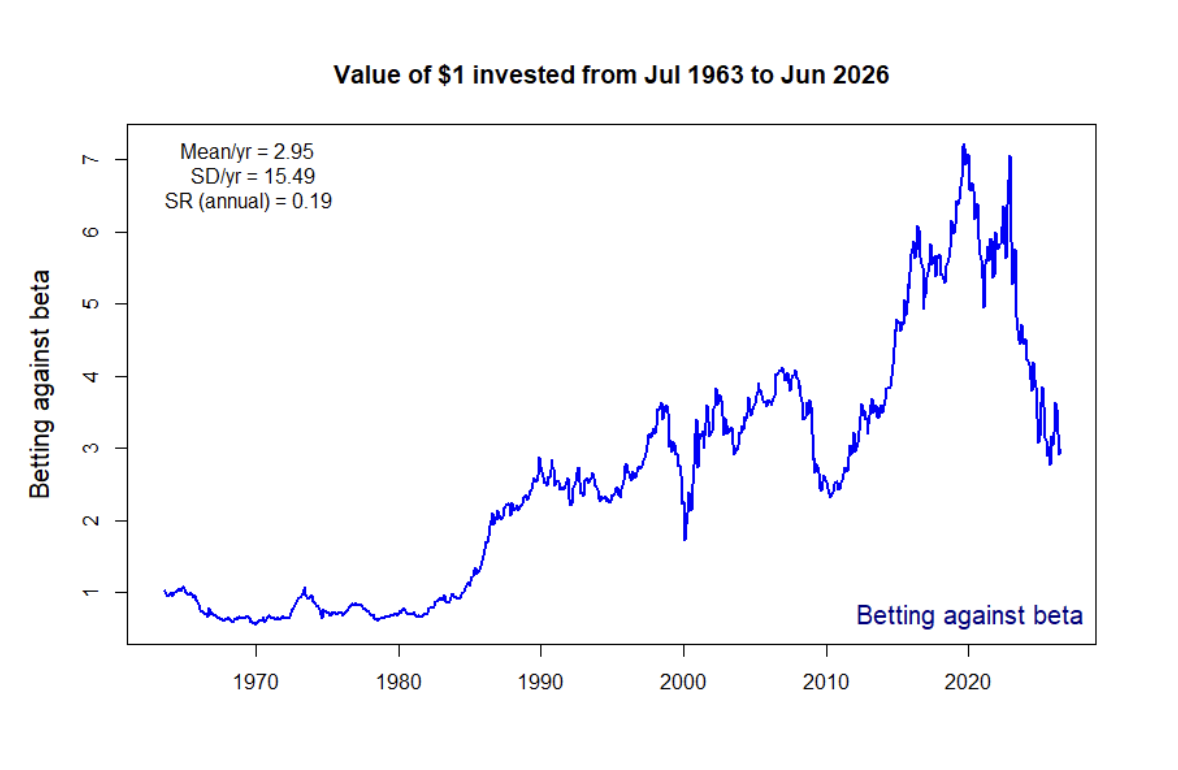
Another caveat is that, recently, low beta stocks have meaningfully underperformed their high beta counterparts on a beta-adjusted basis (see the next chart which shows the returns of the BAB factor). If this underperformance reverses in the future, it will provide a tailwind to our USMV exposure. If the underperformance continues, however, it will prove to be a drag on the position.
Working with QuantStreet
QuantStreet offers financial planning and wealth management services for individuals and families. For the advisor community, we offer model portfolios, portfolio analytics, and a platform for those looking to gain independence. The firm’s investment approach is systematic, data-driven, and shaped by years of investing experience. To work with or learn more about QuantStreet, join our mailing list or contact us at [email protected]. Also, please sign up for our Substack.
QuantStreet is a registered investment advisor. Registration does not imply a certain level of skill or training. All financial forecasts are fraught with risk and uncertainty. Our views may prove incorrect and market outcomes may be materially worse than we anticipate. Please see our full disclosure about the limitations of forward-looking statements and the risks of investing at https://quantstreetcapital.com/blog_disclosure/.
A message from Advisor Perspectives and VettaFi: Discover something new! Click here to register for our upcoming webcasts.
Membership required
Membership is now required to use this feature. To learn more:
View Membership BenefitsSponsored Content
Upcoming Virtual Events View All