Key Takeaways
-
With big tech reports out of the way, investors focus on results from industrials, health care and consumer staples and discretionary this week
-
Q2 S&P 500® profit growth currently stands at 47.4% with 61% of companies having reported
-
Potential earnings surprises this week: Alexandria Real Estate Equities, Kimberly-Clark Corp, Host Hotels & Resorts and Keurig Dr Pepper
The Winners and Losers of Big Tech’s Great AI Divide
The latest earnings reports from Big Tech have laid bare a growing divide in the market's appetite for massive AI spending. Following its report on Wednesday, Microsoft (MSFT) surged nearly 9% after delivering $90 billion in revenue and a blowout 43% growth in its Azure cloud division, reassuring Wall Street with an AI business run rate that surpassed $37 billion.1 In stark contrast, Meta (META) tumbled roughly 9% as a surge in operating costs, driven by massive AI infrastructure investments and heavy legal charges, caused free cash flow to drop 91% to $784 million, overwhelming a slight revenue beat and disappointing Q3 sales guidance.2 The divergent stock reactions underscore a shifting paradigm for the AI trade: while investors are eager to reward companies like Microsoft that demonstrate concrete, direct monetization from their capital expenditures, they are increasingly punishing firms like Meta (and GOOGL the week prior) where heavy AI spending continues to squeeze cash generation before yielding a clear, isolated return on investment.
The market had a similar split reaction to Thursday’s reports from Amazon and Apple. Amazon emerged as the definitive victor that day, surging over 8% after a 37% AWS cloud explosion convinced investors that its aggressive capital expenditure (possibly $220B in 2026!) is directly fueling top-line AI growth.3 Conversely, Apple mirrored Meta's fate as the night's underperformer; despite beating quarterly estimates, its shares slipped in late trading as investors, wary of high valuations, fixated on softer Services revenue, margin pressures from rising component costs, and light Q4 guidance rather than top-line strength.4
With those tech reports, and results from 173 other S&P 500 constituents, the blended EPS growth rate moved higher to 47.4% last week, from 37.9% the week prior. Revenue growth also saw a bump to 14.1% from 13.2% in the week prior.5
See more: AI and Alpha: Why Technology Alone Won’t Be Enough
The Macro Picture: Stagflation Fears, Fed Dissents, and a Cooling Economy
The macroeconomic backdrop grew significantly more complex last week as the Federal Reserve opted to hold its benchmark interest rate steady at 3.50%–3.75%. The pause sparked an immediate debate on Wall Street over whether the central bank is falling behind the curve on inflation, particularly after a rare 9–3 FOMC vote highlighted three hawkish dissents pushing for an immediate rate increase.6 While policymakers chose to pause following a softer June inflation print, persistent price pressures have left market participants questioning whether the Fed is exercising prudent patience or risking a costly policy delay.
That delicate balance was thrown into further confusion on Thursday with the release of second-quarter U.S. GDP data. The Bureau of Economic Analysis reported that real GDP slowed to an annualized pace of 1.5% in Q2, down from 2.1% in Q1 and missing Wall Street’s 2.0% estimate, as a surge in imports and reduced government spending weighed on the headline figure. Yet beneath the cooling surface, private domestic demand surged 3.9%, driven by resilient consumer spending, while headline PCE inflation accelerated to 5.1%.7 The combination of a slowing top-line economy alongside sticky underlying demand and elevated broad price measures paints a challenging stagflationary backdrop for monetary authorities.
For equity markets, these mixed macro signals leave little margin for error. Investors are now caught between a slowing growth trajectory and a Federal Reserve that may be forced to keep financial conditions restrictive for longer than expected to fully tame inflation. All attention now pivots to next week’s U.S. labor market report on Friday (August 7), which will offer crucial clues on employment health and signal whether the Fed can maintain its current pause or will be forced to tighten policy further at its upcoming September FOMC meeting.
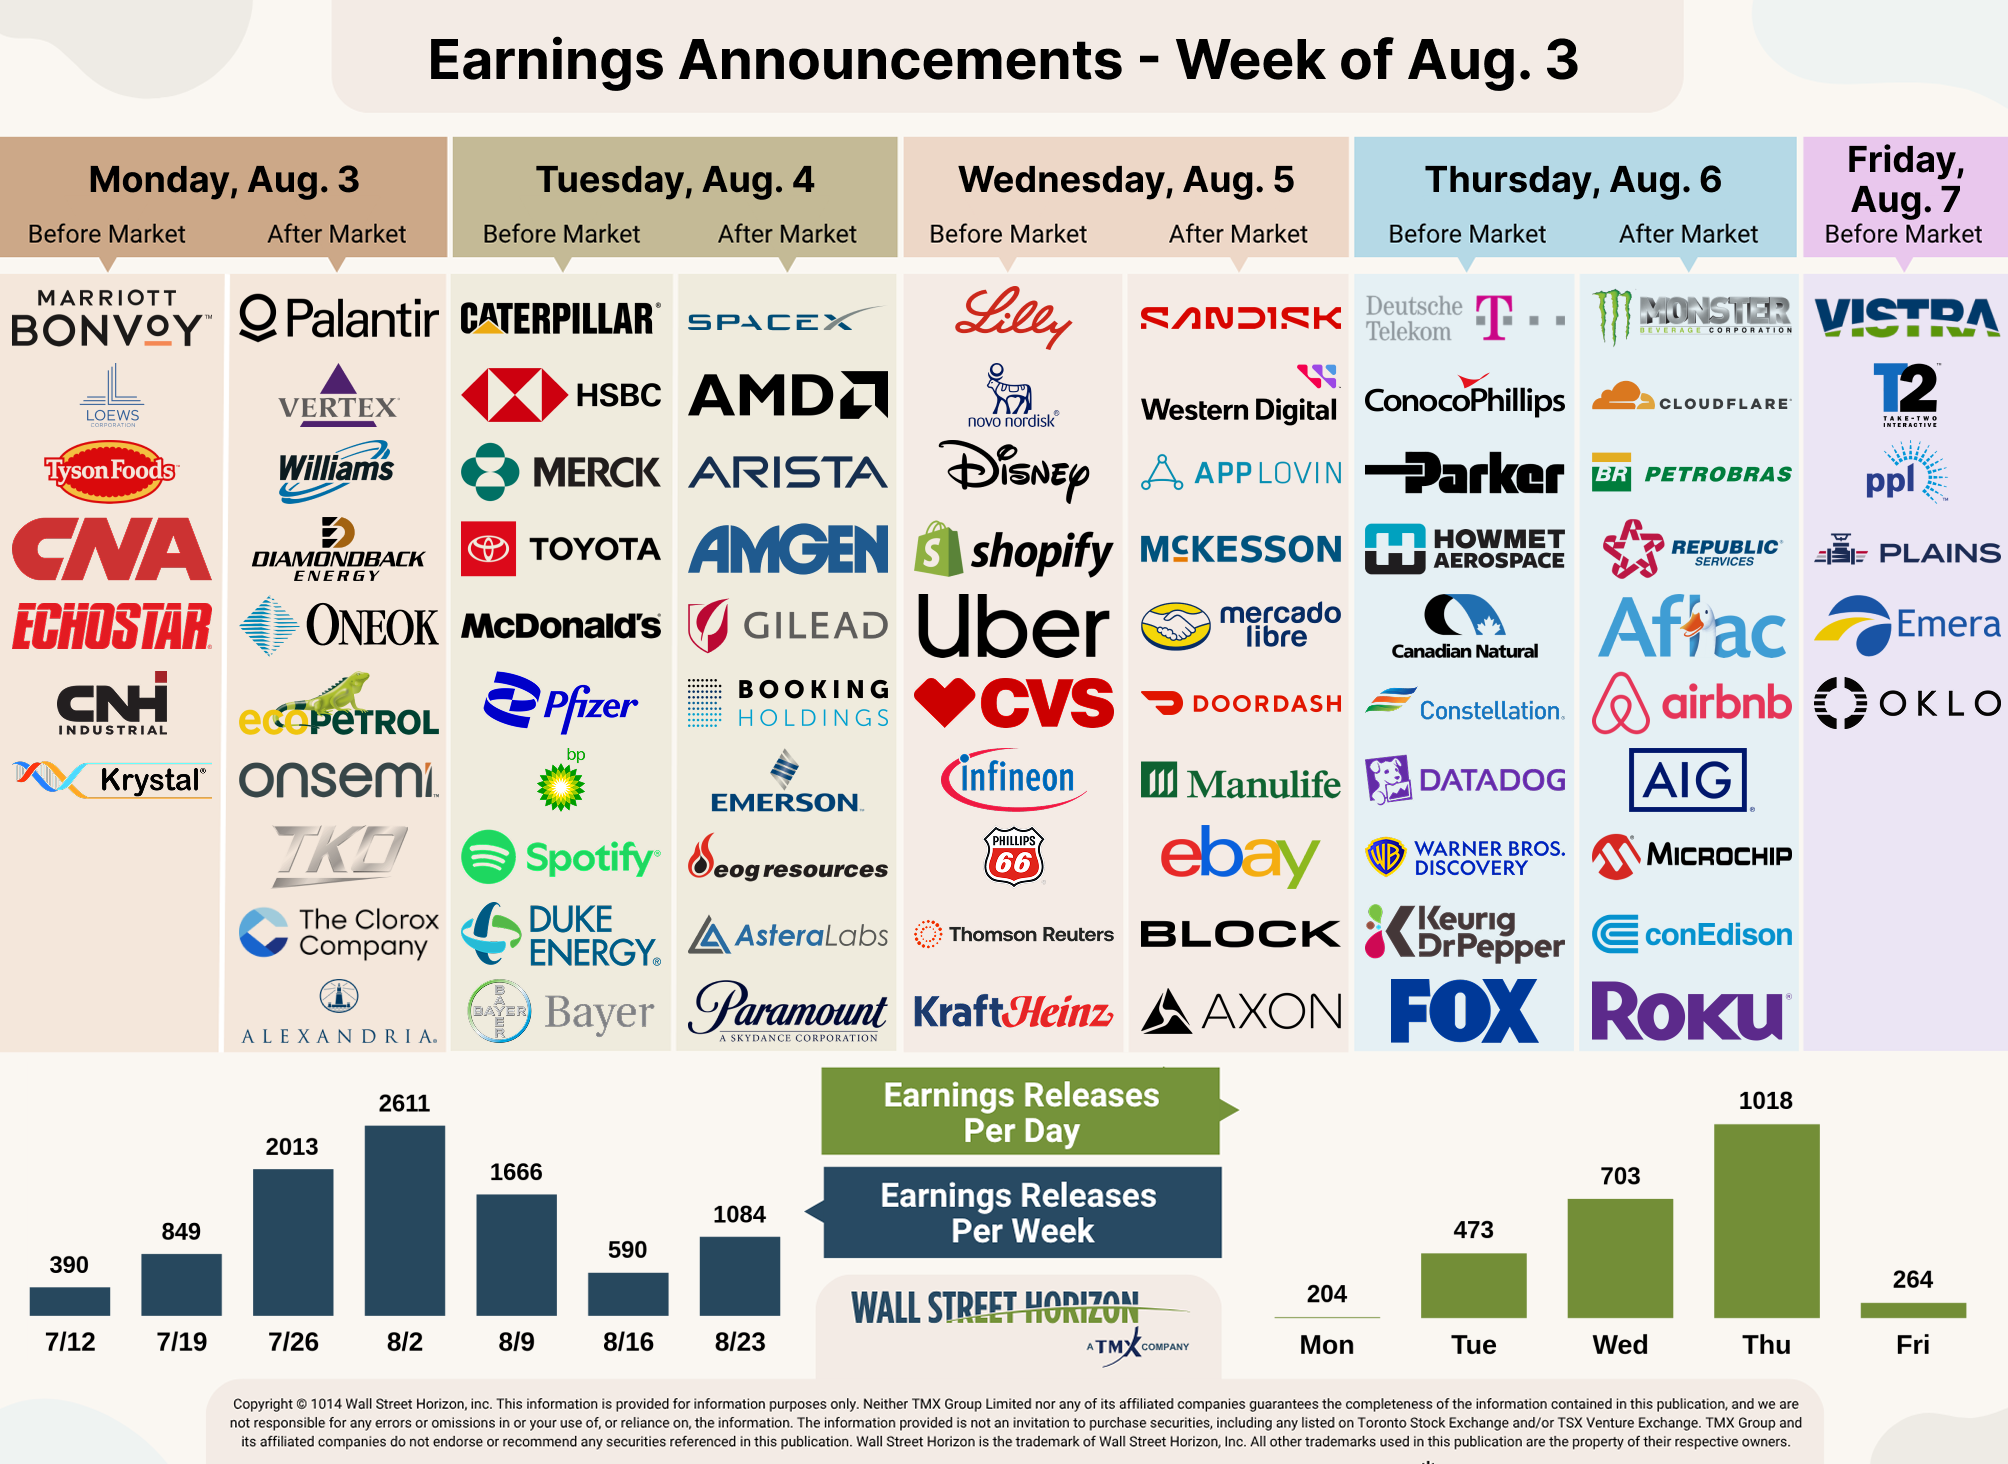
Earnings On Deck: PLTR, VRTX, TSN, SPCX
As the earnings calendar shifts away from Mega-Cap tech, market attention pivots toward major sector leaders in software, healthcare, and consumer staples. Highlighted by software heavyweight Palantir Technologies (PLTR) reporting today after market close, investors will be watching for continued enterprise AI adoption, alongside major healthcare reports from Vertex Pharmaceuticals (VRTX) and consumer staple giant Tyson Foods (TSN). This next wave of quarterly results will offer a crucial temperature check on both enterprise technology spending and discretionary consumer health across broader market sectors.
Furthermore, Tuesday's post-market session will be marked by SpaceX’s (SPCX) highly anticipated first earnings report as a newly public entity, with investors eager to see how the aerospace leader's financial performance aligns with its ambitious growth trajectory.
Source: Wall Street Horizon
Outlier Earnings Dates This Week
Academic research shows that when a company confirms a quarterly earnings date that is later than when they have historically reported, it’s typically a sign that the company will share bad news on their upcoming call, while moving a release date earlier suggests the opposite.8
This week we get results from four S&P 500 companies that have pushed their Q2 2026 earnings dates outside of their historical norms. All of those companies, Alexandria Real Estate Equities (ARE), Kimberly-Clark Corp (KMB), Host Hotels & Resorts (HOST) and Keurig Dr Pepper (KDP), are reporting later than usual and therefore have negative DateBreaks Factors*.
* Wall Street Horizon DateBreaks Factor: statistical measurement of how an earnings date (confirmed or revised) compares to the reporting company's 5-year trend for the same quarter. Negative means the earnings date is confirmed to be later than historical average while Positive is earlier.
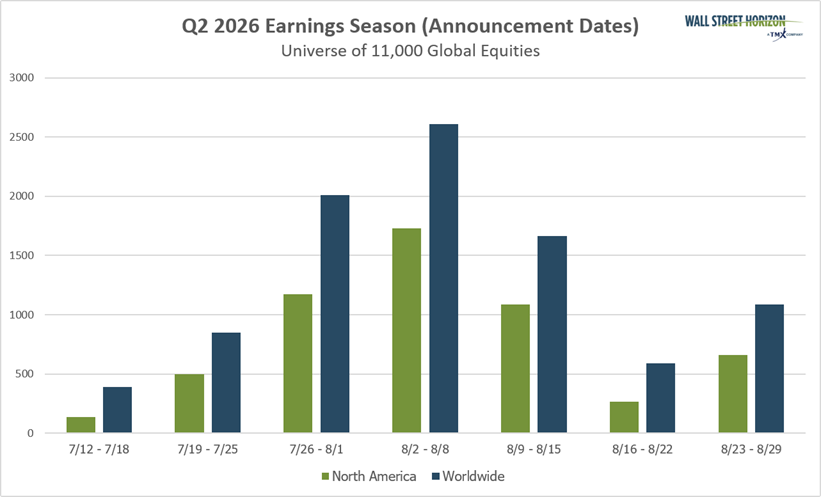
Q2 2026 Earnings Wave
This marks the second peak week of the Q2 earnings season which started July 27 and runs through August 14, with over 1,500 reports scheduled for each week. Currently, August 6 is predicted to be the most active day with 1,018 companies anticipated to report. Thus far, 78% of companies have confirmed their earnings date and 31% have reported (out of our universe of 11,000+ global names). The remaining dates are estimated based on historical reporting data.
Source: Wall Street Horizon
1 Microsoft Second Quarter 2026 Earnings Results, July 29, 2026, https://www.microsoft.com
2 Meta Second Quarter 2026 Earnings Results, July 29, 2026, https://s21.q4cdn.com/
3 Amazon Second Quarter 2026 Earnings Results, July 29, 2026, https://s2.q4cdn.com
4 Apple Third Quarter 2026 Earnings Results, July 29, 2026, https://www.apple.com
5 FactSet Earnings Insight, John Butters, July 31, 2026, https://advantage.factset.com
6 Federal Reserve issues FOMC statement, July 29, 2026, https://www.federalreserve.gov
7 Federal Reserve issues FOMC statement, July 29, 2026, https://www.federalreserve.gov
8 Time Will Tell: Information in the Timing of Scheduled Earnings News, Journal of Financial and Quantitative Analysis, Eric C. So, Travis L. Johnson, Dec, 2018, https://papers.ssrn.com
Copyright © 2026 Wall Street Horizon, Inc. All rights reserved. Do not copy, distribute, sell or modify this document without Wall Street Horizon's prior written consent. This information is provided for information purposes only. Neither TMX Group Limited nor any of its affiliated companies guarantees the completeness of the information contained in this publication, and we are not responsible for any errors or omissions in or your use of, or reliance on, the information. This publication is not intended to provide legal, accounting, tax, investment, financial or other advice and should not be relied upon for such advice. The information provided is not an invitation to purchase securities, including any listed on Toronto Stock Exchange and/or TSX Venture Exchange. TMX Group and its affiliated companies do not endorse or recommend any securities referenced in this publication. This publication shall not constitute an offer to sell or the solicitation of an offer to buy, nor may there be any sale of any securities in any state or jurisdiction in which such offer, solicitation or sale would be unlawful prior to registration or qualification under the securities laws of any such state or jurisdiction. TMX, the TMX design, TMX Group, Toronto Stock Exchange, TSX, and TSX Venture Exchange are the trademarks of TSX Inc. and are used under license. Wall Street Horizon is the trademark of Wall Street Horizon, Inc. All other trademarks used in this publication are the property of their respective owners.
A message from Advisor Perspectives and VettaFi: Discover something new! Click here to register for our upcoming webcasts.
© Wall Street Horizon
More Global Markets Topics >