Guided by Fundamentals: Navigating Emerging Markets with Value
Membership required
Membership is now required to use this feature. To learn more:
View Membership BenefitsKey Points
-
As globalization gives way to reshoring and resurgent resource nationalism, emerging markets may offer fresh alpha opportunities through their ability to supply the raw materials required to fuel the AI boom.
-
Despite the decade-long dominance of U.S. equities and the Magnificent Seven, in particular, emerging market stocks have outperformed them on a one-year trailing basis and may be poised to continue that trend in the months and years ahead.
-
An allocation from U.S. to emerging market stocks can improve outcomes during energy shocks, with the cumulative EM-to-U.S. spread increasing from –1% two months before the event to roughly 3% during the month of the shock and may persist for up to six months afterward.
-
Exposure to emerging markets can be optimized by seeking out inexpensive stocks and applying Quality and Momentum screens alone or in combination. Such an approach has historically generated greater outperformance and less volatility relative to unscreened alternatives.
Que Nguyen is the corresponding author.
“In the business world, unfortunately, the rear-view mirror is always clearer than the windshield.” – Warren Buffett, 1991 Berkshire Hathaway Shareholder Letter
Emerging markets offer important exposure to economic growth through rapid industrialization, natural resource endowments, and strong demographic dynamics. However, the most developed market of all, the United States, has outpaced them. In the past decade, U.S. exceptionalism, supported by soaring technology stocks and the artificial intelligence (AI) theme, has become a dominant investing narrative.
Read more: Falling Yields Reinforce Equity Market Resilience
Yet, as the world pivots from the era of globalization and unimpeded trade to one defined by resource nationalism and national security, emerging markets may become, once again, a very attractive field in which to deploy capital. While developed markets can reshore factories, they cannot create the raw materials required to power the AI revolution and secure their energy grids. This grants resource-rich emerging markets significant strategic leverage.
In his rearview mirror versus the windshield analogy, Warren Buffett referred to investors’ inability to foresee the Media sector’s deteriorating profitability in the early 1990s. Our analysis indicates today’s investors might be similarly myopic, admiring the Magnificent Seven’s past dominance in the rearview mirror and extrapolating it into the future in a “business as usual” scenario that misses the potential in emerging markets.
Looking in the Rearview Mirror
Exhibit 1 shows the total return of a U.S.-exposed exchange-traded fund (SPY) and an emerging markets-exposed counterpart (EEM) since 2016.
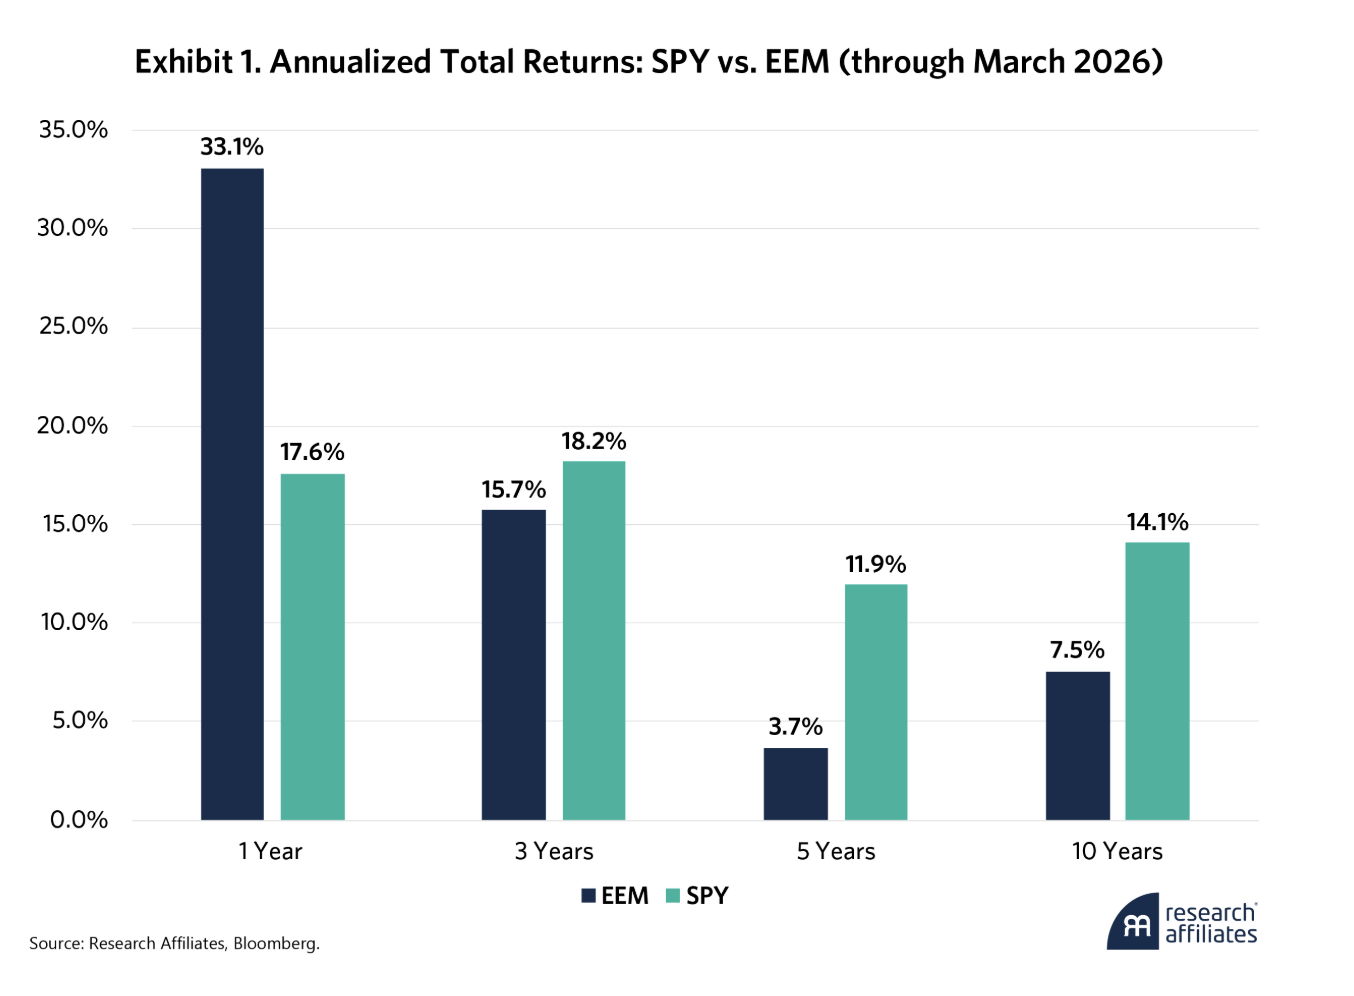
Driven by the Magnificent Seven and the associated AI boom, the U.S. ETF has outperformed its EM peer by roughly 6.5% annualized in the last 10 years and by an astonishing 8.3% over the last five. Yet EEM has been catching up on a three-year trailing basis, thanks mostly to a spectacular run over the past year. That streak generated 15.5% in annualized excess return with similar annualized volatility – around 18% for both EEM and SPY based on daily returns. The question then becomes: Is it too late for investors to access the EM opportunity?
From a valuation perspective, emerging markets may still have plenty left in the tank. Exhibit 2 shows the time series and the historical distribution of the composite relative valuation ratio1 discount of EEM versus SPY.
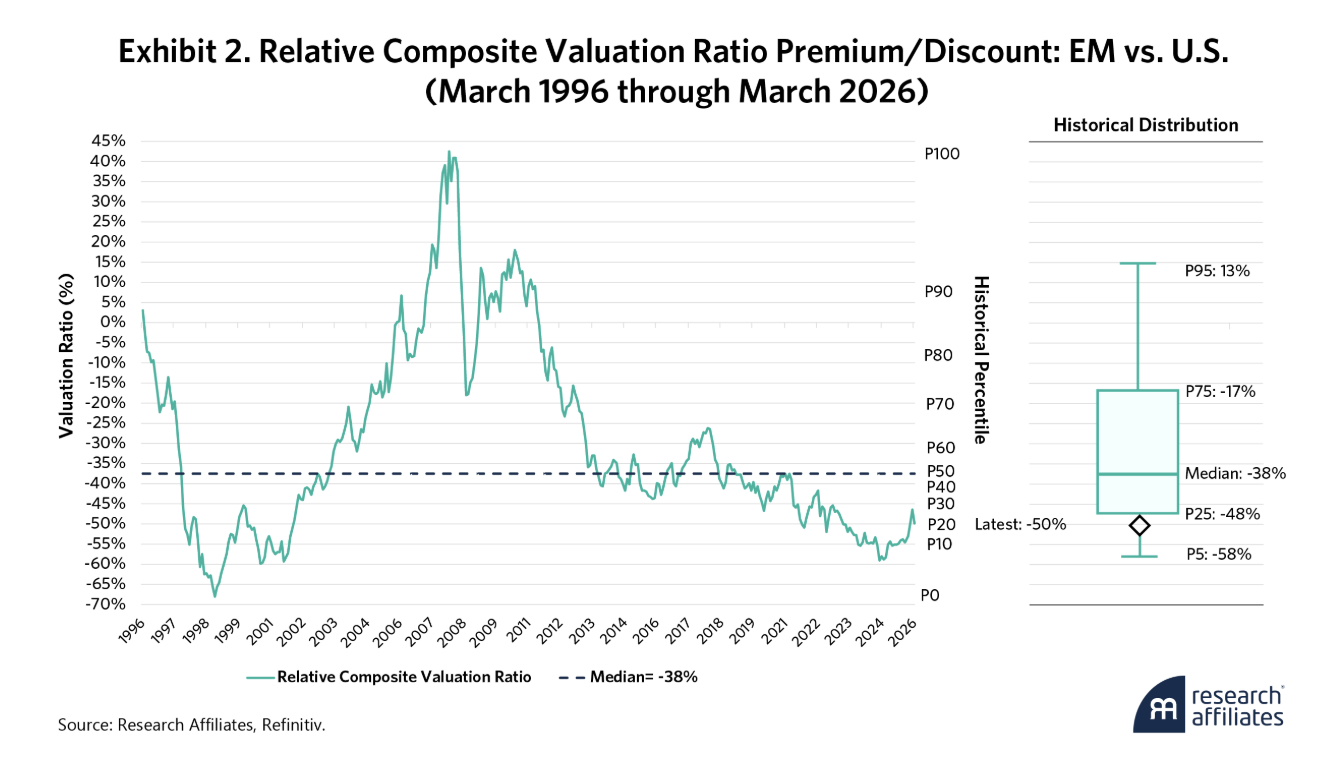
Through March 2026, the EM valuation discount stands at 50%, well above the 38% median and in the 22% percentile of observations since March 1996. Before the latest run-up, at year-end 2024, the discount was 58%, in the 6% percentile. The 6%-to-22% shift is significant but remains depressed by historical standards.
Peering through the Windshield
The recent Iran conflict and broader tensions in the Middle East underscore a critical reality: Energy security is a geopolitical imperative, not just a theoretical concern. While the U.S. is a major producer, the turn toward resource nationalism places emerging markets, with their wealth of commodities, in an enviable position.
The recent Iran conflict and broader tensions in the Middle East underscore a critical reality: Energy security is a geopolitical imperative, not just a theoretical concern.
This transition does not necessitate a dollar collapse, but it does create a fragmented supply regime in which EM currencies may offer diversification. By providing the physical layer – from copper to uranium – at a significant valuation discount, emerging markets might be indispensable partners to a global economy hungry for supply security.
We believe this also dictates the future of AI. While the AI narrative is often framed through the lens of software and models, the primary bottlenecks remain grounded in the physical world of electricity grids, fabrication capacity, and supplies of copper, natural gas, uranium, etc. As AI moves from the realm of speculation to deployment-heavy implementation, the market’s focus will likely turn from computer code and processing chips to the energy and materials that facilitate their production.
As AI moves from the realm of speculation to deployment-heavy implementation, the market’s focus will likely turn from computer code and processing chips to the energy and materials that facilitate their production.
Exhibit 3 shows simulated U.S. and EM market cap-weighted portfolios composed of the top 86% of companies by market cap. The average all-time sector exposures indicate that the EM portfolio sits closer to AI’s physical layer than its U.S. counterpart.
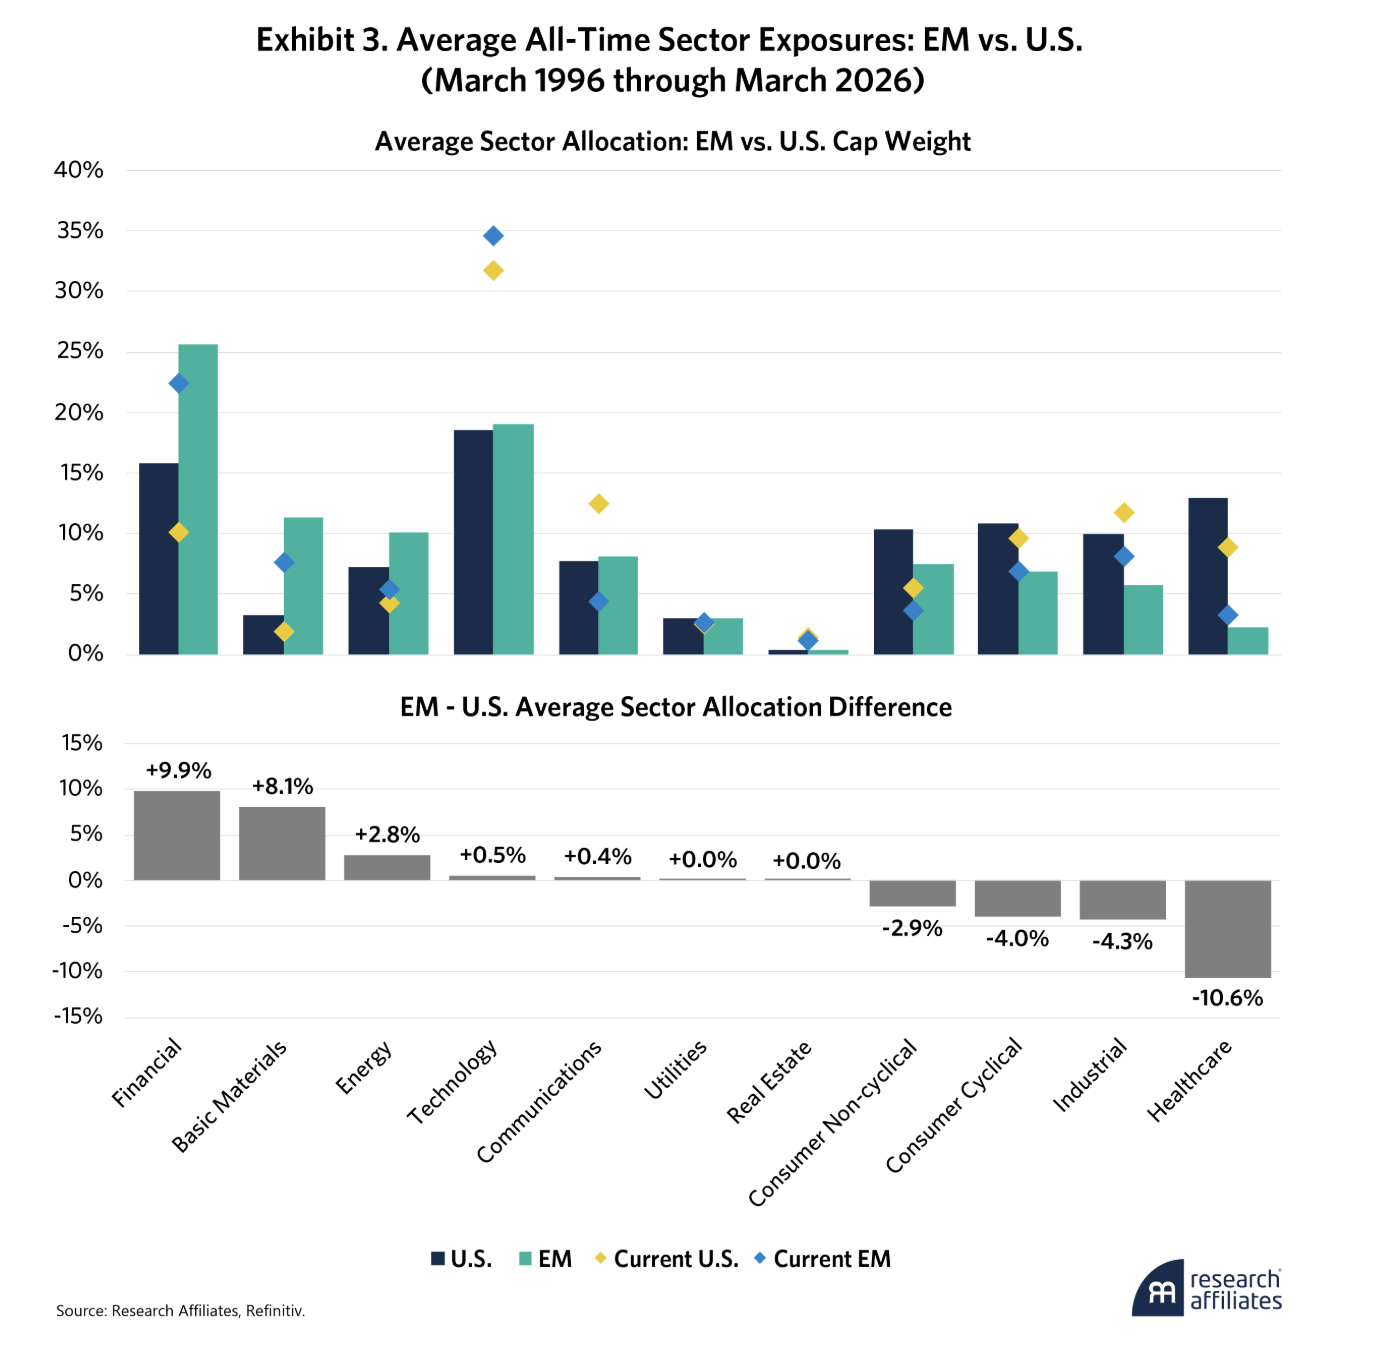
The three largest long-run sector overweights are Financials (+9.9%), Basic Materials (+8.1%), and Energy (+2.8%). All have exposure to industries directly involved in the AI infrastructure build-out. On the other hand, Healthcare (–10.6%), Industrial (–4.3%), Consumer Cyclical (–4.0%), and Consumer Non-cyclical
(–2.9%) are all underweight.
Moreover, investing in emerging markets does not necessarily sacrifice Technology exposure. On average, emerging markets have a 0.5% overweight compared to the U.S. The latest exposure to Technology rose for both markets, with the EM overweight increasing to 2.8% relative to the U.S., only reinforces this.
Exhibit 4 shows the top five Technology companies as of March 31, 2026. Emerging markets have a stronger hardware base than the U.S.
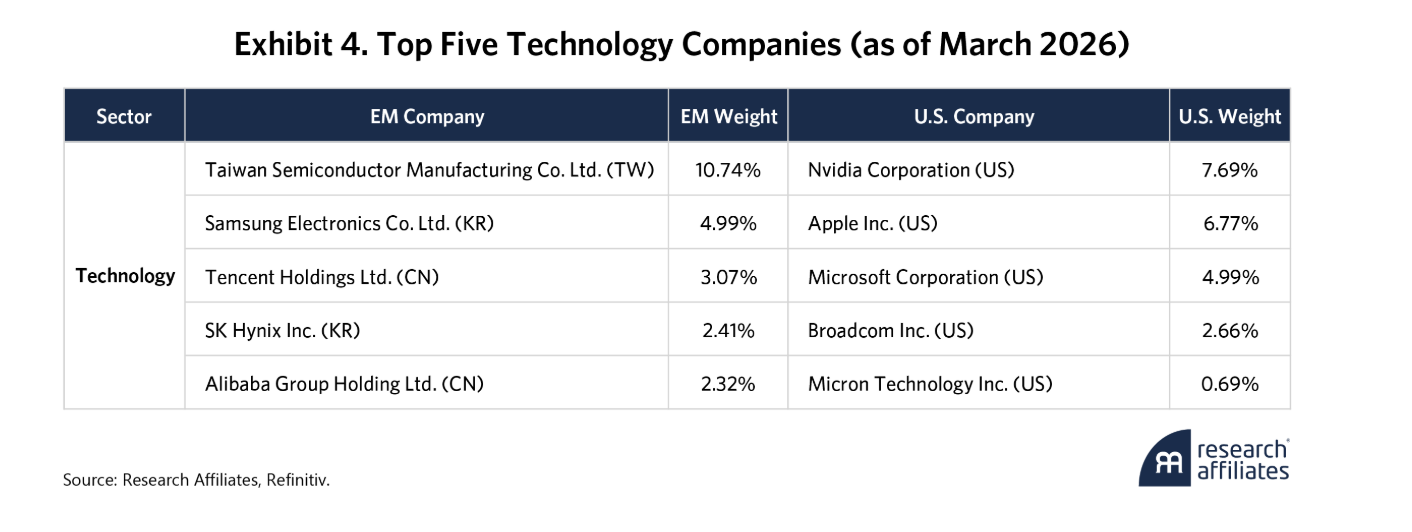
The table helps explain why EM and U.S. performance can diverge even within the same sector. U.S. Technology is tilted toward software ecosystems, AI compute leadership, and digital platforms, while EM Technology has more exposure to manufacturing, memory, foundry capacity, and handset-related ecosystems. In practical terms, the U.S. tech sleeve relies more on end-demand and platform monetization, while EM tech is more tied to the semiconductor production stack and hardware cycle.
In the AI age, energy security is critical and as the situation in Iran shows, exposure to energy shocks becomes a way to hedge portfolios. To measure how much an allocation to emerging markets from U.S. markets improves outcomes when energy shocks occur, we evaluate the cumulative EM-to-U.S. total return spread within a one-year event time window, from six months before to six months after an energy shock.2 Exhibit 5 shows the Bloomberg Commodity Energy Subindex during energy shocks. Exhibit 6 presents the cumulative growth of the EM-to-U.S. spread during that pre- and post- shock period.
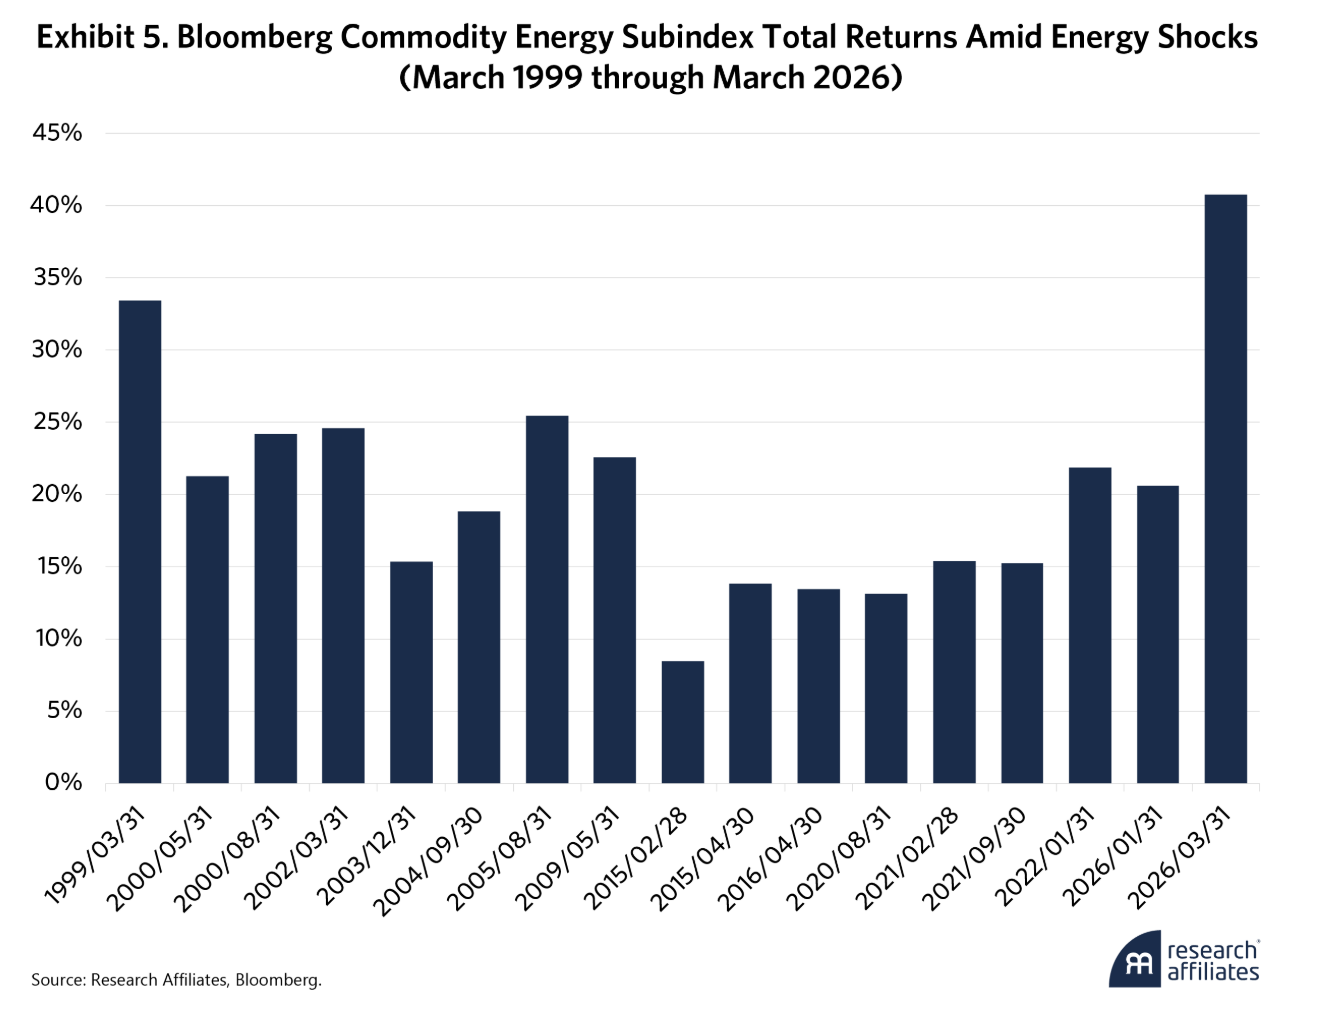
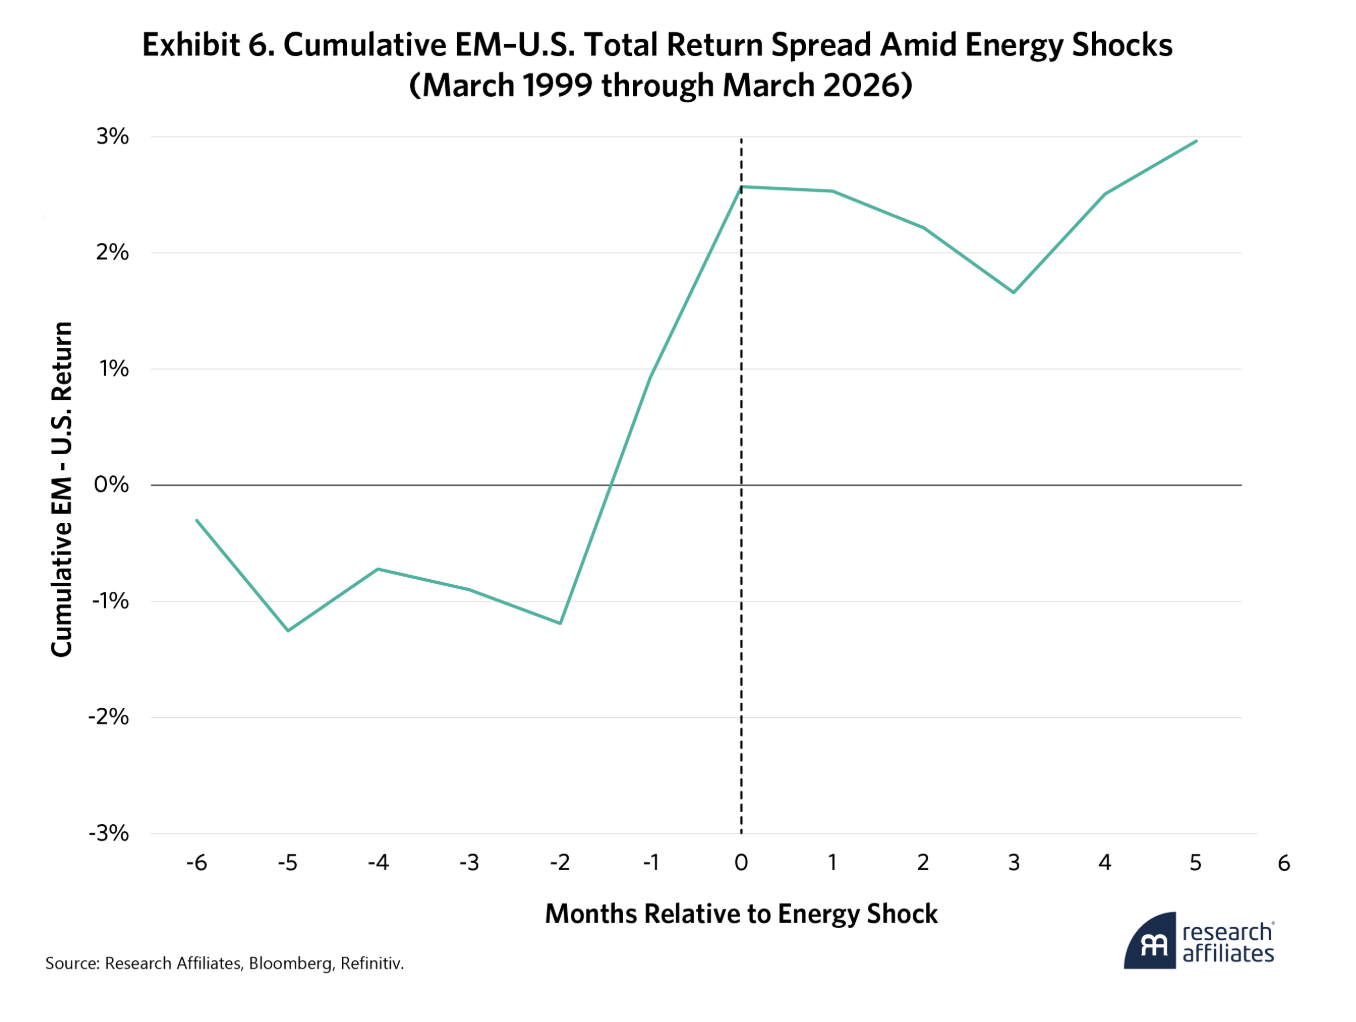
On average, the cumulative EM-to-U.S. spread increases from –1.2% two months before the event to around 2.6% the month of the shock. This means that the move may be partly anticipatory. The plot also suggests the spread persists for up to six months post-shock. The spread itself is significant, increasing by around 3.8% in two months.
To evaluate the spread’s behavior, we regress it against Energy’s total returns and allow the relationship to change in energy shock months through an interaction term.
In this equation, EM - U.S. is the monthly excess return of emerging markets relative to the U.S.; Energy is the monthly energy-index return; and Crisis is an indicator for energy-shock months. In this specification, b captures the sensitivity of the EM-to-U.S. spread to energy moves in normal periods, while d captures how much that sensitivity changes in shock periods. The coefficient c enables a separate level shift in the EM-to-U.S. spread during crisis months, independent of the size of the energy move itself.
This interaction structure distinguishes between two different questions: Do emerging markets outperform the U.S. when energy rises in general? Does that relative sensitivity strengthen when energy moves are unusually large?
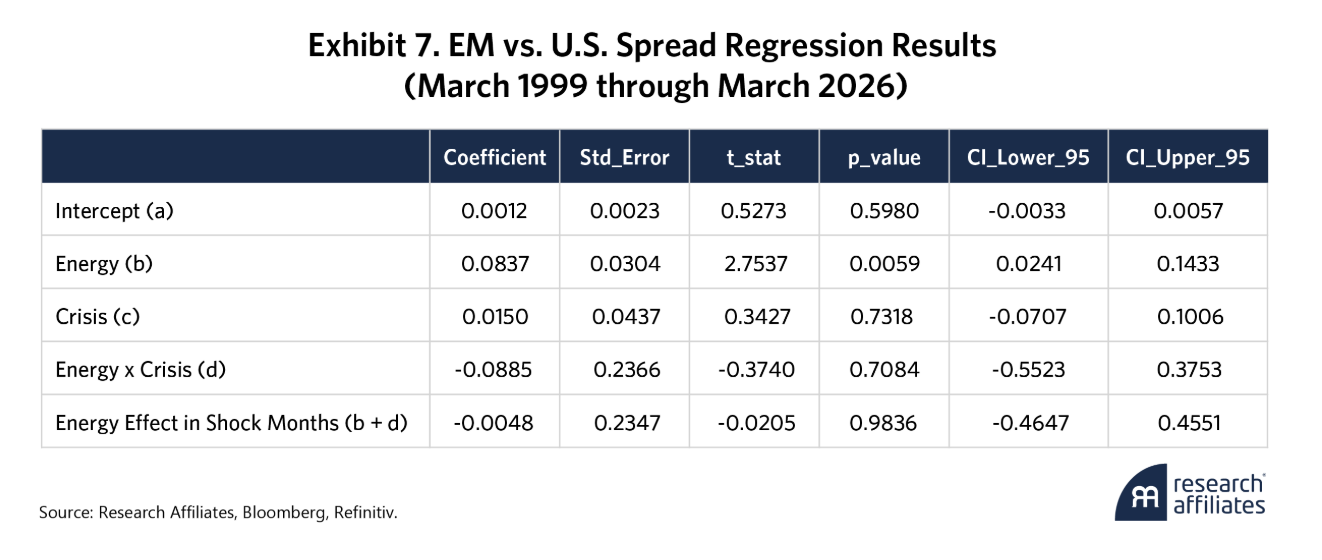
Exhibit 7 shows that emerging markets systematically behave as a stronger energy trade than the U.S. in normal months: The b coefficient is positive and significant at the 99% level. However, the incorporation of extreme crisis tail-events, such as the acute energy shock of March 2026, introduces an important regime-shift dynamic. During that specific month, while global energy benchmarks surged by 40.8% due to intense Middle Eastern supply disruptions, the EM/U.S. equity spread collapsed by -8.2%. This single data point is enough to turn a statistically significant (95% level) Energy effect in shock month coefficient (b + d) of 0.3521 to -0.0048. This shows that while EM captures positive energy beta, during a systemic geopolitical shock, the raw beta exposure is temporarily overwhelmed by global risk-off contagion and a safe-haven flight to the U.S. financial ecosystem. While the N underlying the crisis months is a low 17, this is by definition and represents about 5% of the full sample.
The current context favors exposure to emerging markets compared to the U.S. from both a valuation and an AI and resource perspective. However, to safely capture the long-term energy and structural advantages of the EM region, investors cannot rely on blind beta. They may want to incorporate two effective portfolio construction methods: focusing on cheap stocks and avoiding low Quality and low Momentum.
They may want to incorporate two effective portfolio construction methods: focusing on cheap stocks and avoiding low Quality and low Momentum.
Recalibrating the GPS: Fundamentals as the Strategic Beacon
When looking ahead, however uncertain the future may be, valuation is an important metric for setting return expectations. You know the price you pay at the point of entry. The lower it is, the larger the safety margin and the greater the potential future return when you exit. To this end, we divided the EM universe into valuation quintiles using a simple book-to-price ratio and measured the performance within each quintile portfolio. Exhibit 8 shows the results from March 1996 through March 2026.
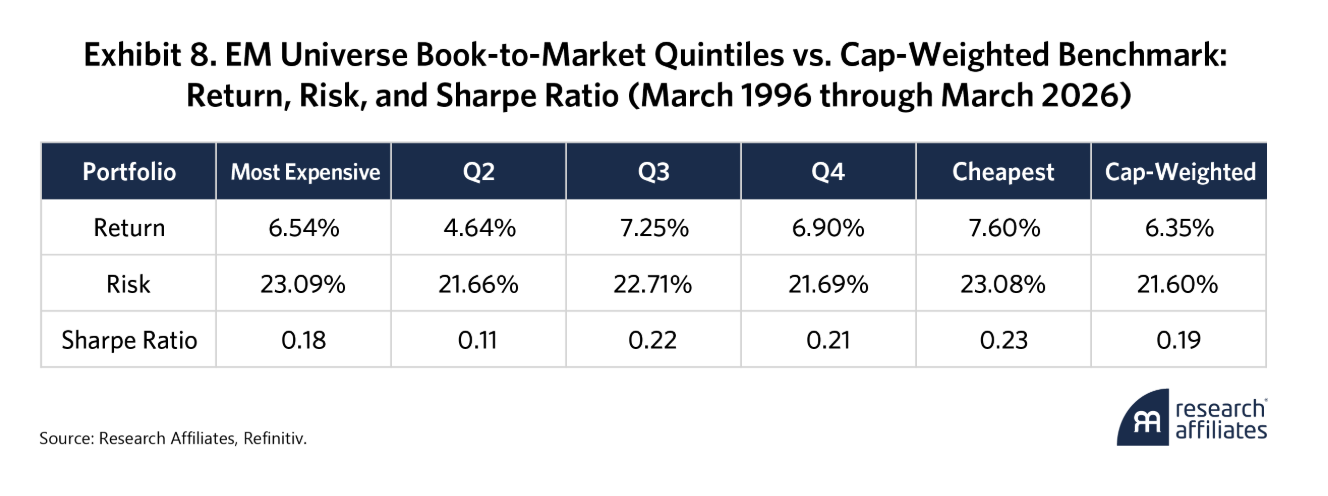
Though the relationship is not monotonic, the elevated performance of the three cheapest quintiles versus the market cap-weighted portfolio stands out. The enhanced returns and stable risk the cheapest stocks provide, result in slightly higher Sharpe ratios for Q3, Q4, and Q5 than the benchmark.
Notably, the cheapest quintile returns the most at 7.6%, with only a slightly higher level of risk that does not materially differ from that of the benchmark. The deep value portfolio, Q5, is heavily tilted toward Financials, Energy, Basic Materials, and Utilities. Its holdings include Saudi Aramco, ICBC, and Eletrobras, businesses from capital-intensive, state-influenced, regulated, commodity-linked, financially levered, or low-growth sectors that the market structurally discounts.
The Q2 portfolio, on the other hand, significantly underperforms all other quintiles and the market cap-weighted benchmark by 1.7%. Q2 sits in the worst part of the distribution: It is neither cheap enough to benefit from value mean reversion nor expensive enough to contain the highest-quality growth franchises that dominate Q1.
In valuation terms, Q1 tends to own stocks that are expensive for a reason: They have stronger franchises, resilient balance sheets, more durable growth, and are often dominant tech names like TSMC, Alibaba, and Tencent.
Q2 may be the bucket where valuation starts to become cheaper, but business quality and balance-sheet resilience have already deteriorated. So, it is vulnerable in selloffs and lacks the franchise strength that leads Q1 to outperform in growth-led regimes. In other words, Q2 companies like Itaú, China Mobile, and National Bank of Greece are not always cheap enough to be attractive or good enough to stay expensive.
Exhibit 9 shows each quintile’s average sector exposures, with diamond markers for the most recent date.
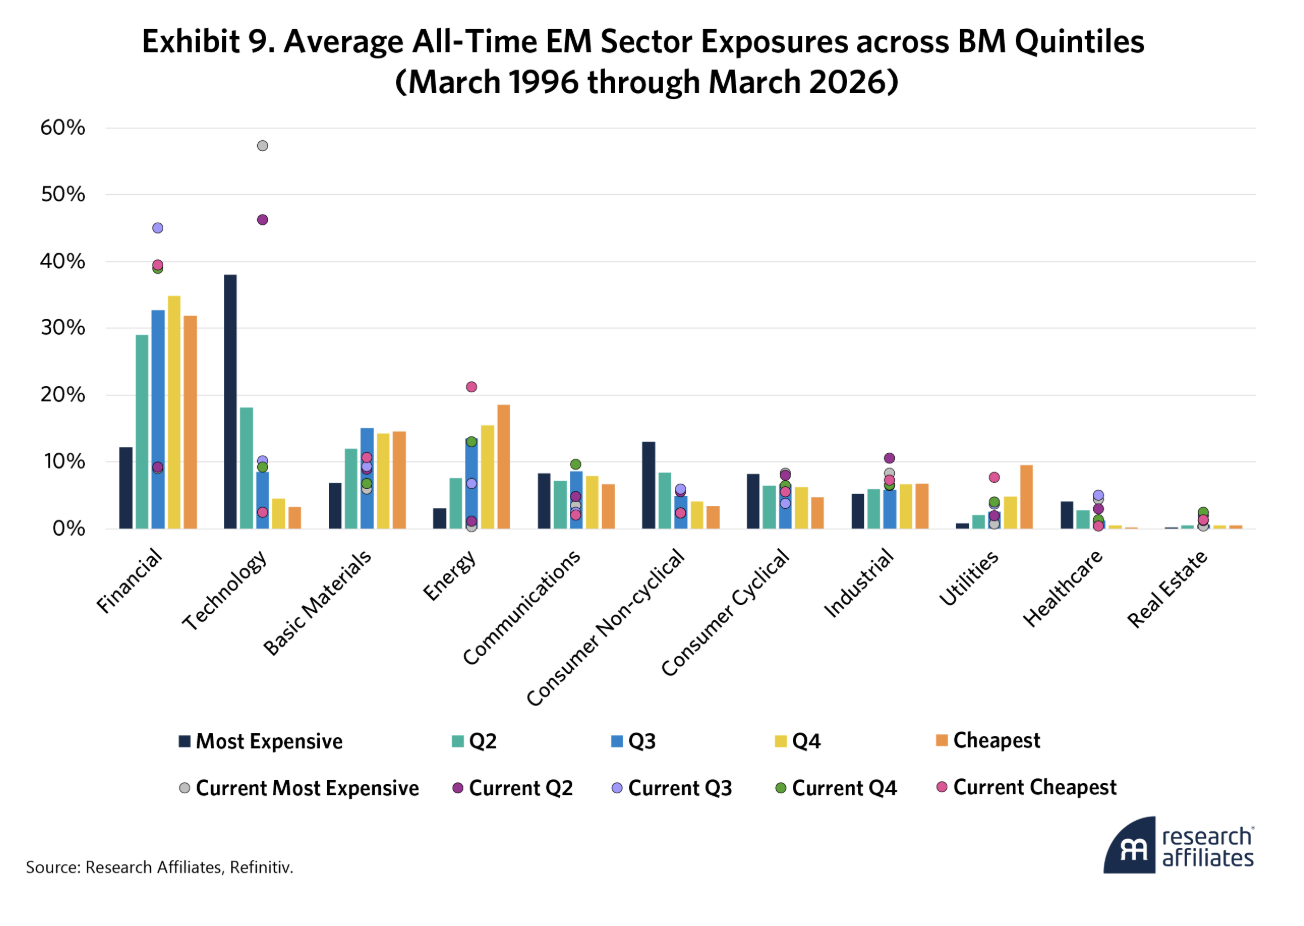
Traversing the valuation spectrum from cheap to expensive means increasing exposure to Tech and Consumer. Going in reverse, from expensive to cheap, means larger allocations to Financials, Basic Materials, Energy, and Utilities. Though the cheapest stocks sacrifice some Tech exposure, they still offer access to the physical layer of the AI narrative. Without copper for wiring, lithium for storage, and hydrocarbons for baseload power, the AI revolution stalls.
Check the Blind Spots: Avoiding Bumps on the EM Road
Every driver knows that even with a clear windshield you still have to check your blind spots. In investing, prioritizing cheapness can lead to value traps and falling knives. Our prior research shows that combining Quality and Momentum signals as screens can produce better outcomes. This may increase concentration, but it doesn’t necessarily result in higher risk. This is where alpha opportunities lie.
Every driver knows that even with a clear windshield you still have to check your blind spots. In investing, prioritizing cheapness can lead to value traps and falling knives.
Exhibit 10 shows whether filtering out the weakest Quality and Momentum names may strengthen value portfolios. Starting with our book-to-market quintile portfolios, we apply Quality- and Momentum-based screens by removing the bottom 25% of stocks within each valuation quintile. Across our March 1996 to March 2026 sample, the results show how each screen changes portfolio outcomes relative to the original unscreened quintile and highlight where fundamentals, price trends, or a combination of both provide the largest incremental benefit across the value spectrum.
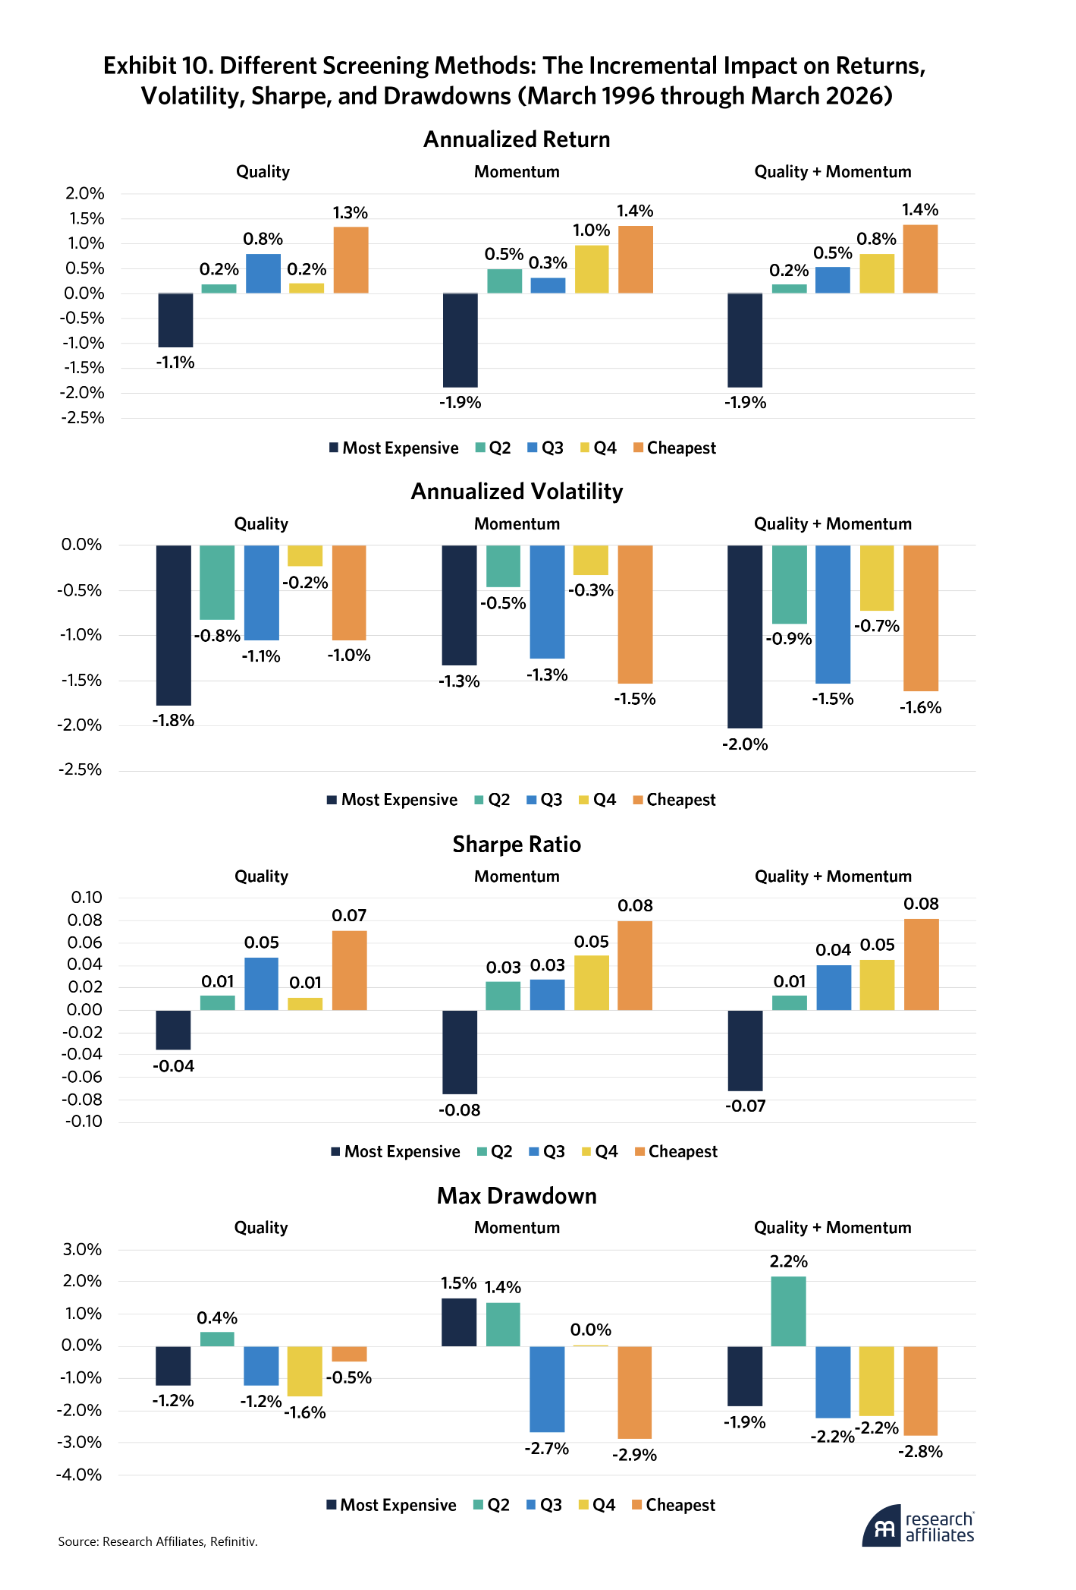
Exhibit 10 shows that screening does not just improve returns in emerging markets deep value portfolios but also changes the quality of those returns. The most compelling gains are in the cheaper quintiles (1.3% to 1.4% vs. unscreened Q5). Applying Quality, Momentum, or combination screens improve Sharpe ratios (0.07 to 0.08 vs. unscreened Q5) and reduce drawdowns in several cases. (All screens reduce drawdowns; Momentum achieves the largest reduction, 2.9%.) That matters: It suggests the screens do more than simply add risk in pursuit of higher returns; they remove the weakest part of the value universe.
In emerging markets, Quality and Momentum may address a similar problem in the deepest value bucket. In Q5, the return increase from Quality, Momentum, and combination screens is almost the same. This implies each screen filters out many of the same names and that low-Quality and weak-trending stocks concentrate in the cheapest quintile.
The screens are not uniformly useful across all quintiles. The incremental benefit declines in the more expensive portfolios, which have less obvious junk to remove. That is consistent with the premise that traps and falling knives cluster in the less-expensive names and that the pricier quintiles already contain higher-quality businesses.
Conclusion
In investing, the rearview mirror identifies what just worked, while the windshield perspective better identifies what the next regime will look like, or what will work. Today, the rearview mirror remains fixed on the U.S. AI narrative. But the windshield view reveals that emerging markets now trade at a deep 50% valuation discount and supply the essential physical components for global growth. Despite trailing the U.S. over the last decade, emerging markets generated a massive 15.5% annualized excess return between early 2025 and early 2026.
But buying cheap exposure is not enough to navigate the EM opportunity. By using Quality and Momentum screens to avoid value traps and falling knives, investors can improve the Sharpe ratio of the cheapest quintile of EM stocks, from 0.23 to 0.31, and boost annualized returns from 7.6% to 9.0%. As globalization winds down, these fundamental guideposts may be the most reliable instruments for charting the route to future EM alpha.
Please read our disclosures concurrent with this publication: https://www.researchaffiliates.com/legal/disclosures#investment-adviser-disclosure-and-disclaimers
End Notes
References
Albuquerque, Mario, Xi Liu, and Que Nguyen. 2024. “Active Value Investing: Avoiding Value Traps.” Research Affiliates.
Albuquerque, Mario, Xi Liu, and Que Nguyen. 2025. “Small Caps, Big Opportunities: Investing Beyond Large-Cap Stocks.” Research Affiliates.
Beck, Noah, and Que Nguyen. 2026. “Why Value, Quality, and Quality Momentum Belong Together.” Research Affiliates.
A message from Advisor Perspectives and VettaFi: Discover something new! Click here to register for our upcoming webcasts.
Membership required
Membership is now required to use this feature. To learn more:
View Membership BenefitsSponsored Content
Upcoming Virtual Events View All


