Iran's de facto closing of the Strait of Hormuz precipitated the latest in a series of energy crises. Since the 1970s, some energy spikes were associated with weak stock markets, but some were not.
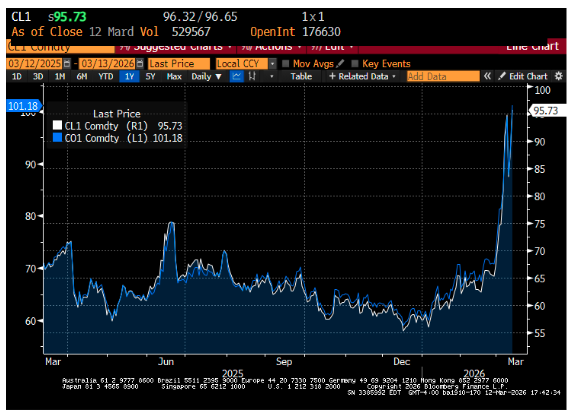
There has been little happy news in energy markets of late. Following the US and Israeli attacks on the Iranian regime on February 28, 2026, ship traffic through the Strait of Hormuz ground to a halt. WTI (West Texas Intermediate) futures are pushing the $100 per barrel level, and Brent futures already crossed the century mark. Relative to its sub-$60 closing price late last year, oil has now seen at 80%+ appreciation since the start of 2026.

To dig a little deeper, I downloaded markets and macroeconomic data to see what energy spike episodes looked like in the past. Before turning to that analysis, a brief aside on Claude, Anthropic’s AI model. At QuantStreet, we’ve been avid users of machine learning and AI tools for some time. For example, we have a nightly news agent scrape the day’s main headlines and email us a summary of how these impact our portfolio positions. We’ve recently started using Claude Code to help us run our analytics processes, as well as to help us streamline and extend our codebase. With the caveat that no AI model is perfect—and certainly Claude makes mistakes and needs human oversight—the capabilities of Claude are astounding. The analysis in this piece owes a lot to Claude, which must have saved between 10-20 hours of human effort. Now back to our analysis.
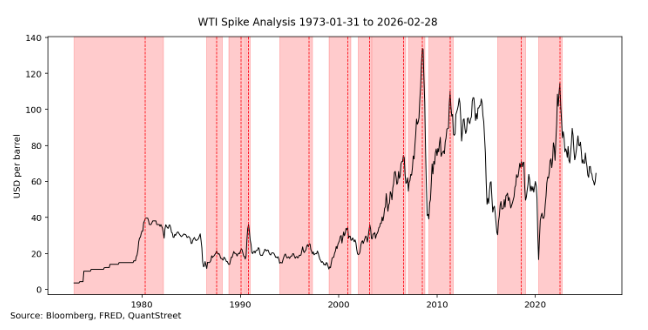
Using month-end spot WTI prices from FRED, the next chart shows all identified price spikes in WTI since the 1970s. Here is how Claude explains the spike-detection algorithm (with some minor edits from me):
We scan monthly WTI prices from 1973 to the present, looking for episodes that follow a simple pattern: a sharp run-up followed by a meaningful pullback. The algorithm tracks a rolling price trough, and once prices rise at least 30% from that trough, it locks in a qualifying spike. It then waits for a pullback of at least 20% from the peak to mark the episode’s completion—recording the start, peak, and end dates along with the size of the run-up and drawdown.
Each past price spike is indicated by the pink, shaded area, with the vertical dashed line indicating the peak WTI level in each spike. The shaded region’s edges indicate the start and end of each spike episode. Because the data used to construct the chart are monthly, the current energy spike (so far, entirely intramonth) is not included in the sample. With this caveat, there have been 12 prior energy price spikes since the 1970s.
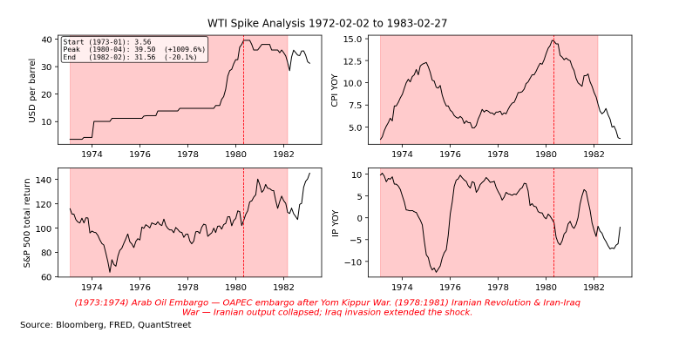
The next chart zooms in on the first of these. This one encompasses two price shocks, though according to our definition, this counts as a single spike: a low, followed by successive highs, and a selloff of more than 20%. The first spike is the Arab oil embargo following the Yom Kippur war in 1973 and the second is the aftershock of the Iranian revolution in 1979. Oil prices went from $3.56 per barrel to around $10 after the embargo in 1974, then rose to a peak of $39.50 in 1980 (indicated by the vertical dashed line), with the episode ending in late-February of 1982 after oil fell to $31.56. Not counting dividends, this was a weak decade for the S&P 500, with the index starting and ending at the $120 level. Year-over-year CPI inflation experienced two spikes, peaking at 12.5% after the oil embargo and again at close to 15% following the Iran revolution. The oil embargo was highly contractionary, leading to a more than 10% drop in industrial production; the Iran revolution price spike was also contractionary, though not as severe.
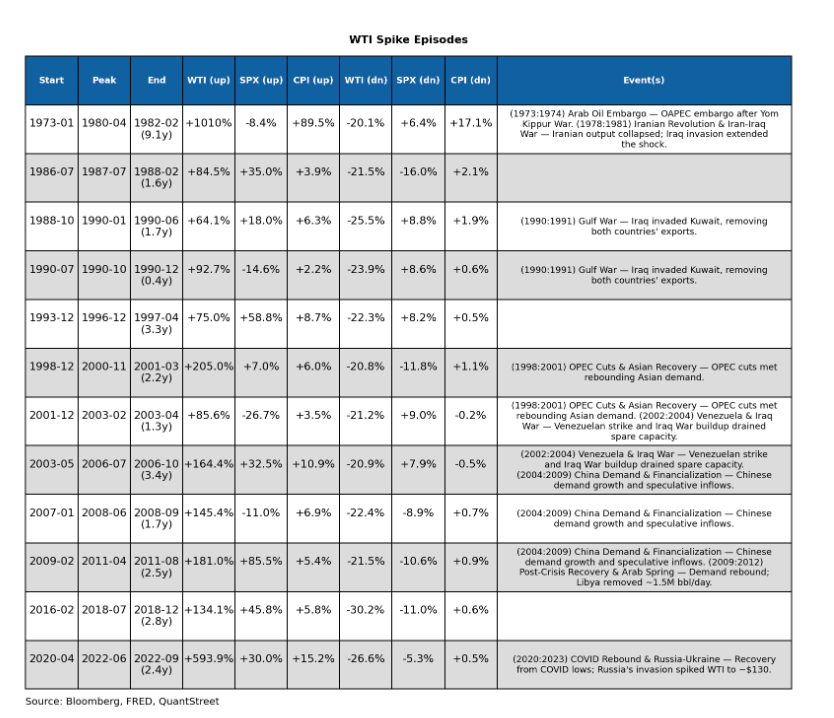
The next table provides a summary of each episode. Each row of the table shows the start, peak, and end dates of each price spike. The number in parentheses below the end date is the length of the episode in years. The WTI (up) cell shows the percent price appreciation in the WTI spot price from the episode start to the peak, and the WTI (dn) cell shows the price fall from the peak to the episode end. The SPX (up) and SPX (dn) cells show the analogous measures for the S&P 500 index, e.g., SPX (up) is the percent rise from the start of the energy peak episode to the month of the episode’s peak oil price. And the CPI (up) and CPI (dn) cells show the change in CPI inflation, i.e., the percent change in the CPI index, over these intervals. The final column shows a brief description of important energy news events in this window (summaries and research done by Claude); when this is blank, it means Claude did not identify a major energy news event that took place in this window.
A few observations:
- By far the largest and longest price shock was the over 1000% uninterrupted price increase oil experienced from the early 1970s to the early 1980s. This lasted over 9 years. During this time the S&P 500 was flat in price terms and the price level (CPI) rose over 100%.
- During the First Gulf War of 1990 to 1991, there were two price spikes. One lasted for 1.7 years, and saw a 64.1% WTI price rise, while the second took place in mid-1990, but lasted only 5 months with a price rise of 92.7%. During the first WTI price spike, the S&P 500 rose over 26%, but the S&P 500 fell during the second price spike by around 6%.
- From the late 1990s until mid-2008, oil prices experienced a series of sharp spikes, followed by mild corrections. The net effect was to take prices from the mid-teens to close to $140 per barrel, before oil prices suffered a major correction as the economy entered a recession during the Global Financial Crisis (GFC).
- The post-GFC rebound and Arab Spring, which took 1.5mm barrels of Libyan oil off the market, coincided to lead to another large oil price increase. Stocks, though, did very well during this episode with a price increase (not counting dividends) of roughly 75%.
- Finally, the economic rebound following COVID, combined with Russia’s invasion of Ukraine in 2022, precipitated a 594% oil price increase, over a 2.5-year period, though stocks were up roughly 25% in price terms in this window.
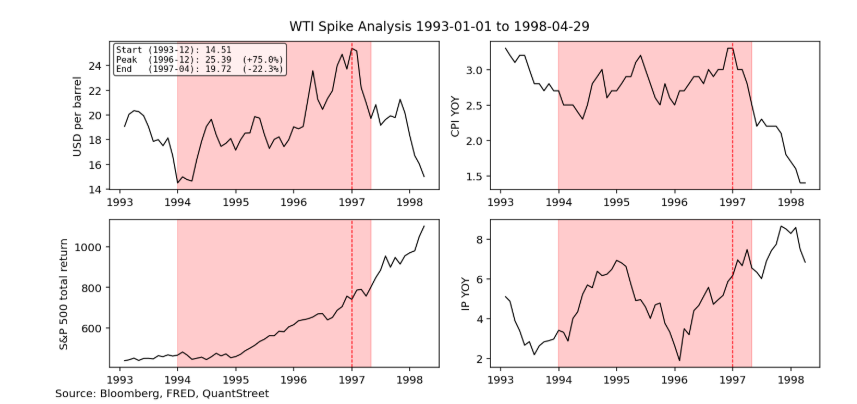
Interestingly, the oil price / stock price relationship is not always negative during large price spikes. For example, in the 1993 to 1997 price spike (next figure), WTI prices had a peak-to-trough rise of 75%, but the S&P 500 was up over 65% in price terms.
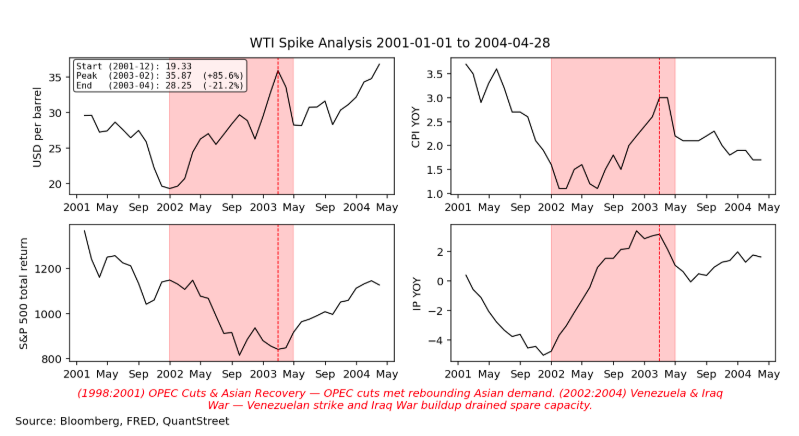
However, other energy price spikes are associated with falling stocks. For example, in the 2001 to 2003 price spike, which was associated with OPEC production cuts and the start of the Second Iraq War, energy prices went up 85.6% while stocks fell close to 20% in price terms.
The takeaway is that oil price spikes are sometimes, but not always, associated with negative economic outcomes and negative stock market returns. A lot depends on the reason for the shock, with supply-driven price spikes—especially those caused by prolonged geopolitical events in the Middle East—generally being negative for economic growth and financial markets, while unattributed price spikes—presumably caused by increased demand due to strong growth—are much more easily absorbed by financial markets and the economy.
Two other wildcards are the length of the spike, with shorter spikes presumably having less impact, and the oil sensitivity of the economy overall.
Looking ahead
WTI futures are contracts that lock in a delivery price for a barrel of oil at some future date at a price that is agreed on today. Futures prices consist of two components. First, they reflect the market’s expectation of what WTI spot prices will look like on future dates. Second, they reflect oil producers’ demand to forward sell future production at a prespecified price and oil consumers’ demand to procure future oil, also at a prespecified price. The group with the stronger hedging demand will push futures prices either below (if producers hedge more) or above (if consumers hedge more) the market’s expectation of future spot prices. This tug of war makes futures prices noisy predictors for future spot prices; nevertheless, futures prices still contain a great deal of information about the market’s expectation of the path of WTI prices over the coming years.
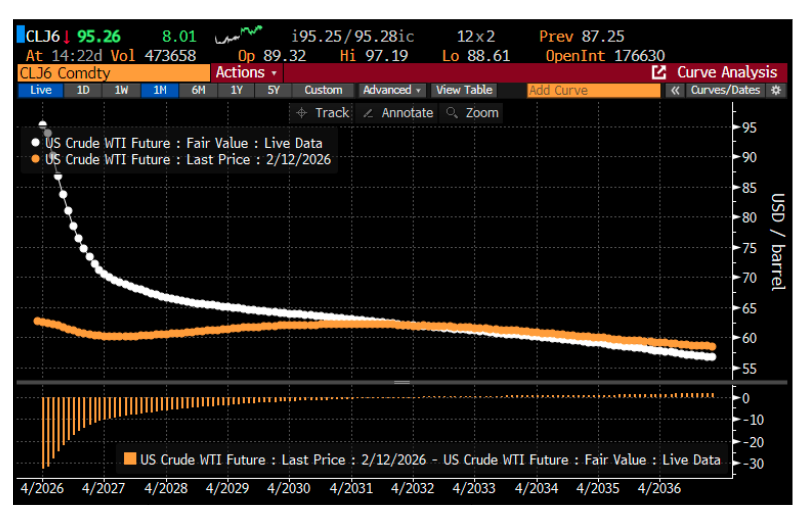
As of the afternoon of March 12, 2026, the WTI futures curve, given by the white curve below, is forecasting a reversion to pre-war energy prices in two years, and to $70 oil in one year. For reference, the yellow curve shows the same set of futures prices from one month ago, which was prior to the start of the Iran conflict and before the recent WTI price spike. By year five, market expectations today are equal to the market’s expectation—or more correctly, hedge-demand adjusted expectations—from one month ago. Interestingly, by 2037, the market now believes in lower oil prices than it did one month ago, perhaps reflecting the expectation that ultimately a regime change in Iran will take place—though it may take a long time—which will result in long-term lower energy prices as the Iran risk premium gets priced out of the market.
There are, of course, those who disagree with this. See, for example, Paul Krugman’s piece “Oil Prices Could Easily Go Much Higher.” But keep in mind that those who really believe in $150 oil in a few months can easily buy September 2026 oil futures. The fact that these currently trade at $80.74 indicates that most do not believe this dire scenario. One reason for this is that the US is keenly aware of the problems in the Strait of Hormuz, and is directing great resources to reopen the Strait to international shipping.
According to Apollo’s Torsten Slok, the US and global economies are now much less dependent on oil than they once were. This, together with the futures market prediction that the price spike will be short-lived, bodes well for the stock market’s and economy’s ability to absorb and move past the present oil price shock.
Only time will tell what actually happens, but the historical evidence—not all energy price spikes are scary for markets and the economy—and the market’s view that the present price spike will last one year, but not more, give reason for cautious optimism.
Working with QuantStreet
QuantStreet is a registered investment advisor. It offers financial planning, separately managed accounts, model portfolios and portfolio analytics, as well as consulting services. The firm’s approach is systematic, data-driven, and shaped by years of investing experience. To work with or learn more about QuantStreet, contact us at [email protected] or sign up for our email list.
A message from Advisor Perspectives and VettaFi: Discover something new! Click here to register for our upcoming webcasts.
© QuantStreet Capital
Read more commentaries by QuantStreet Capital