Performance Overview: Munis posted the best October return since 1990.
Fixed-income sectors generally posted positive returns in October amid limited economic data releases due to the partial federal government shutdown. Markets were focused on Federal Reserve (Fed) rhetoric as the Federal Open Market Committee reduced the fed funds rate for a second consecutive month by 25 basis points (bps), bringing the target range to 4.25%-4.50%. Heading into the month of October, municipals had significantly underperformed taxable fixed income sectors in 2025, as the Bloomberg Municipal Bond Index returned just 2.64% year to date (YTD) through September 30—less than half the Bloomberg U.S. Treasury Index return of 5.36% and well below the Bloomberg U.S. Corporate Index return of 6.88%.
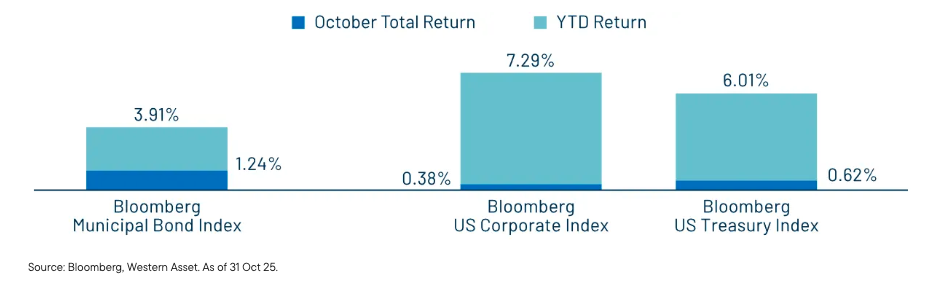
October’s Municipal Bond Index total return of 1.24% not only bucked the historically negative average October return of -0.15% since 1990, but also marked the highest October total return since 1990. This was only the second positive October on record. The 1.24% gain was nearly double the Treasury Index return of 0.62% and more than triple the Corporate Index return of 0.38%. The strong monthly performance lifted the Muni Index YTD return to 3.91%, narrowing the gap but still trailing Treasuries at 6.01% and corporates at 7.29%.
Exhibit 1: Bloomberg Fixed Income Index Returns

Supply and Demand Technicals: Muni demand improves as supply remains at a record pace this year.
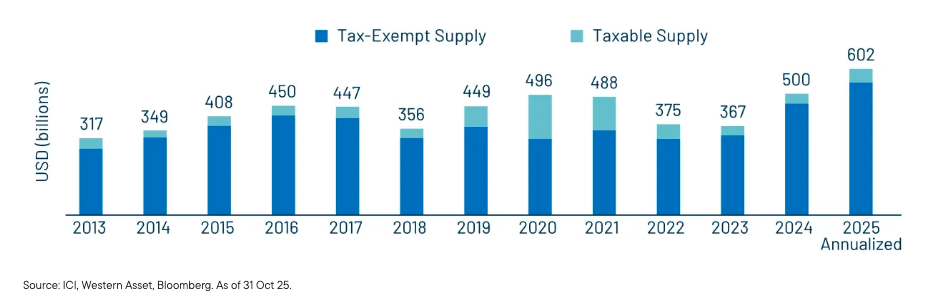
Municipal supply maintained a record pace in October, with total new-issue volume reaching $62 billion, a 27% increase from September’s levels. YTD municipal issuance totaled $502 billion, 16% higher year-over-year (YoY) and surpassing last year’s full-calendar record of $500 billion. YTD tax-exempt supply stood at $456 billion, up 12% YoY, while taxable municipal issuance reached $46 billion, 27% above prior-year levels.
Municipal demand remained robust in October, particularly for longer-duration bonds as the Fed cut rates for the second consecutive month. Municipal mutual funds reported $6.5 billion in net inflows according to Lipper, up from $5.5 billion the prior month and marking the strongest monthly inflow of the year. The long-term category continued to capture the majority of flows with $4.6 billion of net inflows, followed by the intermediate category at $1.6 billion and high-yield funds at $1.2 billion. This accelerating investor demand, especially into longer maturities, contributing to an improved technical backdrop that fueled October’s strong performance.
Exhibit 2: Historical Municipal Supply
Fundamentals: Despite signs of slowing, upgrades continued to outpace downgrades this year.
In October, Moody’s upgraded the state of Illinois to A2 from A3 while maintaining a stable outlook. The action represented the state’s 13th positive rating action by the major agencies since 2020 and its fourth upgrade from Moody’s over that span. The upgrade reflects sustained improvement in Illinois’ financial metrics, reserve levels and structural balance, capping a multi-year turnaround from near-junk status during the pandemic.
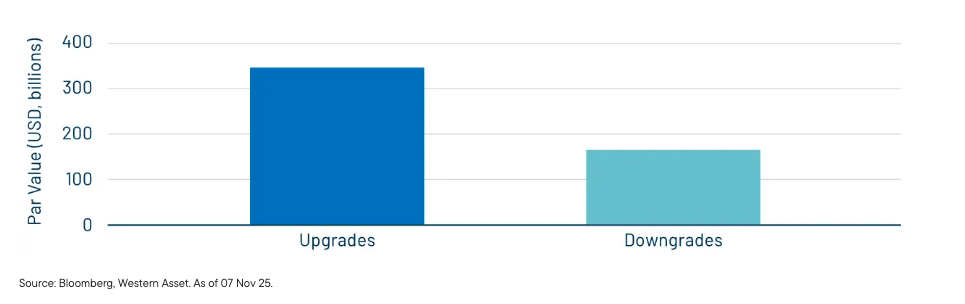
The state’s upgrade comes as broader credit momentum has shown early signs of deceleration. 3Q25 marked the first quarter since the pandemic recovery began in which Moody’s downgrades outnumbered upgrades. Despite the quarterly slowdown, the upgrade cycle remained firmly intact on a YTD basis, with approximately $347 billion in municipal debt upgraded across the major agencies through November 7, over double the $165 billion downgraded, according to Bloomberg.
Exhibit 3: Moody’s S&P and Fitch Upgrades vs. Downgrades YTD
Valuations: Tax-exempt muni income levels remain near generational highs.
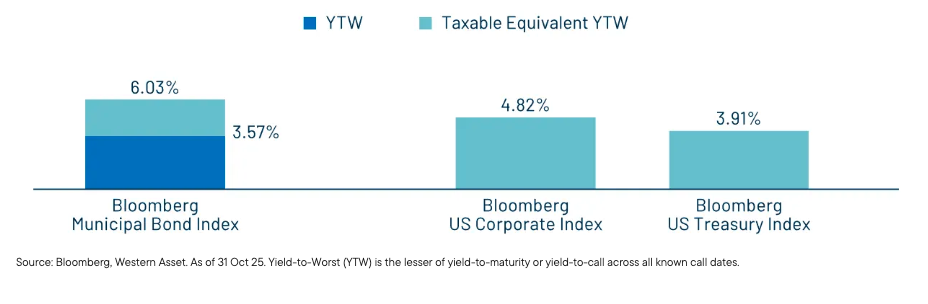
Despite the muni market narrowing the performance gap during the month, tax-exempt income levels remain near generational highs, and the relative YTD underperformance continues to offer potential demand catalysts, especially as the Fed is expected to continue its rate-cutting cycle into 2026. Sustained inflows, combined with the likelihood of seasonally lower supply heading into the holidays, support a constructive outlook for munis to gain further ground versus their taxable counterparts. Western Asset believes investors are well positioned to capitalize on this year’s elevated supply-driven valuations, which may not persist at the same level through 2026.
Exhibit 4: Taxable-Equivalent Muni YTW vs. Corporate and Treasury Indices
A message from Advisor Perspectives and VettaFi: Discover something new! Click here to register for our upcoming webcasts.
Definitions:
“AAA” and “AA” (high credit quality) and “A” and “BBB” (medium credit quality) are considered investment grade. Credit ratings for bonds below these designations (“BB,” “B,” “CCC,” etc.) are considered low credit quality, and are commonly referred to as “junk bonds.”
One basis point (bps) is one one-hundredth of one percentage point (1/100% or 0.01%).
The Bloomberg Municipal “Muni” Bond Index covers the USD denominated long-term tax-exempt bond market. The index has four main sectors: state and local general obligation bonds, revenue bonds, insured bonds, and prerefunded bonds.
The Bloomberg Municipal High Yield Bond Index is an unmanaged index made up of bonds that are non-investment grade, unrated, or rated below Ba1 by Moody’s Investors Service with a remaining maturity of at least one year.
The Bloomberg Taxable Municipal Bond Index is a rules-based, market-value-weighted index engineered for the long-term taxable bond market. To be included in the index, bonds must be rated investment-grade (Baa3/BBB- or higher) by at least two of the following ratings agencies if all three rate the bond: Moody’s, S&P, Fitch. If only two of the three agencies rate the security, the lower rating is used to determine index eligibility. If only one of the three agencies rates a security, the rating must be investment-grade.
The Bloomberg US Corporate Bond Index measures the performance of the investment-grade, fixed-rate, taxable corporate bond market. It includes U.S. dollar-denominated securities publicly issued by US and non-US industrial, utility and financial issuers.
The Bloomberg US Treasury Index measures the performance of US dollar-denominated, fixed-rate, nominal debt issued by the US Treasury with at least one year until final maturity. Treasuries, if held to maturity, offer a fixed rate of return and a fixed principal value; their interest payments and principal are guaranteed.
The Bloomberg Valuation Service (BVAL) provides prices on a daily basis for over 2.5 million securities across all asset classes.
The Bloomberg AAA BVAL Callable Municipal Credit Curve is represented by the US General Obligation AAA Muni BVAL Yield Curve. The BVAL curve is populated with pricing from uninsured AAA General Obligation bonds. The curve is populated with high quality US municipal bonds with an average rating of AAA from Moody’s and S&P. The yield curve is built using non-parametric fit of market data obtained from the Municipal Securities Rulemaking Board, new issues, and other proprietary contributed prices. The curve represents 5% couponing. The 3-month to 10-year points are bullet yields, and the 11-year to 30-year points are yields to worst for a 10-year call.
The yield curve shows the relationship between yields and maturity dates for a similar class of bonds.
Inverted yield curve refers to a market condition when yields for longer-maturity bonds have yields which are lower than shorter-maturity issues.
Yield to worst (YTW) is the lowest potential yield that can be received on a bond without the issuer actually defaulting.
WHAT ARE THE RISKS?
All investments involve risks, including possible loss of principal. Past performance is no guarantee of future results. Please note that an investor cannot invest directly in an index. Unmanaged index returns do not reflect any fees, expenses or sales charges.
Equity securities are subject to price fluctuation and possible loss of principal.
Fixed-income securities involve interest rate, credit, inflation and reinvestment risks; and possible loss of principal. As interest rates rise, the value of fixed income securities falls. Low-rated, high-yield bonds are subject to greater price volatility, illiquidity and possibility of default.
Municipal income may be subject to state and local taxes. Some income may be subject to the federal alternative minimum tax for certain investors. Capital gains, if any, are taxable.
Changes in the credit rating of a bond, or in the credit rating or financial strength of a bond’s issuer, insurer or guarantor, may affect the bond’s value.
U.S. Treasuries are direct debt obligations issued and backed by the “full faith and credit” of the US government. The US government guarantees the principal and interest payments on US Treasuries when the securities are held to maturity. Unlike US Treasuries, debt securities issued by the federal agencies and instrumentalities and related investments may or may not be backed by the full faith and credit of the US government. Even when the US government guarantees principal and interest payments on securities, this guarantee does not apply to losses resulting from declines in the market value of these securities.
Read more commentaries by Western Asset Management