Last week was arguably the biggest economic data week of the year, with almost a quarter of the S&P 500's market cap reporting second-quarter earnings, the Federal Reserve's rate decision, the August 1st "reciprocal" tariff deadline, and the July jobs report. It ended with a bang given the stunning details of the jobs report: 73,000 payrolls were created, which was weaker than the consensus estimate of 104,000. Much more important, though, was the heavy revision to the prior two months. May's job gains were revised down from 144,000 to 19,000; June's gains were revised down from 147,000 to 14,000 (no, those are not typos).
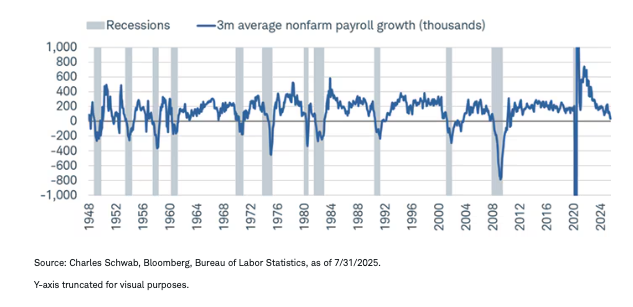
That means the three-month average of monthly payroll gains has fallen sharply to 35,000, down from 64,000 in June (which, by the way, was 150,000 pre-revision). As you can see in the chart below, 35,000 is a new cycle low and very much consistent with the start of prior recessions.
Payroll gains dropping sharply

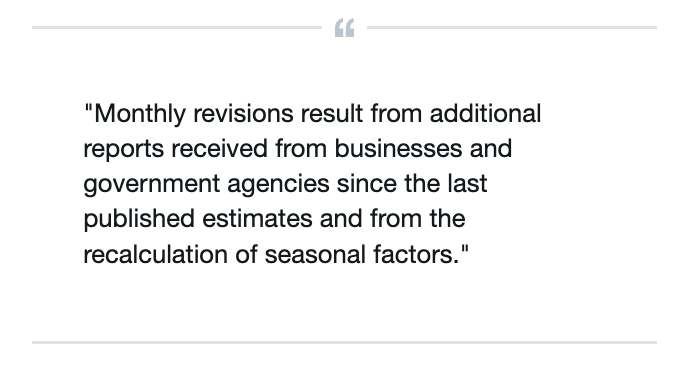
Also consistent with recessionary behavior is the magnitude of the downward revisions for May and June. As you can see in the chart below, the -258,000 two-month revision is the largest in more than a decade excluding the sharp decline in 2020.
The revisions are not suggestive of anything nefarious happening when it comes to data collection (see the volatility in the chart pre- vs. post-pandemic). Per the Bureau of Labor Statistics (BLS) in July:
Revisions suggest much shakier ground
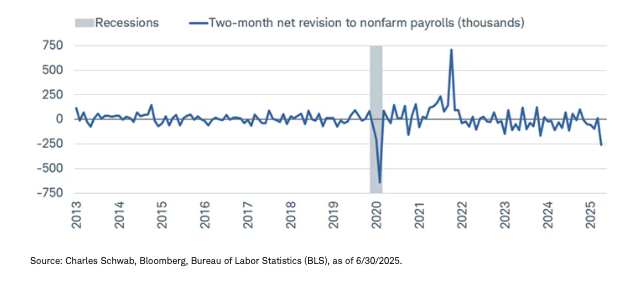
The unemployment rate remained low relative to history in July but, importantly, did tick higher from 4.1% to 4.2% (taken out three decimal places, it's at a new cycle high). That is important context given the severity of the decline in payroll growth. As shown in the table below, going back to the 1940s, the average three-month gain in nonfarm payrolls at the start of a recession is 96,000. Clearly, we are now well below that. There is more forgiveness with the unemployment rate, since it has averaged 4.7% at the start of recessions; but it's worth noting there is a huge range around that average.
Recessions and employment
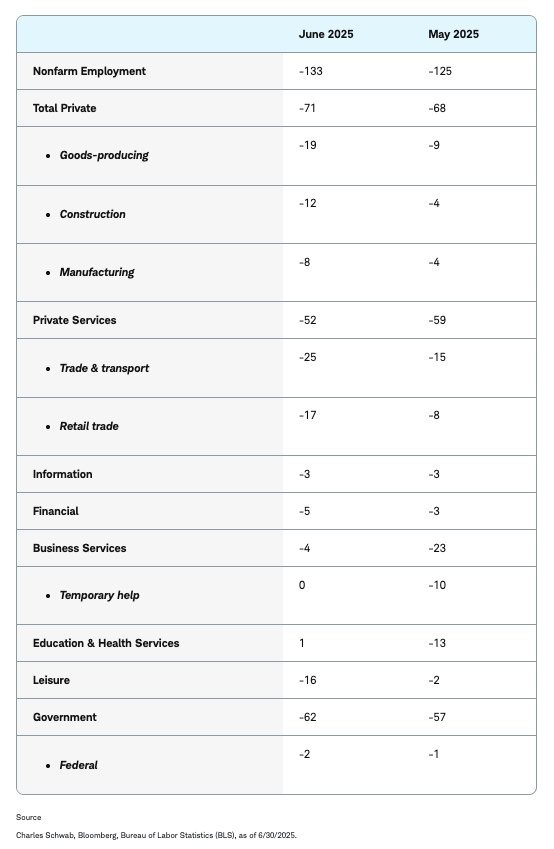
Downward revisions in May and June were large and far-reaching across industries; they're also now showing the hit from the trade war. Shown in the table below are the revisions for overall payrolls and the broad sectors of the economy. The government has been a significant source of weakness, but what also stands out are the sectors that have been advertised as benefiting from re-shoring that is associated with higher tariffs. Revisions in manufacturing and trade & transport have been bleak; and they're getting worse in retail and construction.
Employment revisions by category
*change from initial estimate (thousands)
Supply-side stress
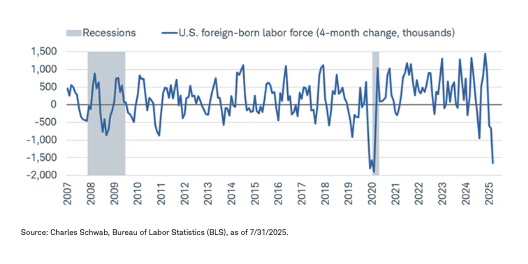
One of the most glaring aspects of the labor market over the past several months has been the stark deterioration in the foreign-born labor force. Over the past four months, it has seen a decline of nearly 1.6 million people, which rivals what we saw during the depths of the COVID-19 pandemic and is nearing a record.
Declines of that magnitude are notable considering foreign-born individuals have been responsible for nearly all labor force growth since the beginning of the pandemic. That brings the potential "speed limit" of the labor market down, meaning the economy can create fewer jobs each month without necessarily seeing the unemployment rate go markedly higher (importantly, though, that also brings potential economic growth down). If there is a structural reason for the drop in labor supply and participation, it could be suggestive that the reduction in supply is offsetting the decrease in labor demand.
Foreign-born labor contracting sharply
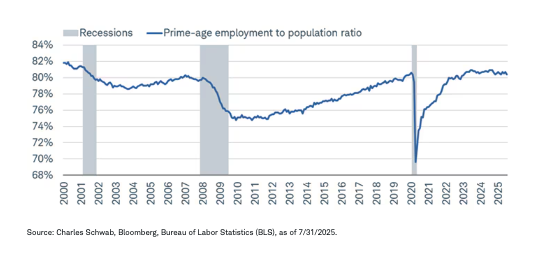
So far, that is consistent with the prime-age employment-to-population ratio staying in a somewhat tight range over the past few years. Its elevated level is suggestive of relatively healthy labor conditions, but we'd note that this doesn't tend to be a strong leading indicator. By the time it's rolling over, a recession is usually well underway.
Employment share still high
Initial claims against the grain
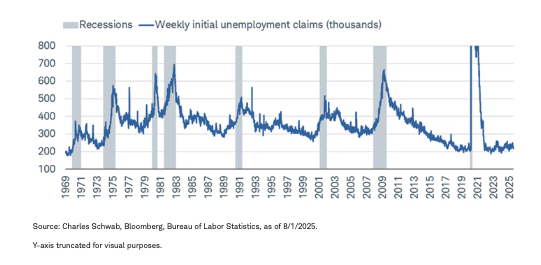
One key labor market indicator going against the recession current is initial jobless claims. Released weekly, claims are arguably the best real-time tell we have as to whether companies are laying off individuals en masse. So far, that isn't the case, given current low levels and remarkable stability over the past several years.
Claims remain low for now
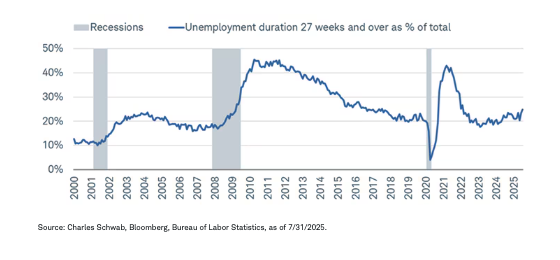
Continuing claims, which are filed when individuals cannot find a new job and opt to continue receiving unemployment benefits, remain quite high—but that supports the argument that the economy remains in a low-hiring, low-firing mode. The issue is that it's difficult to stay in that mode in perpetuity when pressure is being applied via higher tariffs and restrictive labor policy. We are seeing some of that stress come through, given the share of individuals unemployed for more than 27 weeks rose in July to its highest since the beginning of 2022.
Labor scarring taking effect
In sum
There was a definitive narrative shift in the economics community on Friday given the severity of the payroll revisions for May and June. As always, no single report should be obsessed over or extrapolated; but if we continue to see a sharp slowdown in job growth and drift higher in the unemployment rate—consistent with the trends from May to July—it would bring forward the possibility that recessionary conditions are forming quickly. In 2008, then Fed chair Alan Greenspan noted "a recession is characterized by significant discontinuities in the data." The past few months of revisions do indeed count as rather significant discontinuities. They also underscore how difficult data-gathering has been in the post-pandemic world, which has likely been exacerbated by layoffs and scarcer resources in the government.
It's logical to see how the impact of the trade war sparked a chilling effect in the labor market in the aftermath of "Liberation Day"—and thus logical to see how businesses continued to err on the side of caution in response. If they viewed the past few months as peak trade uncertainty, perhaps the attendant slowdown in job creation can (to some extent) be looked at in isolation. It's too early to make that determination, though, as we think the business community will continue to deal with an elevated level of instability caused by the mercurial nature of policymaking in Washington.
A message from Advisor Perspectives and VettaFi: To learn more about this and other topics, check out some of our webcasts.
This material is intended for general informational and educational purposes only. This should not be considered an individualized recommendation or personalized investment advice. The investment strategies mentioned may not be suitable for everyone. Each investor needs to review an investment strategy for his or her own particular situation before making any investment decisions.
All expressions of opinion are subject to change without notice in reaction to shifting market, economic or political conditions. Data contained herein from third party providers is obtained from what are considered reliable sources. However, its accuracy, completeness or reliability cannot be guaranteed.
Past performance is no guarantee of future results.
Investing involves risk, including loss of principal.
The policy analysis provided by the Charles Schwab & Co., Inc., does not constitute and should not be interpreted as an endorsement of any political party.
All corporate names and market data shown are for illustrative purposes only and are not a recommendation, offer to sell, or a solicitation of an offer to buy any security.
Diversification and asset allocation strategies do not ensure a profit and do not protect against losses in declining markets.
Source: Bloomberg Index Services Limited. BLOOMBERG® is a trademark and service mark of Bloomberg Finance L.P. and its affiliates (collectively "Bloomberg"). Bloomberg or Bloomberg's licensors own all proprietary rights in the Bloomberg Indices. Neither Bloomberg nor Bloomberg's licensors approves or endorses this material or guarantees the accuracy or completeness of any information herein, or makes any warranty, express or implied, as to the results to be obtained therefrom and, to the maximum extent allowed by law, neither shall have any liability or responsibility for injury or damages arising in connection therewith.
Indexes are unmanaged, do not incur management fees, costs, and expenses, and cannot be invested in directly. For additional information, please see schwab.com/indexdefinitions.
Investment and Insurance Products Are: Not FDIC Insured • Not Insured by Any Federal Government Agency • Not a Deposit or Other Obligation of, or Guaranteed by, the Bank or any of its Affiliates • Subject to Investment Risks, Including Possible Loss of Principal Amount Invested
The Charles Schwab Corporation provides a full range of brokerage, banking and financial advisory services through its operating subsidiaries. Its broker-dealer subsidiary, Charles Schwab & Co. Inc. (Member SIPC), and its affiliates offer investment services and products. Its banking subsidiary, Charles Schwab Bank, SSB (member FDIC and an Equal Housing Lender), provides deposit and lending services and products.
This site is designed for U.S. residents. Non-U.S. residents are subject to country-specific restrictions. Learn more about our services for non-U.S. residents, Charles Schwab Hong Kong clients, Charles Schwab U.K. clients.
© 2025 Charles Schwab & Co., Inc. All rights reserved. Member SIPC. Unauthorized access is prohibited. Usage will be monitored.
© Charles Schwab
Read more commentaries by Charles Schwab