Are You Buying What They Selling? We’re Not—Here’s Why.
Membership required
Membership is now required to use this feature. To learn more:
View Membership BenefitsFixed income benchmarks have two fundamental flaws. First, their exposures prioritize the needs of borrowers rather than investors. Second, they tend to expose investors to the biggest risks at the worst times.
Cui bono?
Cui bono (pronounced “kwee boh-no” is a Latin phrase that roughly translates to “who benefits?” Unlike its more famous and charitable cousin—pro bono—cui bono is often used to suggest that the entity that gains from a situation is likely to be the one causing it. So, who causes (and likely benefits) from fixed income benchmark construction?
Unfortunately, the answer is usually not investors— at least not those who take a benchmark-centric approach to fixed income investing.
To see why this is the case, compare fixed income benchmark construction to its equity counterpart. Standard equity benchmarks are based on market capitalization. Importantly, these valuations are driven by the market’s assessment of factors such as sales growth, operating margins, cash flows, and managerial competency. As these views change, so do their market values, resulting in more successful companies becoming larger shares of their indexes. A second-order effect is these benchmarks can become harder to beat when the stronger companies grow and the weaker ones fail. One more consideration is the relative alignment between management and shareholders. A lot of academic research has gone into principal-agent problems that shareholders have with their corporate managers. However, most managers still want their companies to grow and be successful rather than shrink and fail. The ubiquity of stock-based compensation schemes over the past several decades has also helped reinforce that alignment.
Compare this situation with that of the fixed income markets. Which entities are the biggest components of fixed income benchmarks? Too often it’s not the best issuers. Instead, it tends to be companies, countries, and sectors that borrow the most; needing to borrow a lot is rarely a sign of financial health, whether that’s a company borrowing to plug a net loss or a government that makes the easy choice to issue debt to fund a deficit rather than make the difficult choice of raising taxes or cutting spending.
Where does that leave investors who track closely to these benchmarks? The answer too often is it leaves them exposed—exposed to the weaker borrowers, exposed to the weaker sectors, exposed to the needs of debtors rather than investors.
A coincidence? We think not.
There is a fundamental mismatch between the priorities and incentives for borrowers and lenders in the global bond markets.
Figure 1 illustrates borrowers’ incentives. The chart shows the yield to worst on the Bloomberg U.S. Corporate Bond Index and the proportion of investment-grade corporate bonds issued with a maturity longer than 10 years over the past decade. From early 2015 through 2021, when yields were low, the percentage of bonds issued longer than 10 years rose, averaging about 20% of issuance. When yields plummeted after the onset of the COVID-19 pandemic, however, long bond issuance jumped, reaching a peak of 30% in late 2020. This allowed borrowers to lock in low yields for as long as possible. As yields rose in 2022—an environment favoring lenders over borrowers—issuers pivoted to shorter-maturity debt for more flexibility and reduced long-term obligations. At one point, issuance beyond 10 years fell to below 10%—the lowest in well over a decade.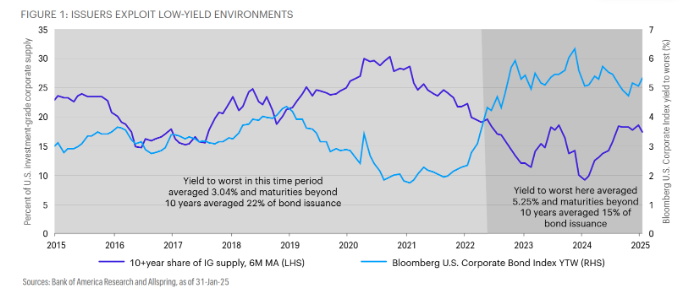
Benchmarks leave investors exposed to the biggest borrowers
The composition of a fixed income benchmark reflects those who borrow the most. Figure 2 highlights this issue with the Bloomberg Global Aggregate Bond Index. Known as the “Global Agg,” this is the largest global, investment-grade bond index. For every dollar invested to passively track this index, 67 cents is allocated to U.S. Treasury debt, other global government bonds, or U.S. agency mortgage-backed securities; 22 cents is allocated to the next 10% of issuers with the most debt outstanding; and 11 cents is allocated to the remaining 90% of issuers with the least amount of outstanding debt.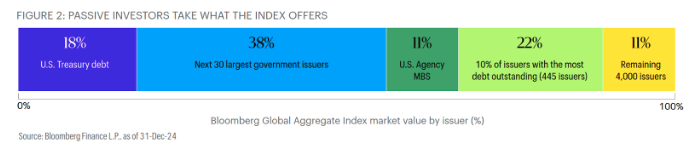
Shifts in market composition leave passive investors particularly exposed
The structure of bond indexes, which are market capitalization-weighted, puts borrowers (bond issuers) in the driver’s seat and prioritizes their needs over those of lenders (bond investors). This structure has also led to a shifting of benchmark characteristics over time, driven by the changing needs of issuers. These changes may result in the index having its largest allocation to a given sector at an inopportune time. One example of this is the allocation to U.S. mortgage-backed securities in the Global Agg, which grew over time as the excesses in that market (before the Global Financial Crisis) were fanned by strong demand and loose underwriting. Figure 3 shows the allocation to securitized sectors in the Global Agg grew 14% from early 2005 to late 2008, reaching its peak at the worst possible time for Global Agg-based investors.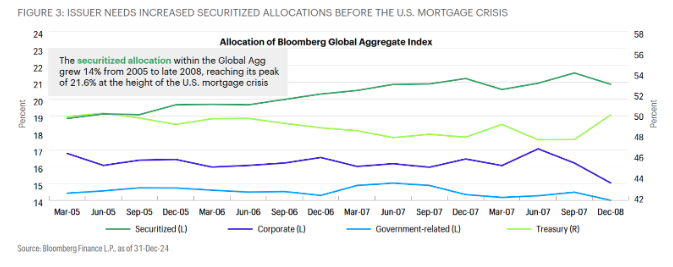
From the end of 2008 to the end of 2021, issuers exploited the low-yield environment by terming out their debt. As a result, duration (interest rate sensitivity) of the Global Agg rose 47% (Figure 4). This change left the index at its all-time highest duration, just as the U.S. Federal Reserve (Fed) began its most aggressive rate-hiking cycle in a generation, and resulted in the worst price declines for bondholders in the history of the index. A shift by issuers to shorter-maturity bonds since 2022 has brought the index’s duration down slightly, but it remains materially longer than it was immediately following the Global Financial Crisis of 2008. Investors with passive bond exposure have tracked this rise in duration without the potential to move shorter or longer relative to the benchmark over time.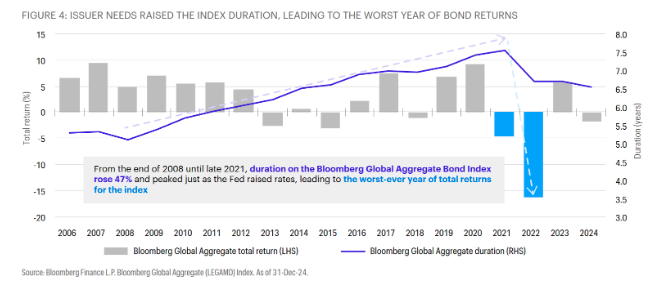
These same factors have allowed the allocation to global Treasury bonds in the Global Agg to increase to more than half of the index and for the allocation to corporate debt to meaningfully shift. Since the end of 2008, the allocation to corporate bonds in the index grew by 20%, while the credit- quality ratings of the corporate bonds deteriorated. Figure 5 shows that the proportion of the Bloomberg Global Aggregate Corporate Index rated Baa was 26% at the end of 2008. The amount of corporate debt outstanding has more than tripled since then, and the proportion rated Baa has surged to 47% of the total.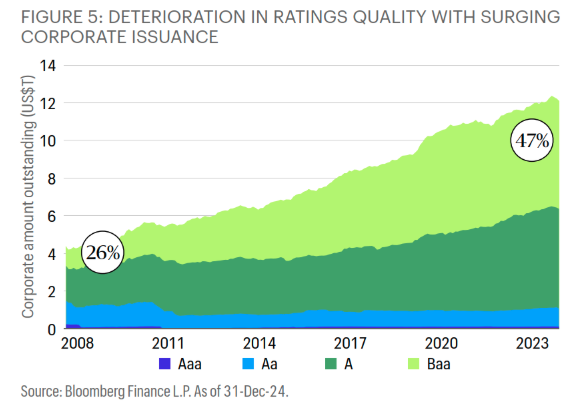
Active, global, multi-sector bond portfolios can put the investor first
Unlike passive strategies designed to closely track flawed fixed income benchmarks, an active, global, multi-sector approach can prioritize investors’ needs. Nimble, sector-diversified fixed income investors backed by substantial credit research capabilities can uncover opportunities across securities, geographies, and currencies. Adhering to our differentiated, repeatable process, our team believes in unconstrained multi- sector fixed income as a strategy that not only better manages risk and pursues enhanced returns but also puts investors’ needs first.
Dynamically allocating capital across global fixed income sectors may help generate a more consistent return stream while mitigating volatility. Figure 6 shows how Allspring’s global income strategy has outperformed the eVestment universe average and both the Bloomberg U.S. and Global Aggregate Indexes with similar volatility. The chart also illustrates that simply having exposure to a broad set of sectors may not be enough, as each of the sectors shown are included in the Bloomberg Multiverse Index. We believe an approach designed to exploit the broadest set of inefficiencies from the fixed income landscape through a robust and repeatable process is essential to investor success, affording the opportunity to unlock the full potential that global bond markets can offer to investors.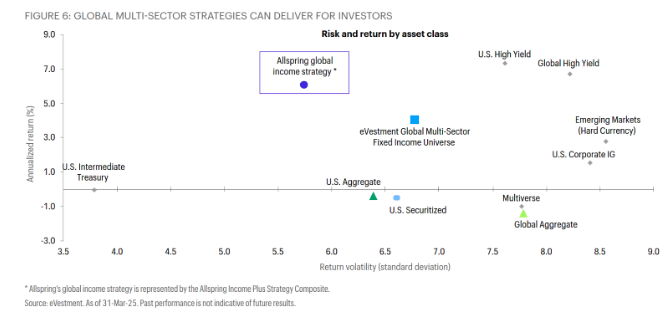
Global fixed income benchmarks offer investors what issuers want to sell. The culmination of hundreds or thousands of issuers’ needs is rarely an optimal portfolio for bond investors. With that in mind, we approach global multi-sector investing with a different perspective. Figure 7 illustrates the expected ranges, the actual exposures over the trailing five years, and the current allocation for Allspring’s global income strategy (as of March 31, 2025) across interest rate, currency, and sector exposures. Our goal is to source the most attractive income and risk-adjusted returns from across the global bond markets with this portfolio. Substantially different from the largest fixed income benchmarks in terms of interest rate sensitivity, currency exposure, and sector allocation, this portfolio is positioned using our team’s rolling six-month time horizon, constructed with a focus on diversification and unbiased by static, always-on allocations. We believe this portfolio puts investors front and center and leaves the issuers—and the benchmarks—to fend for themselves.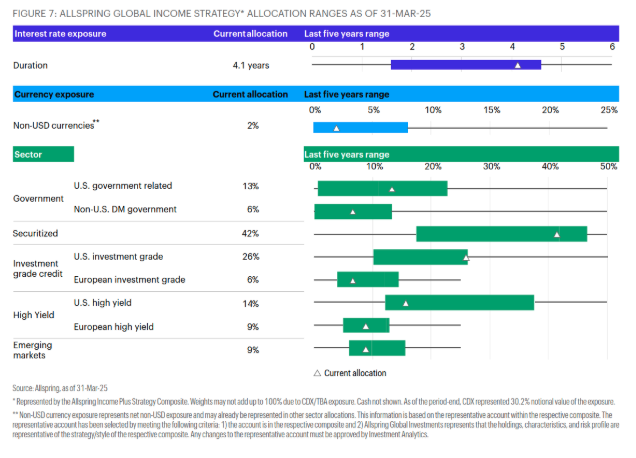
It’s time to take charge
In a world where passive fixed income strategies are often sold as safe, efficient, and investor-friendly, we’re not buying what they’re selling. The evidence is clear: Benchmark-driven portfolios are shaped by the needs of borrowers, not the goals of investors. Over time, these exposures shift—often in ways that increase risk and reduce return potential—leaving investors holding the bag when the music stops. Cui bono? Certainly not the investor. It’s time to rethink who’s really in charge. If—like Bono from the Irish rock band U2—you still haven’t found what you’re looking for when it comes to fixed income investing, then a thoughtfully constructed, flexible, global multi-sector strategy that puts investors in charge could be the answer.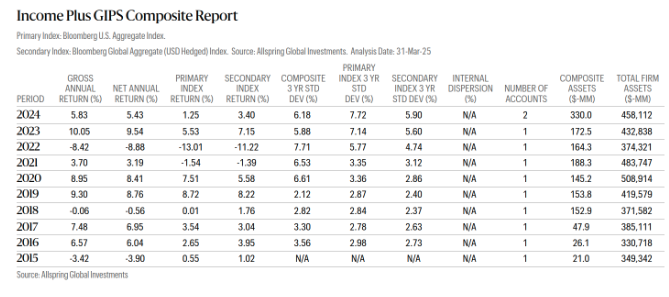
DISCLOSURES
Allspring Global Investments (Allspring) claims compliance with the Global Investment Performance Standards (GIPS®) and has prepared and presented this report in compliance with the GIPS standards. Allspring has been independently verified for the periods January 1, 1997 - December 31, 2023. A firm that claims compliance with the GIPS standards must establish policies and procedures for complying with all
the applicable requirements of the GIPS standards. Verification provides assurance on whether the firm’s policies and procedures related to composite and pooled fund maintenance, as well as the calculation, presentation, and distribution of performance, have been designed in compliance with the GIPS standards and have been implemented on a firm-wide basis. The Income Plus Composite has had a performance examination for the periods January 1, 2022 - December 31, 2023. The verification and performance examination reports are available upon request.
For the purpose of complying with GIPS, the GIPS firm is defined as Allspring. Since the GIPS firm’s creation in 1996, the firm has acquired a number of investment teams and/or assets through mergers or acquisitions which include assets and/or investment teams from Wells Capital Management, EverKey Global Partners, Wells Fargo Asset Management (International) Limited, Analytic Investors, LLC, Golden Capital Management, LLC, Wells Fargo Asset Management Luxembourg S.A. and Wells Fargo Funds Management, LLC (WFFM).
The Income Plus Composite (Composite) consists of all discretionary accounts managed in this style. The Composite contains accounts investing primarily in income-producing securities, including U.S. and international corporate bonds, mortgage and asset-backed securities, U.S. government obligations, and foreign sovereign debt. The manager combines a top-down macro credit outlook with a bottom-up individual security selection process that focuses on measuring relative value on a risk-to-return basis. The manager maintains a flexible duration target of typically between zero and six years and uses tactical shifts in currency exposure for gains, hedging, and/or risk management. Composite results from December 1, 2023 through December 31, 2024 were restated in 2025 to reflect adjustments to expenses applied to calculate gross returns for a participating portfolio. Investment results are measured versus the Bloomberg U.S. Aggregate Index. Effective November 1, 2024, the Bloomberg Global Aggregate (USD Hedged) Index was added as a secondary benchmark. The Composite was created in 2013. The Composite inception date is March 1, 2013.
Composite returns are net of transaction costs and non-reclaimable withholding taxes, if any, are expressed in US dollars, and reflect the reinvestment of dividends and other earnings. Gross Composite returns do not reflect the deduction of investment advisory fees. Net Composite returns are calculated using a model investment advisory fee, which is the maximum annual advisory fee based upon the fee schedule in effect during each respective performance period. Any changes to the fee schedule are reflected in the calculation of the net Composite returns beginning with the period in which the fee schedule is revised. Actual fees may vary depending on, among other things, the applicable fee schedule and portfolio size. Allspring’s fee schedules are available upon request and may also be found in Part 2 of Form ADV. The published fee schedule for this strategy is 0.38% for the first $50mm, 0.34% for the next $50mm and 0.30% over $100mm. Additional information regarding Allspring’ s policies for valuing investments, calculating performance and preparing GIPS Composite Reports is available upon request. A list of composite descriptions, a list of limited distribution pooled fund descriptions, and a list of broad distribution pooled funds are available upon request.
Internal dispersion is the equal weighted standard deviation of the annual gross returns of all accounts included in the Composite for the entire year. For years where there are 5 or fewer accounts in the Composite for the entire year, dispersion is not presented as it is not a meaningful statistical calculation. The 3-year annualized standard deviation measures the variability of the gross Composite returns and the index returns over the preceding 36-month time period. The notation “N/A” (not available) will appear for periods, if any, where 36 monthly returns are not available for the Composite and/or the index.
Actual performance results may differ from Composite returns, depending on the size of the account, investment guidelines and/or restrictions, inception date and other factors. Performance for some accounts in this Composite may be calculated by third parties that use different security pricing and performance methodologies. Past performance is not indicative of future results. As with any investment vehicle, there is always the potential for gains as well as the possibility of losses. GIPS® is a registered trademark of CFA Institute. CFA Institute does not endorse or promote this organization, nor does it warrant the accuracy or quality of the content contained herein.
A message from Advisor Perspectives and VettaFi: To learn more about this and other topics, check out some of our webcasts.
Membership required
Membership is now required to use this feature. To learn more:
View Membership BenefitsSponsored Content
Upcoming Virtual Events View All


