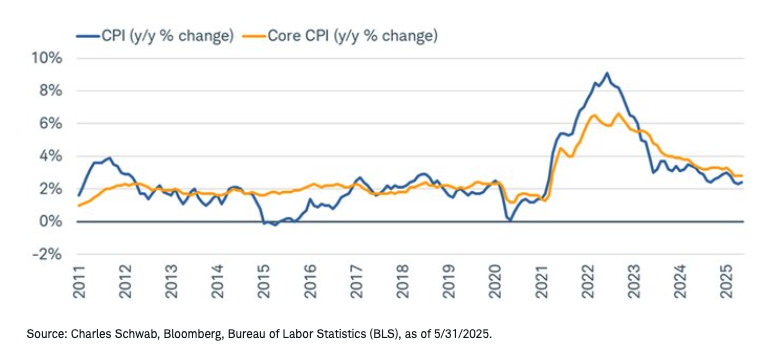
"Complation"…Is there too much complacency regarding inflation? The latest batch of official inflation readings have been fairly benign, begging a question about whether the tariff impact is more bark than bite. As shown below, neither headline nor core (ex-food/energy) consumer price index (CPI) readings were signal flags in May. Core goods prices, which are most directly impacted by tariffs, were flat, meaning the year-over-year (y/y) change was the same as in April; while there are categories putting downward pressure on inflation, including the shelter components and wages.
CPI tame…for now

The rub is that much of the economic data outside of direct inflation readings suggest higher inflation ahead. Both key purchasing managers indexes (PMIs)—the Institute for Supply Management (ISM) and S&P Global—show that output prices have jumped to levels akin to the early part of the pandemic. The National Federation of Independent Business (NFIB) survey is also showing that a higher-than-average number of small businesses are raising prices, or plan to. Many high-profile larger companies have announced price increases as well—including Walmart, Macy's, Proctor & Gamble, Ford, Subaru, Volvo, Volkswagen, Mitsubishi, Mattel, Adidas, Ralph Lauren, Stanley Black & Decker, Best Buy, Microsoft, and Nintendo.
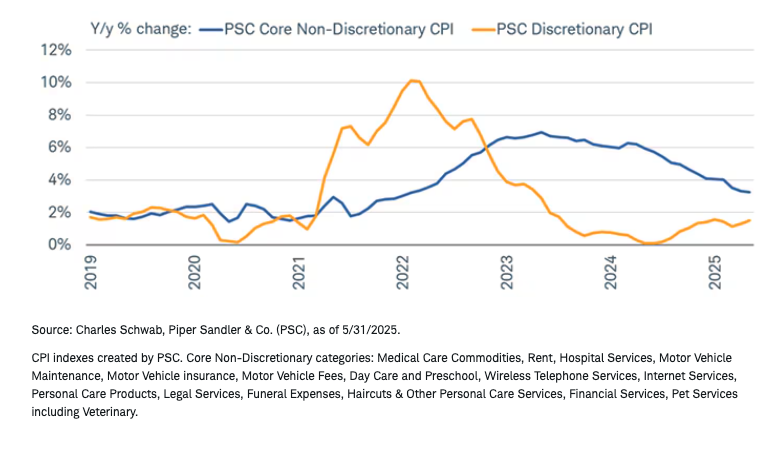
What's also notable is the still-wide gap between the discretionary ("wants") and non-discretionary ("needs") components of the CPI. As shown below, although there has been some convergence between the two, needs' prices are running at about twice the level of wants' prices; disproportionately hurting lower-income consumers.
Needs > wants
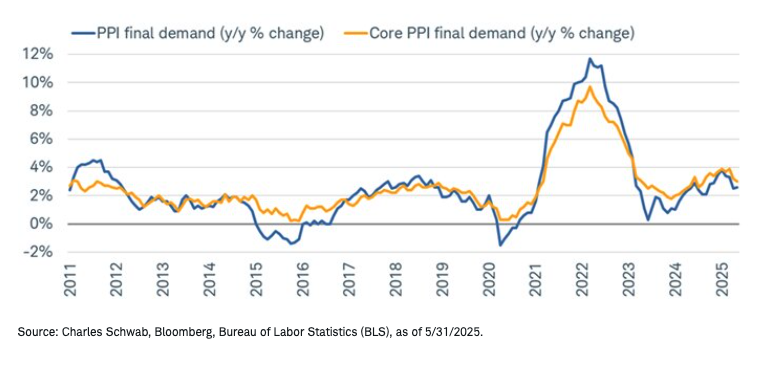
At the producer level, price pressures are still evident but not yet worrisome. Shown below are the y/y and core changes in the producer price index (PPI), which have rolled over slightly but are still in an uptrend since mid-2023.
Warm—not hot—producer prices
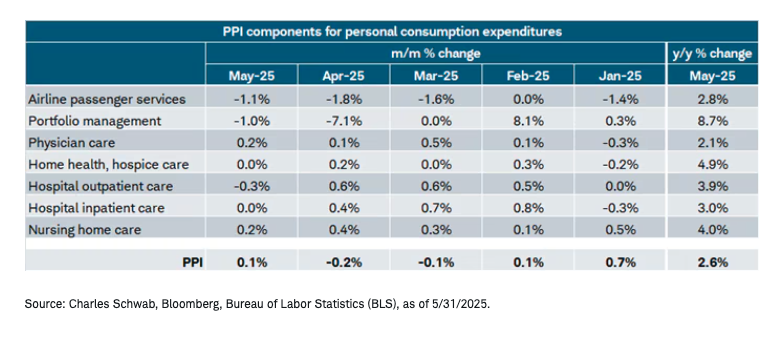
That isn't a red flag by any means, but the PPI is getting outsized attention—particularly in this cycle—because several of its components map over to the Federal Reserve's preferred Personal Consumption Expenditures (PCE) Price Index, giving us a solid idea of what PCE will look like well before it comes out (at the end of each month). As shown in the table below, things are looking good for May's PCE, since the PPI-related components rose by an average of 0.1% month-over-month (m/m).
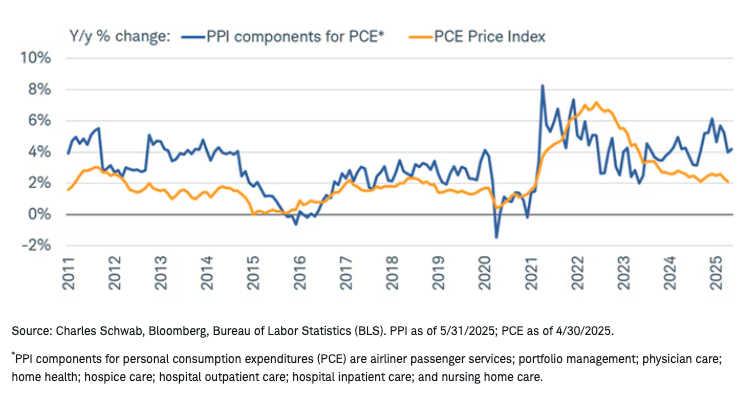
On a y/y basis, however, those components are showing a notable uptrend over the past couple years—an interesting decoupling from the PCE Price Index, as shown in the chart below. Given the services bias in the aforementioned PPI components, some upside pressure in PCE cannot be ruled out in the back half of the year.
A divergence worth watching
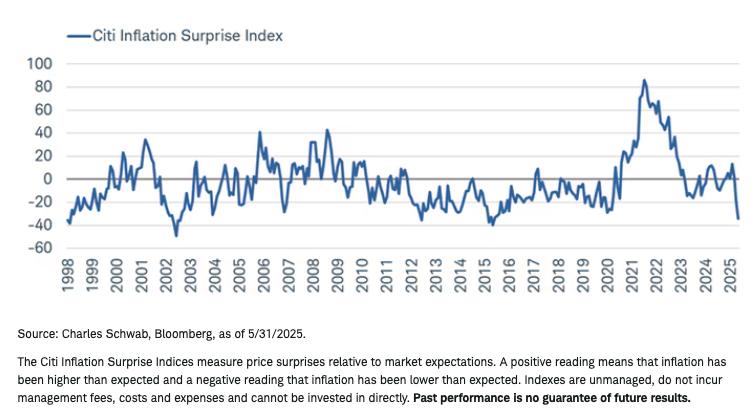
The latest batch of inflation readings has contributed to a significant plunge in the Citi Inflation Surprise Index (measuring how data is coming in relative to consensus expectations). It's also been an aid to the stock market, which tends to perform best when inflation is tracking lower-than-expected. Do notice though that the index oscillates, suggesting less likelihood of any further sustained downward moves—especially given heightened geopolitical tensions and the related surge in oil prices.
Surprise!
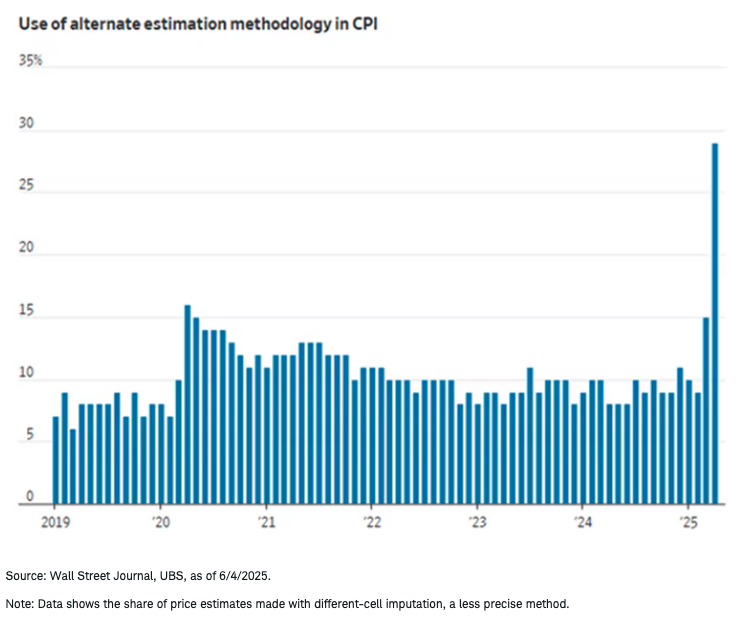
In general, inflation data have become increasingly difficult to analyze and even gather. When the April CPI was released, officials from the Bureau of Labor Statistics (BLS) mentioned that hiring freezes and staffing shortages led to an increased reliance on different-cell imputation—a method that bases price estimates on less comparable products or other regions of the country—much more so than in the past, as shown in the chart below.
This turns an even brighter spotlight on the issue of layoffs and hiring freezes across government agencies. The BLS also stated that it is no longer collecting consumer price data in: Lincoln, Nebraska; Provo, Utah; and Buffalo, New York. At the headline index level, the changes are likely to be minimal, per the agency; but volatility in month-to-month changes might pick up.
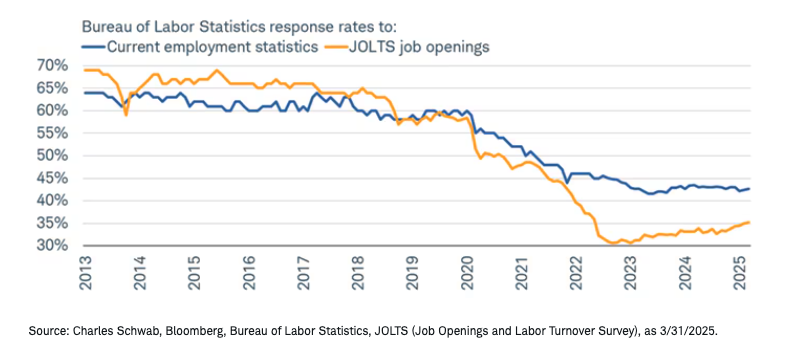
To some extent, more volatility has been "normal" in the post-pandemic world. As shown in the chart below, response rates for key labor surveys—such as nonfarm payrolls ("current employment statistics") and the Job Openings and Labor Turnover Survey (JOLTS)—have barely recovered since the epic drop during the pandemic, helping lead to large revisions in the post-pandemic era.
Responses coming in slowly
Clearly, the decline in response rates predated DOGE-related layoffs at the federal level, but the recovery likely won't be aided by the fact that agencies continue to face shortages (and perhaps more layoffs down the road). That will likely keep us in an environment of more volatile changes in economic data and larger revisions.
A walk down memory lane
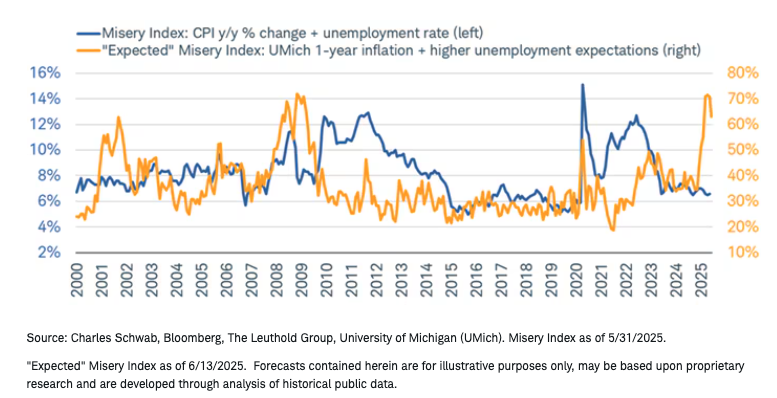
That reality might keep anxiety levels elevated among consumers feeling unstable about the inflation (and employment) backdrop. More "seasoned" readers may recall the Misery Index, created by economist Arthur Okun in the early 1970s. It was meant to capture the level of economic distress felt by the average person by adding the inflation rate to the unemployment rate.
Shown below, the actual Misery Index at present remains contained at less than 7%. But don't tell that to consumers surveyed as part of the Consumer Sentiment Index put out monthly by the University of Michigan. Although off its recent extreme peak, the "expected" Misery Index—which combines one-year inflation expectations with expectations for the change in the unemployment rate—recently spiked to an extreme reading.
Fear > reality
In sum
There was a record-breaking surge in imports in the first quarter, as companies and consumers attempted to get ahead of tariff increases. April brought with it a slump in imports—a natural and expected boomerang after the first quarter's surge. But April also brought with it a commensurate surge in tariff revenues, which sends a strong signal of tariff-related inflation yet to come. In addition, although there was a tariff front-running surge in imports in the first quarter, the inventory-to-sales ratio is not running hot, meaning there has not been an excess inventory build.
Assuming the economy continues to expand—and run near-or-above potential—upside inflation risk remains elevated. Adding to the upside risk is, of course, the trajectory of oil prices as it relates to the growing conflict with Iran. These risks could keep the Federal Reserve in its self-imposed "time out" in terms of interest rate policy, barring a significant deterioration in the labor market. Just as complacency can be a peril for stock market investors, it can also lend a false air of "nothing to see here" regarding to inflation ("complation").
A message from Advisor Perspectives and VettaFi: To learn more about this and other topics, check out some of our webcasts.
The information provided here is for general informational purposes only and should not be considered an individualized recommendation or personalized investment advice. The investment strategies mentioned here may not be suitable for everyone. Each investor needs to review an investment strategy for his or her own particular situation before making any investment decision.
All expressions of opinion are subject to change without notice in reaction to shifting market conditions. Data contained herein from third-party providers is obtained from what are considered reliable sources. However, its accuracy, completeness or reliability cannot be guaranteed. Examples provided are for illustrative purposes only and not intended to be reflective of results you can expect to achieve.
Past performance is no guarantee of future results, and the opinions presented cannot be viewed as an indicator of future performance.
Investing involves risk, including loss of principal.
The policy analysis provided by the Charles Schwab & Co., Inc., does not constitute and should not be interpreted as an endorsement of any political party.
Performance may be affected by risks associated with non-diversification, including investments in specific countries or sectors. Additional risks may also include, but are not limited to, investments in foreign securities, especially emerging markets, real estate investment trusts (REITs), fixed income, municipal securities including state specific municipal securities, small capitalization securities and commodities. Each individual investor should consider these risks carefully before investing in a particular security or strategy.
All corporate names and market data shown above are for illustrative purposes only and are not a recommendation, offer to sell, or a solicitation of an offer to buy any security.
Diversification and asset allocation strategies do not ensure a profit and do not protect against losses in declining markets.
Schwab does not recommend the use of technical analysis as a sole means of investment research.
Source: Bloomberg Index Services Limited. BLOOMBERG® is a trademark and service mark of Bloomberg Finance L.P. and its affiliates (collectively "Bloomberg"). Bloomberg or Bloomberg's licensors own all proprietary rights in the Bloomberg Indices. Neither Bloomberg nor Bloomberg's licensors approves or endorses this material or guarantees the accuracy or completeness of any information herein, or makes any warranty, express or implied, as to the results to be obtained therefrom and, to the maximum extent allowed by law, neither shall have any liability or responsibility for injury or damages arising in connection therewith.
Indexes are unmanaged, do not incur management fees, costs, and expenses, and cannot be invested in directly. For additional information, please see schwab.com/indexdefinitions.
The Charles Schwab Corporation provides a full range of brokerage, banking and financial advisory services through its operating subsidiaries. Its broker-dealer subsidiary, Charles Schwab & Co. Inc. (Member SIPC), and its affiliates offer investment services and products. Its banking subsidiary, Charles Schwab Bank, SSB (member FDIC and an Equal Housing Lender), provides deposit and lending services and products.
This site is designed for U.S. residents. Non-U.S. residents are subject to country-specific restrictions. Learn more about our services for non-U.S. residents, Charles Schwab Hong Kong clients, Charles Schwab U.K. clients.
© 2025 Charles Schwab & Co., Inc. All rights reserved. Member SIPC. Unauthorized access is prohibited. Usage will be monitored.