From Tariff Angst to Optimism
Membership required
Membership is now required to use this feature. To learn more:
View Membership BenefitsEconomic Headwinds Persist
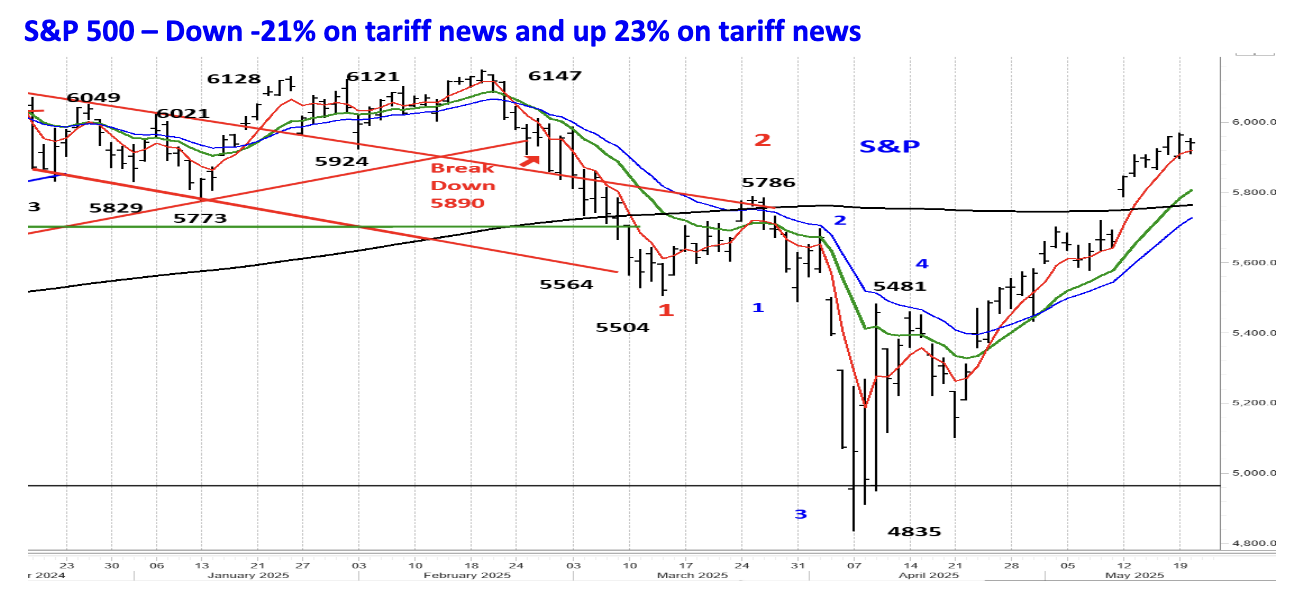
In the last three months tariff news has whipped financial markets around remarkably in response to President Trump’s ever changing tariff policies. The most pronounced reactions were concentrated in the US stock market. When President Trump increased tariffs on China to 10% on February 3, the S&P 500 shed -3.3% on February 4 only to recover and record a new all time high on February 19. The S&P 500 began to decline in early March as investors realized that President Trump was serious about increasing tariffs. On March 12 a 25% tariff was applied to aluminum and steel imports. After declining by more than -10.0% in less than a month, the S&P 500 established a short term low of 5504 on March 13. After a quick bounce to 5786 on March 25 the S&P 500 plunged after the President Trump hiked reciprocal tariffs on ‘Liberation Day’ on April 2. The S&P 500 bottomed on April 7 at 4835 and then rocketed to 5481 after President Trump announced he was pausing reciprocal tariffs for 90 days on April 9. Hours before the announcement President Trump posted ‘THIS IS A GREAT TIME TO BUY’ on his Truth social account.
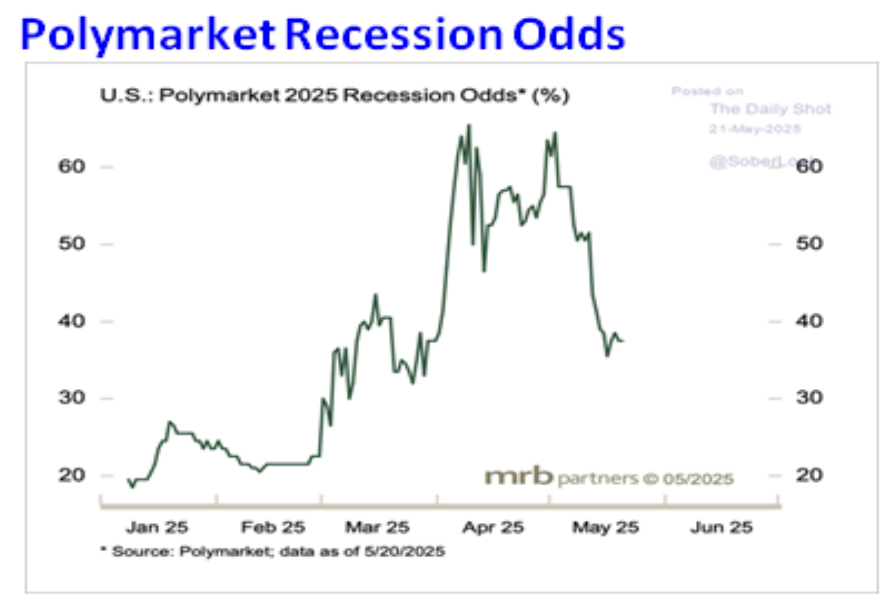
The roller coaster ride in the S&P 500 has mirrored investors’ views about the economy. Polymarket is an online prediction marketplace that tracks investors’ views of the economy. In January the odds of a recession beginning in 2025 was just 20%. In mid February and after the first tariffs were levied on February 3, the odds of a recession were 22%. As more tariffs were added in March the odds briefly ticked above 40%. But after the reciprocal tariffs were implemented on April 2, the odds of a recession spiked to 66% on April 8. As the trade rhetoric between the US and China escalated, the odds of a recession rebounded to 66% on May 1. On May 12 the US announced it would lower the tariff rate from 145% to 30% on China and China agreed to lower its US tariffs to 10%. The odds of a recession beginning in 2025 fell below 40%. On May 28 it was 40%.
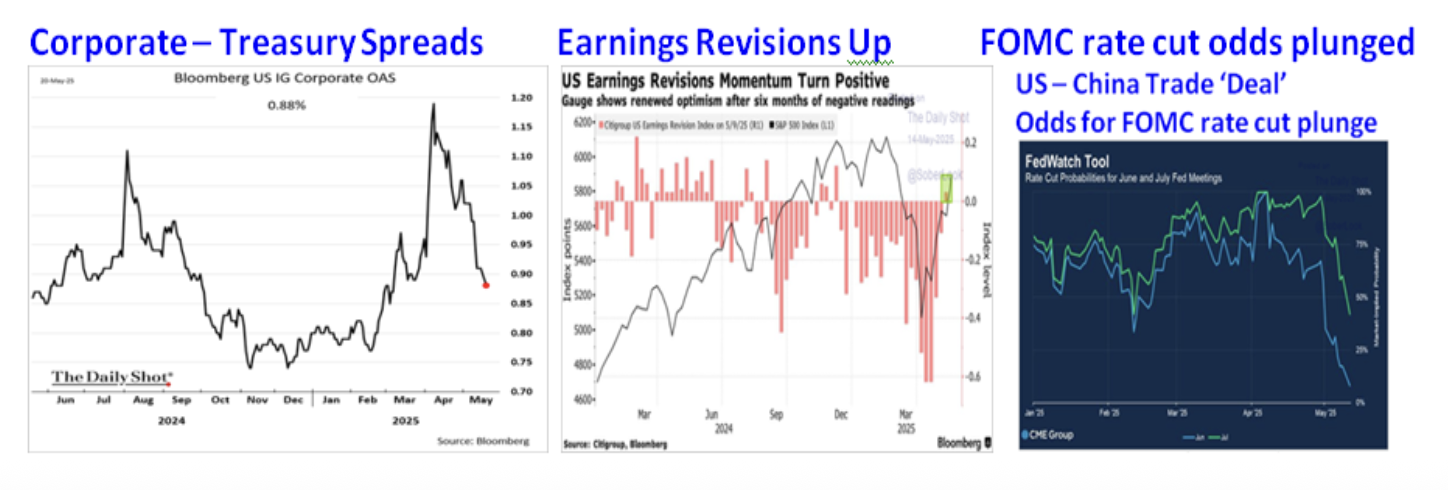
Traders in the prediction markets (Polymarket – Kalshi) aren’t the only ones betting that the risk of a recession starting in 2025 is far less of a worry now than when a Trade War seemed more certain. As the Trade War tariffs zoomed higher, US Investment Grade corporate bonds declined more than Treasury bonds, so the Spread widened as investors priced in a recession and corporate bond defaults. Once President Trump decided to lower the reciprocal tariffs for 90 days on May 12, Spreads narrowed considerably, although they aren’t as low as in January. Wall Street had lowered the estimate for earnings for 20 consecutive weeks, according to the Citi US Earnings Revision Index. Wall Street raised the estimate for earnings in 2025 for the weeks ending May 9 and May 16, which shows concerns about a recession have evaporated.
Such a dramatic positive reversal in the S&P 500, sharp narrowing of credit spreads, improved outlook for the economy and earnings must have been prompted by significant progress in the trade negotiations with most of the US’s major trading partners like Canada, Mexico, the European Union, and China. You would think so based on these charts, but Wall Street isn’t so discerning or demanding.
On May 8 and May 11 President Trump announced that the US had signed trade agreements with Great Britain and China. The stock market responded by rallying on May 8 after the ‘deal’ with Great Britain, but celebrated far more on May 12 after the China deal was announced. There is reason for relief since the ‘deals’ are really nothing more than an agreement to talk more, which is better than agreeing not to talk again.
The trade deal between the US and Great Britain was announced with great fanfare that included President Trump talking with Prime Minister Sir Keir Starmer from the Oval office. Both leaders dutifully praised the other and lauded the ‘Economic Prosperity Deal’ as a great achievement. It was a bit deflating when I read that “This document serves to define the general terms for the EPD that set forth the shared desires of the US and the UK... Both the US and the UK recognize that this document does not constitute a legally binding agreement." In effect the ‘trade deal’ with Great Britain represents nothing, since nothing has been defined other than 3 vague broad aspirations that amount to a weak bromide.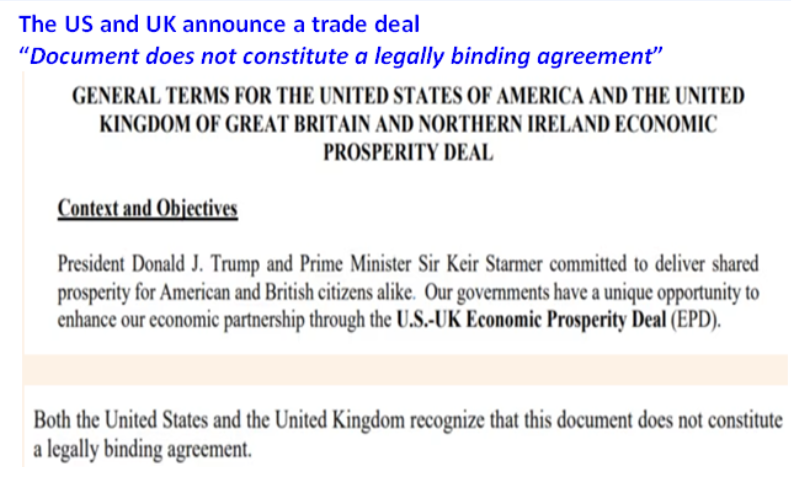
In 2024 the US imported $68 billion of goods from Great Britain and exported $79 billion of goods into Great Britain, so the US had a small goods trade surplus. In contrast, China exported $439 billion of goods to the US in 2024, while the US exported $143 billion to China which created a trade deficit with China of $296 billion. This is why the stock market responded with more enthusiasm to the trade deal with China than to Great Britain’s deal.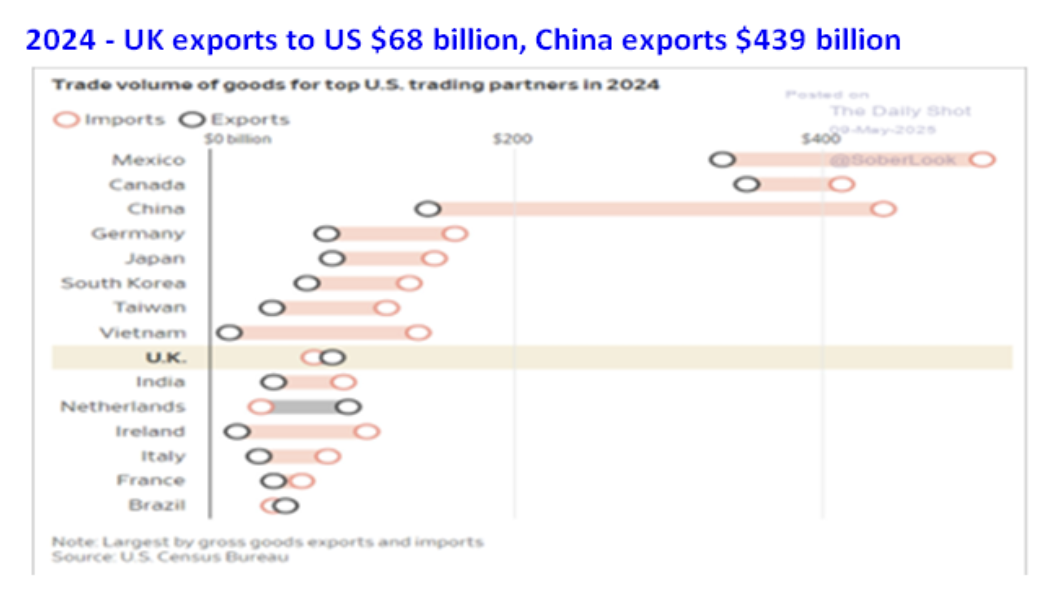
The US and China had economic reasons to lower the reciprocal tariffs each were charging. China has a level of economic dependence on the US since Chinese manufacturers make stuff and export those goods to the US. Since the US applied punitive tariffs of 145% on exports from China, 1,800 manufacturing firms have closed. China is still dealing with a real estate crisis that is contributing to an ongoing decline in Existing Home Prices that began in 2021. The average Chinese household has more of their wealth tied to home prices than any other country in the world. Consumer spending has been weak because consumer’s largest asset is deflating. To offset the drag from soft consumer spending, the Chinese government has boosted manufacturing and used exports as the driver for economic growth. As discussed in the November Macro Tides the US isn’t the only country that has been applying tariffs on exports from China. “The increased investment by China in Manufacturing has created excess capacity in China and Chinese producers are ‘dumping’ goods into the EU. The European Union (EU) has imposed tariffs of up to 35% on Electric Vehicles (EV’s) from China and the tariff is set to increase over the next 5 years. Two weeks ago India said it would impose a tariff of 30% on some Chinese steel products.”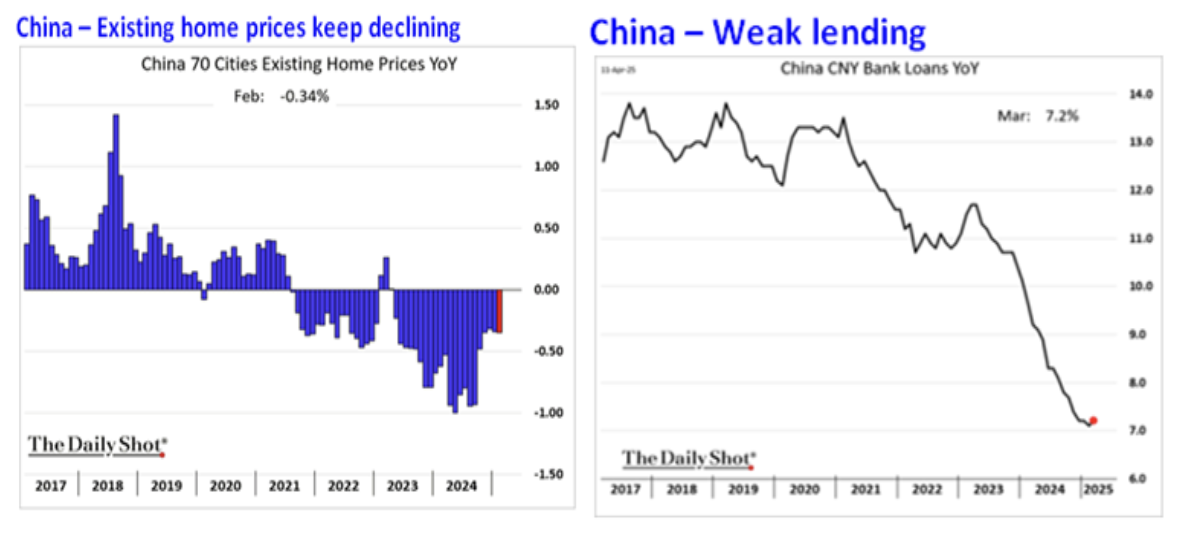
The decline in home prices and real estate and infrastructure construction has led to a significant drop in bank lending by Chinese banks. In March 2025 the annual growth rate in bank lending was 7.2% down from more than a 12% annual rate prior to the Pandemic in 2020. The decline in lending is contributing to a slowdown in China’s GDP growth. Youth unemployment was 16.9% in March and disenchantment with President Xi is growing within China.
President Trump was facing a number of issues including higher prices from tariffs, the potential for empty store shelves, and possible supply chain disruptions as noted in the May Macro Tides. “The Port of Los Angeles is the main port for goods coming from China. The number of ship arrivals from China in the week of May 4 will be down by more than 30% from 2024, and the number of containers coming from China were 45% lower than in mid April 2024. Inventories were increased as company’s front loaded orders prior to the tariffs. Once these inventories are depleted, the dramatic decline in goods flowing from China and other countries to the US will result in empty store shelves, if the Trade War lasts more than a month. For companies that import parts that are assembled in the US, a shortage of parts could develop that causes production lines to be shut down and workers are laid off.”
In the game of trade chicken the US and China had cards to play, but each country also had Achilles heel pressure points that made it economically unviable to maintain prohibitive tariffs. Taking a step backward on the level of tariffs doesn’t mean the US and China will be successful in hammering out the details of a comprehensive trade agreement in 90 days. For traders on Wall Street 90 days is almost a lifetime so buying on the news was the first choice.
As noted in the May 12 Weekly Technical Review, “Investors are not paying attention to the lack of detail in the ‘trade deals’ with Great Britain and China and assume more progress will be made with other countries too. The biggest worry was that the Trade War would continue causing a large spike in inflation, supply chain shortages, and ultimately a recession. Those worries are gone temporarily, so in the short run there is no reason to sell stocks, since I don’t think the economy is going to slow enough in coming weeks to resurrect recession worries. Inflation will tick higher in coming months but the initial uptick when the June CPI is reported in mid July will be brushed off since inflation was expected to move higher. Investors will pay attention after inflation moves up for 3 consecutive months, but that’s not likely until the July CPI is reported in mid August.”
No All Clear for the Economy
Financial markets accepted the trade deals as an indication that the damage to the US economy from tariffs will be minimal and the willingness to talk more ensures a good outcome. That would be great but the devil is in the details and no details have been worked out in the ‘trade deals’ with Great Britain and China. More trade deals with other countries will be announced in coming weeks and won’t contain more detail beyond an Agreement in Principle to talk more.
There are a number of headwinds that will slow the economy in coming months. Even with the rollback of the onerous reciprocal tariffs that had raised the Effective Tariff Rate to 26%, the US’s effective tariff rate is 13.0% and the highest since 1934, according to the Yale Budget Lab. This rate is more than 6 times higher than the 2.0% tariff rate at the beginning of 2025. Inflation will be lifted by the tariffs just less than they would have been had the reciprocal tariffs been maintained. President Trump has indicated a willingness to increase tariffs on countries that are unwilling to negotiate a trade deal. On May 23 President Trump hit the EU with a 50% tariff since ““Our discussions with them are going nowhere!” The 90 day tariff suspension is over on July 9, so there is a risk that the Effective Tariff Rate could increase again if trade ‘deals aren’t achieved.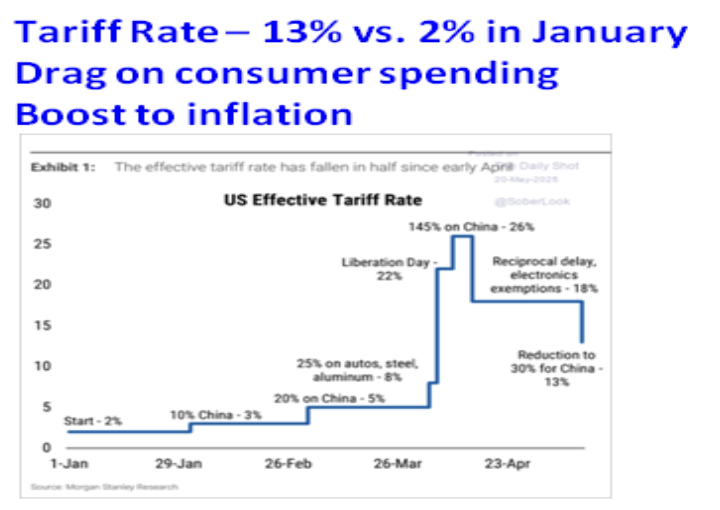
Lowering the Effective Tariff Rate is a step in the right direction, but it really doesn’t lower the level of uncertainty that consumers and businesses are facing. As discussed in the May Macro Tides CEO’s have lowered the amount of investments and hiring they expected to do in 2025 since January. “The level of uncertainty has increased dramatically since January as President Trump’s tariffs went from promised to reality. A recent survey of CEOs found that their plans for Capital Spending (investment), Hiring, and the outlook for profits have soured. In January, 56% of CEO’s planned to increase investment spending but in April that was down to 26%.”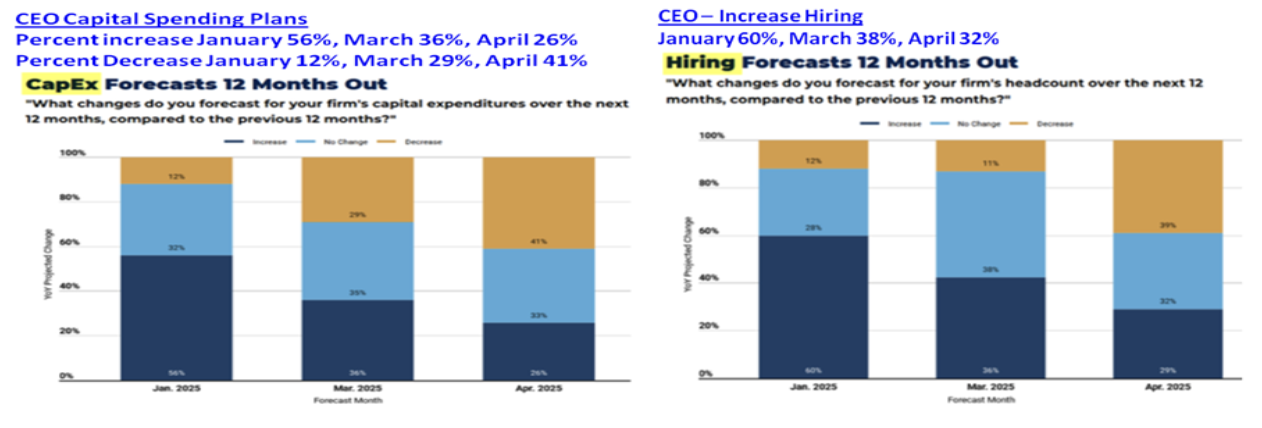
“It is one thing for CEOs to lower expected capital spending from the budgeted amount, but quite another to cut spending from planned levels. In January just 12% of CEOs expected to cut investment spending, but by April that had increased to 41%. In January 60% of CEOs planned on hiring more workers in 2025, but in April that was down to 32%. In January 76% of CEOs expected their profits to increase but by April that was down to 37%. This suggests many CEO’s don’t think they will be able to pass along the cost of tariffs by raising their prices, which will squeeze profit margins.”
As Walmart CFO John David Rainey explained on May 15, Walmart plans to raise prices this month and early this summer, as tariff-affected merchandise hits store shelves. “The magnitude and speed at which these prices are coming to us is somewhat unprecedented in history.” President Trump has rolled back tariffs on China from 145% and to 30% and 10% for other countries. As CEO Doug McMillon said, "But even at the reduced levels, the higher tariffs will result in higher prices.” President Trump has insisted that American consumers won’t be paying for the tariffs and didn’t appreciate the dose of reality Walmart delivered. On his Truth Social platform he offered this advice. “Walmart should STOP trying to blame Tariffs as the reason for raising prices throughout the chain. Walmart made BILLIONS OF DOLLARS last year, far more than expected. Between Walmart and China they should . . . EAT THE TARIFFS, and not charge valued customers ANYTHING. I’ll be watching, and so will your customers!!!” For the quarter ending April 30, 2025 Walmart’s net profit was 2.75%, so they won’t be able to eat much!
CFO John Rainey noted, “We’re wired to keep prices low, but there’s a limit to what we can bear, or any retailer for that matter.” Walmart has tremendous leverage to get the lowest price possible from their suppliers. The majority of other retailers don’t have Walmart’s pricing clout so many retailers will be more pressured than Walmart to increase prices. On May 21 Walmart announced it would lay off 1,500 corporate jobs in order to trim expenses and a spokeswoman said, “The layoffs reflect a focus on business priorities and our growth strategy, and are not related to tariffs.” It will be interesting to see how many other retailers decide to lay off workers as they look to cut costs due to the higher cost of tariffs.
In an interview on April 24, Cleveland Federal Reserve President Beth Hammack said that some companies are resorting to gradual price increases since they don’t know how much tariffs will go up, and they want to avoid a single large price increase. She also noted that some firms who rely on domestic producers and aren’t facing tariffs are increasing prices since some of their competitors who are facing tariffs are raising prices. “That certainly would be the type of environment where the tariffs could be more inflationary rather than just a one-time increase of the price level.” This could become an important inflation dynamic that the FOMC will monitor in coming months and delay how quickly they lower the Funds rate.
Walmart said there would be some price changes before the end of May but CFO John Rainey said price will increase much more in June. Roughly 150 million American consumers shop at the 4,606 Walmarts every week, so the price increases will have a broad impact. The timing of the tariff induced inflation is not good since the takeaway values from May, June, July, and August of 2024 are low. The four month average takeaway value for the Headline CPI is 0.14% and 0.21% for the Core CPI. The average takeaway values for the Personal Consumption Expenditures Index (PCE) for May through August are lower. The Headline PCE is 0.09% and 0.12% for the Core PCE. These low takeaway values will make it likely that annual CPI and PCE inflation will increase in coming months by 0.30% or more. Investors won’t be rattled immediately since everyone except President Trump knows the tariffs will increase consumer prices with the only question being how much.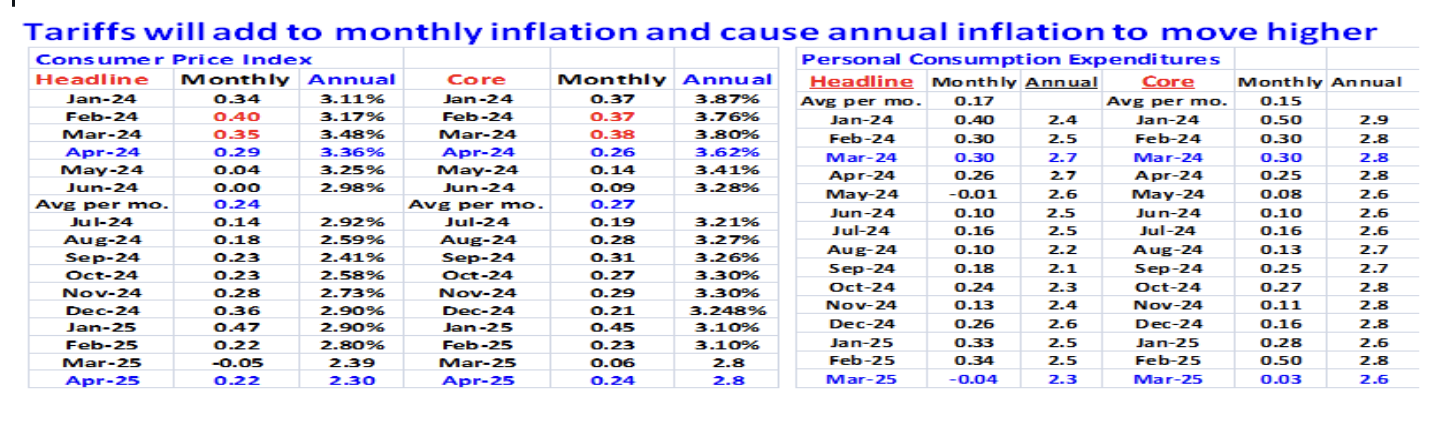
FOMC
Just like consumers and businesses, members of the FOMC are dealing with persistently high uncertainty that will result in no changes in the Federal funds rate at the June and July FOMC meetings. In an interview on May 19 Atlanta Fed President Raphael Bostic said, “The economy is in a lot of flux, policy is in flux, there’s a lot of uncertainty. I think we’ll have to wait three to six months to start to see where this settles out. Given the trajectory of our two mandates, our two charges (stable prices, maximum employment), I worry a lot about the inflation side, and mainly because we’re seeing expectations move in a troublesome way.” In January consumers thought inflation would be 2.8% in 2025, but as President Trump ramped tariffs up in February and March that changed. In May consumer’s 1-year inflation expectations soared to 7.3%, according to the University of Michigan’s consumer confidence survey. FOMC members pay attention to inflation expectations since they believe inflation will become sticky as consumers change their buying behavior in anticipation of higher inflation.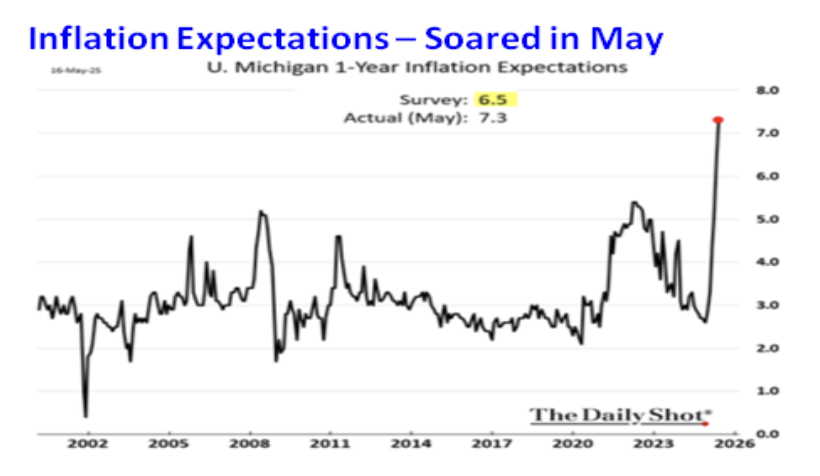
In his presentation on May 19 at the Atlanta Fed’s 2025 Financial Markets Conference, Fed Vice Chair Philip Jefferson also emphasized a wait-and-see approach “Given the level of uncertainty that we’re facing right now, I believe that it is appropriate that we wait and see how the policies evolve over time and their impact.” Jefferson said the FOMC can afford to wait since monetary policy is in “very good place.” Philip Jefferson’s comments mirrored those of San Francisco Fed president Mary Daly who on May 15 said, “If you take a step back from all the tariff uncertainty, the underlying economy is experiencing solid growth, with a strong labor market and declining inflation.” On May 19 New York Fed president John Williams addressed the Mortgage Bankers Association and said the high level of uncertainty was affecting businesses, households, and his outlook. “It’s going to be a process of collecting data, getting a better picture, and watching things as they develop.” Williams said the FOMC can take its time with inflation coming down and the labor market near full employment, although he said he’s monitoring consumer spending and consumer delinquencies.
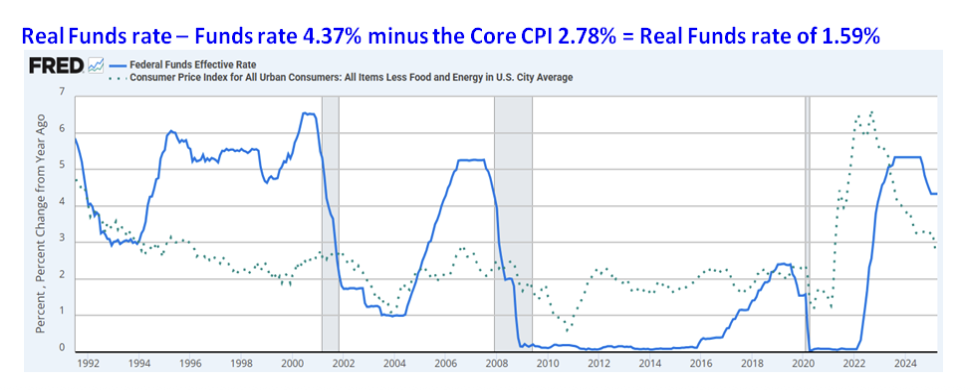
The FOMC is unlikely to lower the Funds rate when they meet on June 18 and July 30, but could act at the September 17 meeting, if there is less uncertainty, or if the Unemployment Rate is moving higher as the economy slows. The reality is there is no way on June 1 to know. One thing we do know is that the longer the FOMC holds the Funds rate at 4.375%, monetary policy is modestly restrictive. By subtracting the level of the Funds rate from the Core CPI, the Real Funds rate is determined. In April the annual Core CPI was 2.78% so the Real Funds rate is 1.59%. In order to determine the level of monetary restraint I divide the Funds rate by the Real Funds rate to create a relative percent. This allows us to compare the current level of tightness to prior periods so the current level of tightness can be put into perspective.
Dividing the current Real Funds rate (May 2025 1.59%) by the Funds rate (May 2025 4.37%) shows the current level of monetary tightness is 36.4%. Prior to the first rate cut in September 2024 the degree of tightness was 38.7%. Although the FOMC lowered the Funds rate from 5.37% in August 2024 to 4.37% in May 2025, the Real Funds rate declined proportionately from 2.08% to 1.59%. The current level of restraint 36.4% is significantly less than it was in 2007 (55.8%), 1989 (50.4%), and 1981 (49.2%).
If the annual Core CPI increases by 0.30% (from 2.78% to 3.08%), the level of restraint will fall from 36.4% to 29.5%. The FOMC will refrain from lowering the Funds rate until the Unemployment Rate moves higher.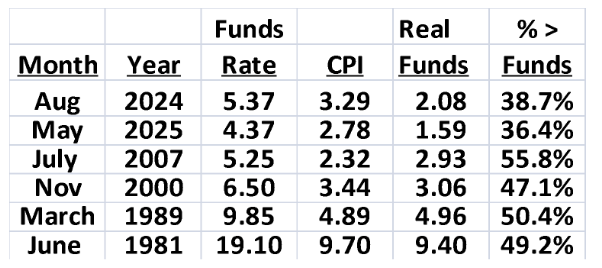
Chairman Alan ‘Maestro’ Greenspan
The other important observation is recognizing how accommodative monetary policy was after 2001 (Chart above). After World War II and until 2001, the FOMC managed the business cycle by maintaining a Real Funds rate continuously with only brief periods during recessions in which the Funds rate was negative. That changed in 2001. The Real Funds rate was negative from 2001 through 2022 other than the window of time in 2005 through 2007 (and for a few months in 2018) that the Funds rate (blue line) was above the Core CPI (dots). This indicated that traditional monetary policy had lost its effectiveness since the FOMC was unwilling to reestablish a Real Funds rate.
The FOMC kept the Funds rate negative from 2001 through the first half of 2005 to stimulate the economy. By keeping the Funds rate so low for so long, the seeds for the Housing Bubble were sown as borrowers could access cheap mortgages available with Adjustable Rate Mortgages (ARMs). The access to low rate ARMs continued even as the FOMC hiked the Funds rate to 5.25% in 2005, with ARMs representing more than 50% of all new mortgages. Low lending standards amplified the impact of ARMs as unqualified borrowers ‘qualified’ for mortgages they would become delinquent on once the Adjustable rate was reset in 2007 and 2008. The Federal Reserve did a poor job on monitoring the lending practices of banks and the investment banks that proceeded to sell sub-prime mortgages to institutions seeking income, while their balance sheets were leveraged 26 to 1. The rating agencies were complicit as they slapped AAA ratings on the mortgage pools for a handsome fee.
The collapse in housing prices ignited the Financial Crisis in 2008 and further shaped monetary policy. The FOMC launched Quantitative Easing in 2008 to manipulate long term Treasury yields down, since a negative Real Funds rate was deemed inadequate to foster growth. The FOMC included Mortgage Backed Securities (MBS) in the Quantitative Easing program in order to support housing prices. The Federal Reserve’s balance sheet ballooned from $700 billion in 2007 to almost $9 trillion in 2022. In May 2025 it is down to ‘just’ $6.7 trillion.
In 2001 Federal Reserve Chairman Alan ‘Maestro’ Greenspan made a fateful decision in how the Federal Reserve would conduct monetary policy based on how he and the Fed had handled the October 19, 1987 Crash in the stock market and the repercussions from Long Term Capital Management’s implosion in August 1998. In both instances the FOMC quickly cut the Funds by 0.75%, and in 1987 the FOMC enlisted corporations to buy their own stock the day after the S&P 500 and DJIA plunged by more than -22% in a single day. As the Dot.com bubble blew up in 2000 – 2002, the Federal Reserve didn’t increase margin requirements and instead allowed the bubble to expand. Chairman Greenspan calculated that the Fed would be able to handle the fallout once the bubble popped. The FOMC slashed the Funds rate from 6.5% in December 2000 to 3.65% in August 2001. After 9-11 sent a shock wave through the economy the FOMC lowered the Funds rate to 1.75 in December 2001.
Slashing the Funds rate did stabilize the economy although the S&P 500 didn’t bottom until March 2003 after dropping by more than -30% from its level in December 2001. More importantly, the philosophy of allowing imbalances to develop and then addressing them as they unraveled set a dangerous precedent and pattern. Dealing with the Dot.com bubble then sowed the seeds of the housing bubble in 2006, which proved catastrophic. The unwinding of the Dot.com bubble didn’t threaten the banking system or the economy as the decline in home values did in 2008. The magnitude of the Financial Crisis then pushed the Federal Reserve to launch Quantitative Easing to stabilize the financial system and the economy.
In response to the Pandemic the FOMC slashed the Funds rate to 0.12% and aggressively expanded its balance with another round of QE. This response to the Pandemic was appropriate, but holding the Funds rate at 0.12% throughout 2021 as inflation percolated and continuing to buy Mortgage Backed Securities in 2022 as housing prices soared was a gross mistake. The Fed’s response along with other factors have caused housing affordability plunge so the average family can’t afford to buy a home. Home prices will suffer another period of depreciation in coming years since that’s what’s needed to improve affordability. Will that create another set of problems? Yes, but not as horrific as in 2008.
Chairman Greenspan’s decision in 2001 to be reactive rather than proactive resulted in unintended consequences that led to more imbalances and more extreme monetary reactions. Since the late 1990’s reactive monetary policy has created the Dot.com bubble, two housing bubbles, nosebleed valuations in the stock market, and facilitated historic annual federal budget deficits and an unsustainable increase in Federal Debt since 2001.
Arguably the largest beneficiary of the Federal Reserve’s reactionary monetary policy was Congress. After 2008 the Federal Reserve’s Quantitative Easing could be counted on to buy Treasury debt and keep the cost of borrowing down. Total Federal Debt includes debt held by intra-government agencies and includes the Social Security Trust fund, while publically held debt is owed to individuals, corporations, foreign governments, and entities outside the federal government. Total Federal Debt is $36.2 trillion and publically held debt is $28.9 trillion. The chart below is of publically held debt.
In 2001 there was $3 trillion is publicaly held debt and in 2007 it totaled $5.8 trillion. Since 2007 publically held debt has soared to $28.9 trillion as the FOMC conducted a number of Quantitative Easing programs in response to the Financial Crisis in 2008 and the Pandemic in 2020. Since 2001 debt has increased by 724% driven by an increase of 267.6% in government spending as GDP grew 184.5%. Treasury Secretary Bessent has said that federal debt can’t keep growing faster than GDP and that the present trajectory is unsustainable. I’ve described this problem as trying to gain weight by eating ones leg.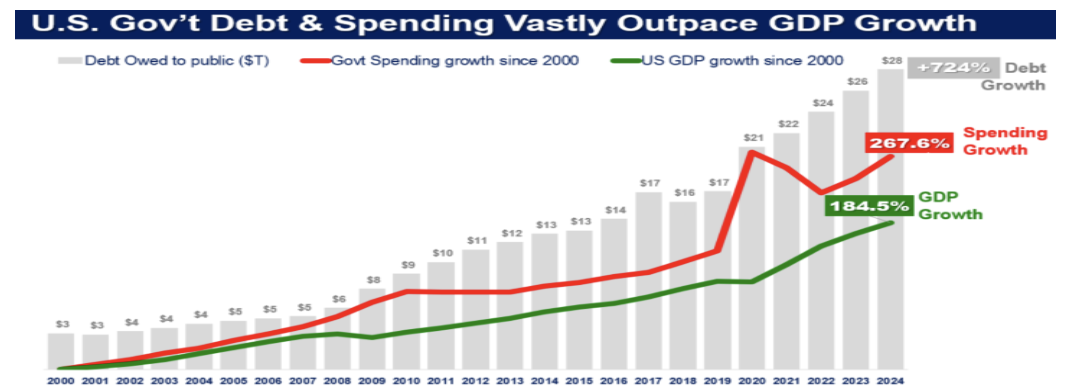
Outstanding debt surged after the 2008 Financial Crisis but annual interest expense remained contained as the FOMC kept the Funds rate low and QE buying kept longer term Treasury yields suppressed. The almost free lunch ended when inflation surged in 2022 and the FOMC was forced to increase the Funds rate from 0.12% to 5.37% in 2023. Interest expense has exploded from $425 billion in 2015 to $1.1 trillion, which was more than what the federal government spent on defense in 2024. As debt issued prior to 2020 comes due, interest expense will increase more. Over the next 19 months almost $13 trillion of existing government debt will come due on top of new budget deficit debt is issued by the end of 2026.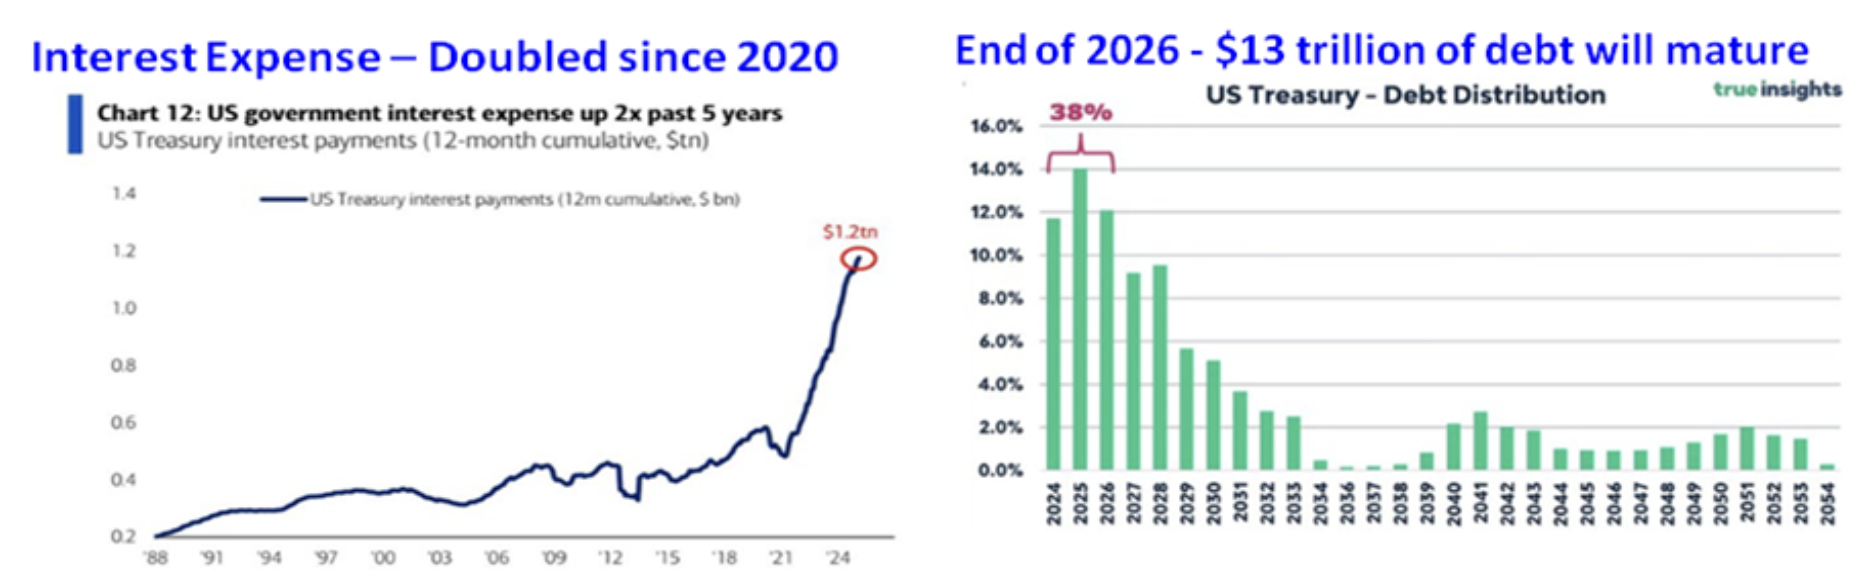
There are numerous headwinds facing the US economy and they can be expected to slow growth in coming months. The cloud of uncertainty created by President Trump’s tariffs will remain, even though the Court of International Trade on May 28 blocked the legal justification for the reciprocal tariffs under the International Emergency Powers Act of 1977. The ruling will upend trade discussions and postpone a resolution until higher courts decide if the Court of International Trade’s decision is upheld or not. The imported goods that have already been tariffed will lift inflation in the next few months, but the increase will be more modest as everyone waits for the courts to determine the fate of the tariffs. The roadblock created by the Court of International Trade won’t stop President Trump from finding other ways to generate tariff income since he expects tariff income will narrow the budget deficit.
Consumers and businesses rushed to buy before the tariffs were implemented so there is a dip in demand coming that will weigh on growth. The uncertainty about tariff levels and potential inflation will continue to keep the FOMC from lowering the Funds rate so monetary policy will be restrictive for longer.
On May 5 the Federal Student Aid program will require that 42.7 million people with a student loan begin making payments again. Payments were paused during the Pandemic and then extended by President Biden through October 31, 2024, and coincidently just prior to the election on November 5, 2024. Only 38% of those with a student loan are current with their payments, while 5 million people are already in default since they haven’t made a payment in more than a year. Another 4 million haven’t made a payment in the last 180 days and are in default. At the end of 2024 $250 billion of the $1.6 trillion of student loans was delinquent.
Notices to those delinquent went out on May 5 which explains how serious the government is in collecting the money owed. Rather than forgiveness the federal government can now seize tax refunds through the Treasury Offset Program, garner up to 15% of Social Security benefits, and collect up to 15% of a person wages.
The New York Federal Reserve reported in May that the student loan delinquency rate jumped from 0.7% in the fourth quarter to 8.0% in the first quarter of 2025. The credit scores for those delinquent have tanked by 177 points for prime borrowers (credit scores over 720) and 140 points for near prime borrowers (credit scores above 620). Roughly 2.5 million in default already had subprime credit ratings, so their scores couldn’t drop much further. Those whose credit scores are dinged due to a student loan delinquency will find it harder and more expensive to get a credit card, auto loan, or mortgage. Morgan Stanley estimates that the restart of student loan payments could redirect $1 billion to $3 billion of consumer spending a month from other categories and shave 0.1% from GDP growth in 2025. The economic drain from student loan repayments is far from catastrophic but still another headwind for the economy.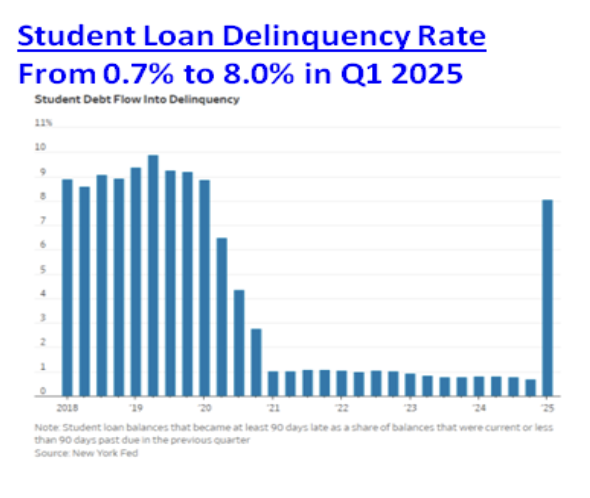
Despite all the headwinds, in the short term the odds of a recession taking hold before the end of the third quarter are low given anecdotal evidence. Over the Memorial Day weekend more than 3 million travelers passed through TSA check points, which was 20% more than in 2019 and before the Pandemic curbed consumers’ willingness to fly as well as during the recovery in 2023 and 2024. Millions of moviegoers flocked to watch a movie during the Memorial Day weekend and an all-time record $322 million was spent in the process. Consumers are worried about tariffs and how they might impact the economy, but those concerns didn’t keep them from traveling or taking in a movie. The upbeat mood was reflected in the Conference Board’s Consumer Confidence report for May, which showed confidence jumped from 85.7 in April to 98.0 in May. No doubt President Trump rolling back his reciprocal tariffs and the excessive tariffs on China contributed to the sentiment shift.
Proposed House Budget
Treasury Secretary Bessent has repeatedly said one of the goals of President Trump’s Administration is to lower the annual budget deficit from more than 6% of GDP in 2024 to 3% in 2028 with a combination of spending restraint and growth. “There’s two parts to this. It’s accelerating the economy growing the revenue base and controlling expenses. In the U.S. we do not have a revenue problem, we have a spending problem.” Is his assessment about spending being the problem accurate?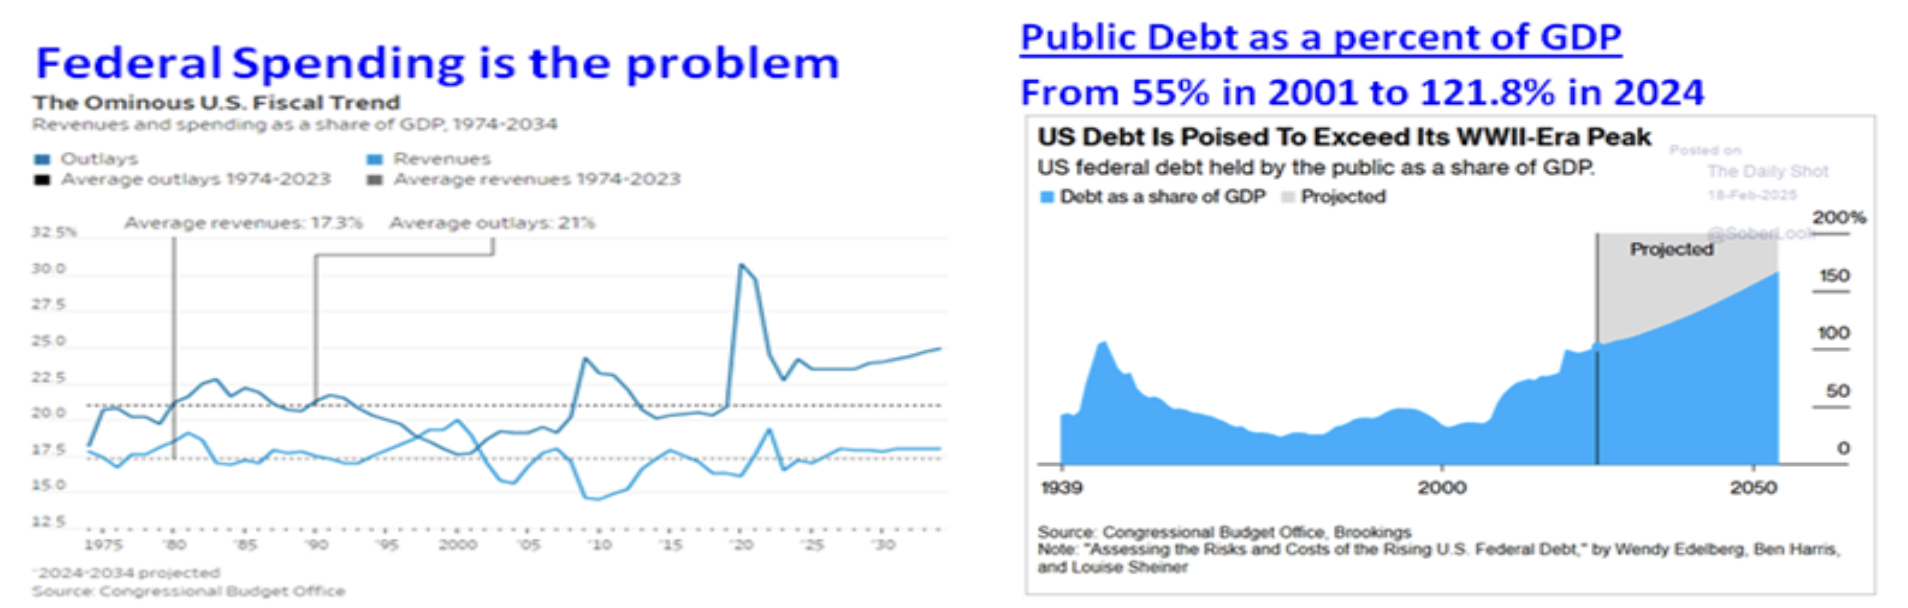
In 2024 federal spending represented 24.0% of GDP and well above the 50 year average of 21.0%, while revenue was 17.2% of GDP a mere 0.1% below the 50 year average. The trajectory of Federal debt is unsustainable and is being propelled by spending, so Treasury Secretary’s assessment is accurate. The other concern is that the Public debt to GDP ratio has exploded from 55% in 2001 to 121.8% at the end of 2024 and near the World War II high.
In a recent interview Treasury Secretary Bessent discussed the Public Debt to GDP ratio. “The debt numbers are indeed scary, but Secretary Yellen and I both agree that it is the debt-to-GDP that is the important number so we are trying to control both the absolute level of debt, pay it down, but also grow the GDP. What is important is that the economy grows faster than the debt. If we change the growth trajectory of the country, of the economy, then we will stabilize our finances and grow our way out of this. Deregulation is the slowest moving part. I would expect that to substantially kick in to our economic growth in the third and fourth quarters, and really accelerate next year.”
In his confirmation hearing Treasury Secretary Bessent said extending the 2017 Tax Cuts was the key to keep the economy growing. “As we begin 2025, Americans are barreling towards an economic crisis at year's end. If Congress fails to act, Americans will face the largest tax increase in history, a crushing $4 trillion tax hike. We must make permanent the 2017 Tax Cuts and Jobs Act and implement new pro-growth policies to reduce the tax burden on American manufacturers, service workers, and seniors.” If taxes were increased in 2026 by $4 trillion the economy would weaken materially. The extension of the 2017 tax cuts isn’t a new tax cut but a continuation of current tax policy.
A few weeks ago as the Republicans in the House were working on the 2025 Budget Bill, Treasury Secretary Bessent stated the obvious when it comes to Congress’s level of fiscal discipline.“This is the last chance bar and grill to get this done. Everyone knows what they should do. It’s, do they have the willpower to do it?” Last week the Republicans nudged the 2025 budget bill through the House with a margin of 215-214. The budget bill is 1,116 pages long and entitled “One Big Beautiful Bill Act”or OBBBA.
According to analysis by JP Morgan the bill as it is written today will increase the budget deficit by $481 billion in fiscal 2026 and $590 billion in fiscal 2027, and will increase outstanding debt by $3.8 trillion over the next ten years. If one of the goals is to reduce the annual budget deficit from more than 6% of GDP to 3%, the budget bill is a failure since spending and the deficit will increase in 2026 and 2027. The deficit will increase since the 2017 Tax Cuts will be extended. If addressing the unsustainable increase in federal debt as a percent of GDP is critical, the 2025 budget bill as it is written shows a pathetic lack of will power.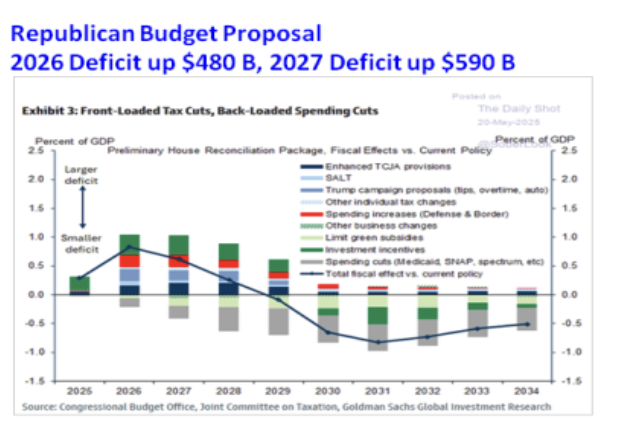
The bill will make good on a number of President Trump’s campaign promises. For the years 2025 through 2028, tip income will be deductible, auto loan interest will be deductible, will increase the standard deduction for seniors by $4,000, and make overtime earnings deductible. If these tax breaks were extended through 2034, outstanding debt would increase by $5.3 trillion, according to the Bipartisan Policy Center. Adding credibility to the estimates for an increase in outstanding debt is a proposed $4.0 trillion increase in the debt ceiling that is included in the reconciliation bill.
The bill does lower spending relative to the projected spending increases in the next 10 years in Medicaid and the Supplemental Nutrition Assistance Program, or SNAP. The budget bill will NOT cut spending on Medicaid, but it will lower the rate of growth relative to the 10-year spending baseline. Spending on Medicaid will increase by $1.6 trillion over the next decade, so those saying spending will be cut are being disingenuous. States will be required to verify that those on Medicaid are still eligible and will reduce funding to states that offer coverage to those in the US illegally (1.4 million). Those who are able bodied will be required to work or volunteer. This provision is estimated to save $300 billion over the next 10 years. President Biden loosened the rules for eligibility and the bill would revert to the rules that were in place before the change. This is expected to save $162 billion. These changes will save $462 billion of the $6 trillion the federal government will spend on Medicaid in the next 10 years.
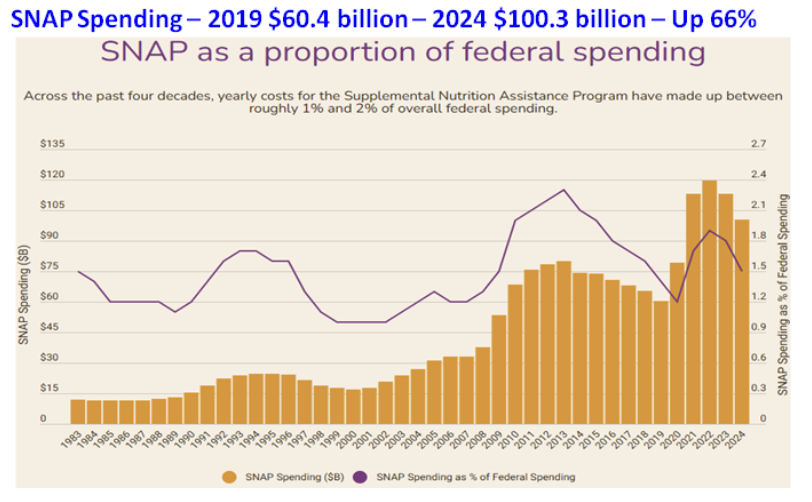
In 2024 the Federal government spent $100.3 billion on the Supplemental Nutrition Assistance Program (SNAP) for 42.1 million people receiving an average benefit of $188.00 per month. SNAP spending has increased from $60.4 billion in 2019, and has increased by more than 65% in five years. To qualify for SNAP benefits a household typically must be at or below 130% of the federal poverty line, which is $33,600 for a family of three. The budget bill tightens the existing work requirements for the Supplemental Nutrition Assistance Program by increasing the age from 54 to 64 for able-bodied people who must work at least 80 hours a month or volunteer to receive SNAP benefits. Currently, able bodied people between the ages of 25 – 54 can receive SNAP benefits and aren’t required to work. For many healthy recipients the SNAP program is literally a free lunch with no strings attached. The legislation would include $92 billion in estimated spending reductions from work requirements, and $128 billion in reduced federal spending by shifting more program costs to states, according to the CBO.
The budget bill passed by Republicans in the House now heads to the Senate and it will be changed as a number of conservative Republicans believe government spending needs to be cut more. Overriding the discussion is the awareness that the mid-term elections in November 2026 are only 19 months away and the Republican’s hold on the House is razor thin and the margin in the Senate is 6 seats. If the parties were reversed, the Democrats would feel the same political pressure.
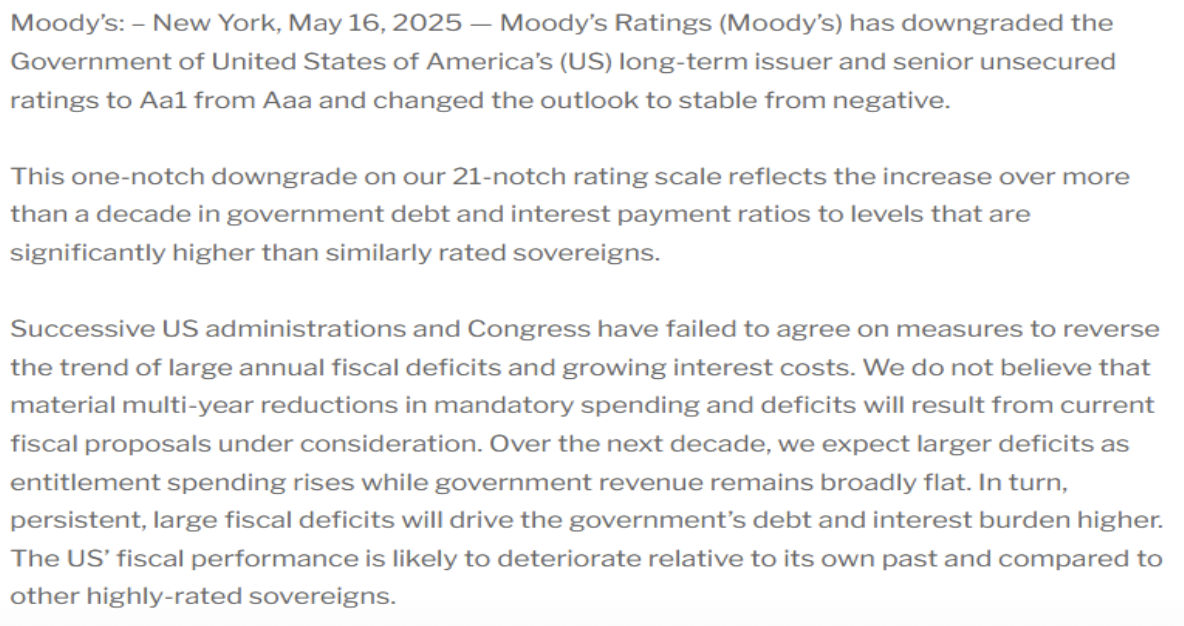
In the current era of Political Polarization the only thing we can be sure of is both parties would rather fight each other than make tough decisions that would be in the best interest of the country. It’s easy to cut taxes and spend money, but nearly impossible to be fiscally responsible. This is why Moody’s downgraded the US’s debt rating as their statement highlighted.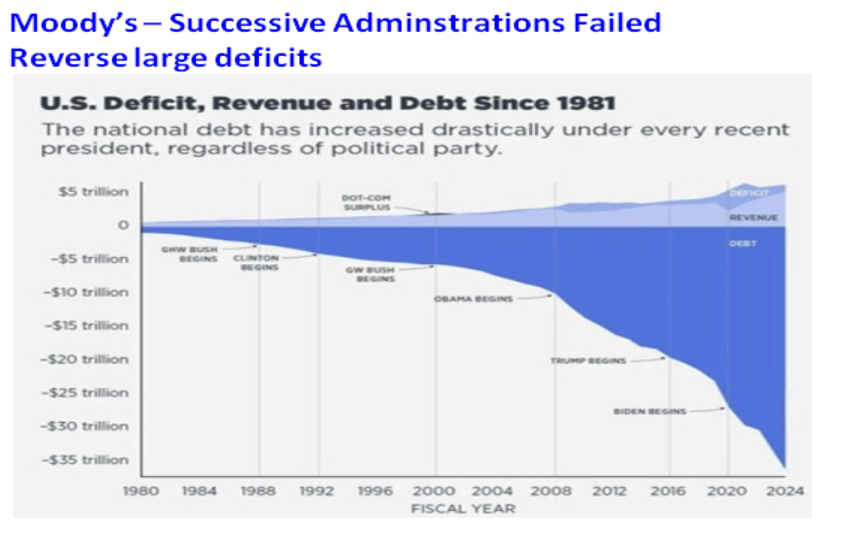
Treasury Yields
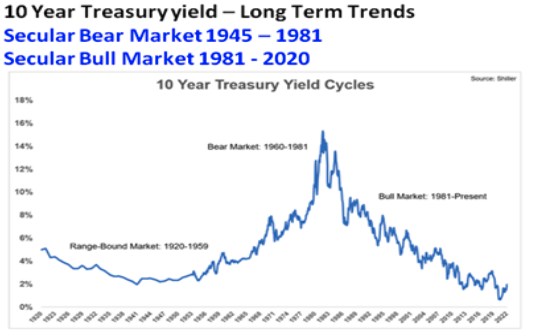
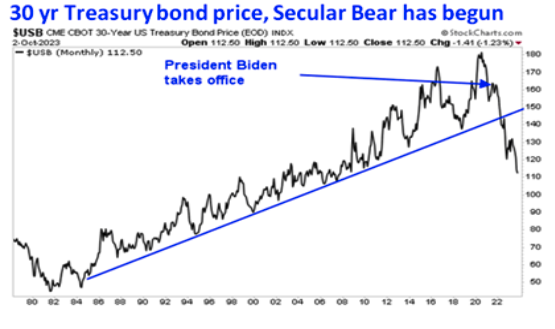
The explosion in federal debt in the last 20 years and the inability of Congress to make any progress in shrinking the annual deficit suggests the Treasury market could struggle in coming years as a tsunami of Treasury debt pushes Treasury yields higher. Over the long term Treasury yields have spent many years going up and many years when they have declined. For instance, the 10-year Treasury yield bottomed in 1945 at 2.0% and began a trek higher that didn’t end until 1981. This Secular Bear Market lasted 36 years. After inflation peaked in 1981 Treasury yields began a Secular Bull Market that didn’t end until March 2020 39 years later. After bottoming at 0.40% in March 2020 the 10-year Treasury yield jumped to 4.97% in October 2023, which represented a huge decline in the price of 10-year Treasury bonds. The breakdown in Treasury bond prices is especially clear on the chart of the 30-year Treasury bond. In 2022 the price of the 30-year Treasury bond smashed below the rising trend line from the lows in 1981. The upside breakout in the 10-year Treasury yield and breakdown in the price of the 30 year Treasury bond prices suggests that a new Secular Bear Market in Treasury bonds has begun. Given the length of the last two Secular trends the new Secular Bear Market could endure for more than 30 years. Just as the Secular Bull Market from the low of 1981 experienced sharp declines, the coming Secular Bear Market will experience large rallies before the down trend in bond prices and uptrend in yields resumes.
The 10-year Treasury yield has been locked in a trading range since October 2023 when the 10-year yield topped at 4.997%. If the analysis that a new Secular Bear Market began in March 2020, it’s not if the 10-year yield will break out above 4.997% but when.
10-year Treasury yield – Trading range since October 2023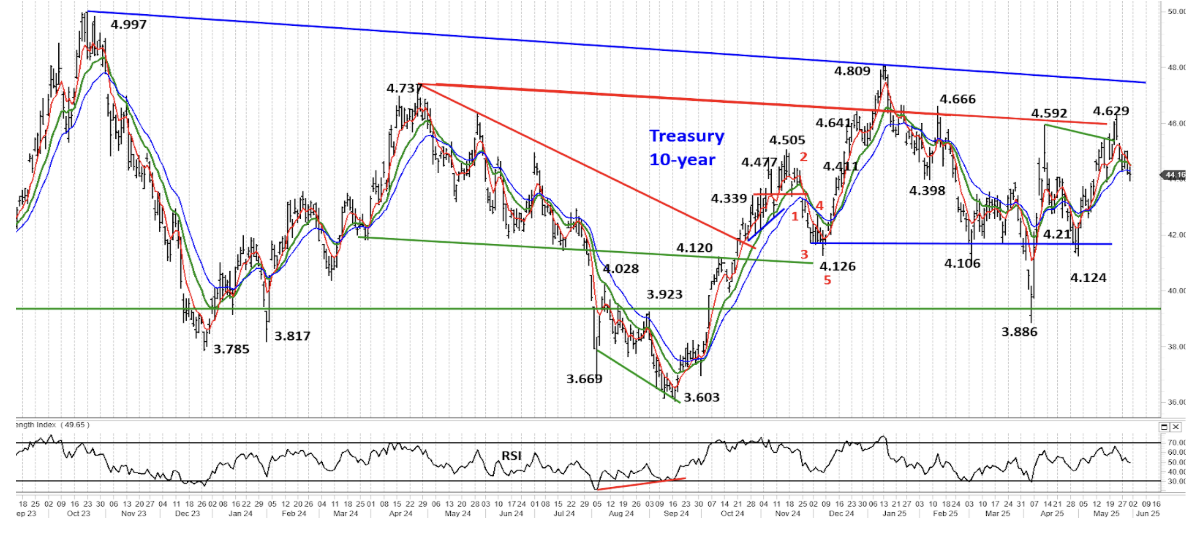
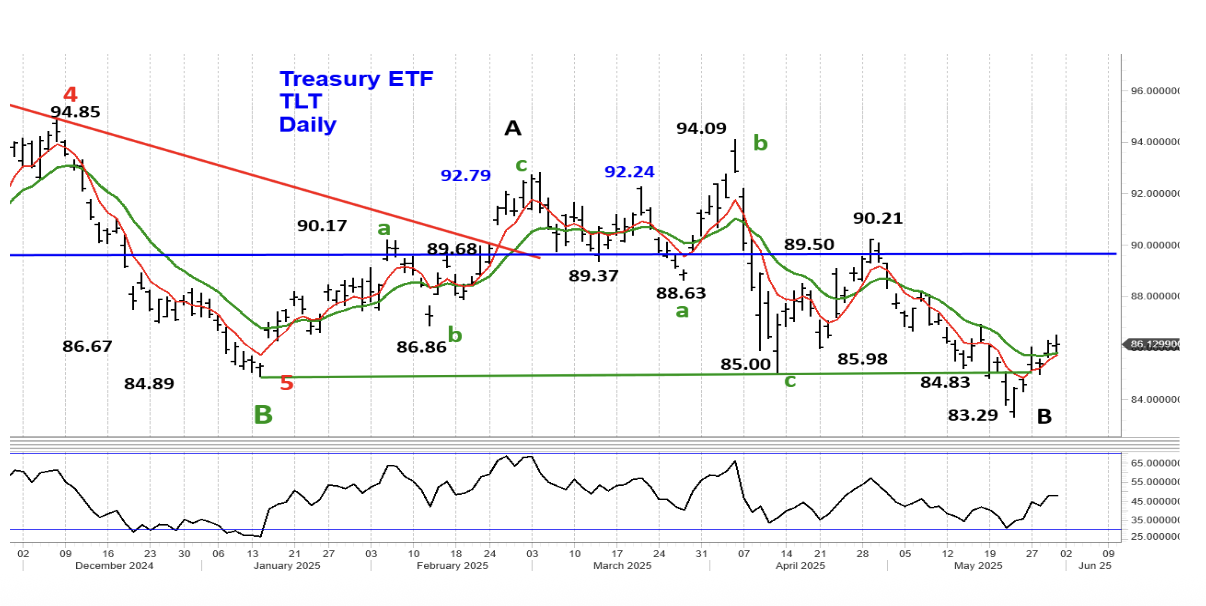
In the near term, the 10-year Treasury yield could test the 4.10% range and TLT could bounce to the blue horizontal trend line near 89.50 and the high at 90.21. After this bounce in TLT and drop in Treasury yields runs its course, Treasury yields are expected to go up. My assessment in the May Macro Tides was “I have no conviction that TLT is getting ready for a big rally, and there remains a risk it will test 85.00 again.” TLT subsequently dropped to 83.29.
TLT – Near term rally 89.50 – 90.21 followed by a decline below 82.00

Dollar
The long term pattern in the Dollar suggests that it is nearing an important trading low.
Dollar – Correction from Sept 2023 high will end after a decline < 97.92
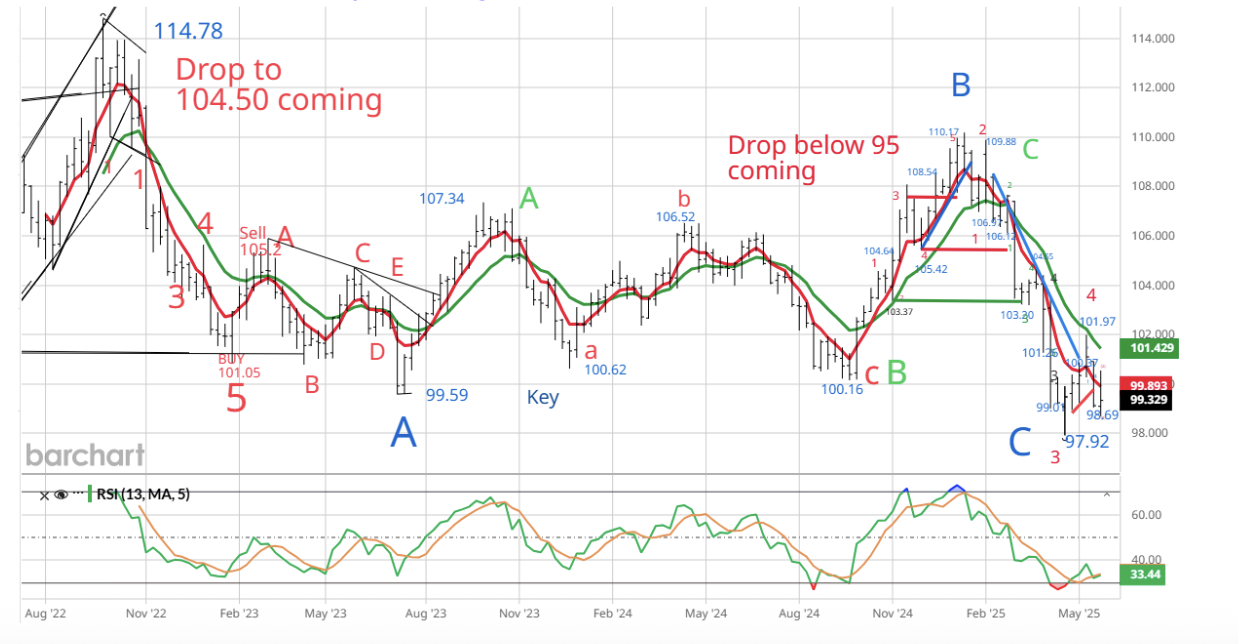
After topping at 114.78 in September 2022, the Dollar declined to 99.59 in July 2023 for Blue Wave A 10 months later. The Dollar then embarked on an A-B-C retracement rally from 99.59. Wave A (green) ended at 107.34 on October 2023. Wave B (green) ended when the Dollar fell to 100.16 in September 2024. The rally that carried to 110.17 was Wave C (green) of the A-B-C retracement rally. The decline from the high of 110.17 is the final portion of the correction that began after the Dollar topped at 114.78 in September 2022. Wave C (blue) will comprise a 5 wave decline. Wave 3 of Wave C ended at 97.92 and Wave 4 of Wave C ended at 101.97.
In the May 27 Weekly Technical Review I discussed why the Dollar was expected to decline below 97.92. “In the process of declining from 101.97, the Dollar declined in 5 waves which could be Wave 1 of Wave 5 from 110.17. The 5 wave drop from 101.97 increases the odds the Dollar will fall below 97.92 before the correction from the October 2022 high of 114.78 is complete.” Wave 5 of Wave will bring the Dollar below 97.92, so expect more weakness in the next few weeks.
Once the Dollar completes Wave C (Blue) the Dollar will be poised for a rally that carries it back to at least 105 – 106 and potentially above 110.17. As noted in the May Macro Tides, “A decline below 97.92 can’t be ruled out, but would create a good buying opportunity.” A solid rally in the Dollar will likely be accompanied by an increase in Treasury yields.
Gold
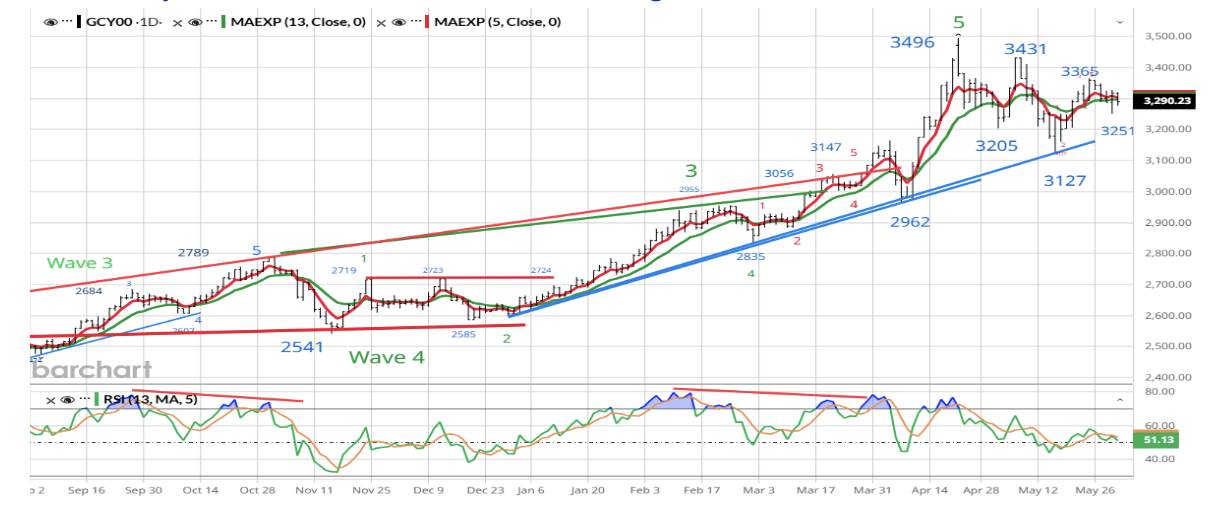
In the May Macro Tides I thought Gold would trade down to the blue trend connecting the trading lows in December 2024, February 2025, and April. On May 15 Gold traded down to 3127 and within a few dollars of the blue trend line. In the May 19 Weekly Technical Review I discussed why Gold was at a fork in the road. “Gold is at an interesting juncture since the decline from 3497 could be a corrective a-b-c. Although the pattern could allow Gold to rally above 3497, I’m skeptical. Much will depend on the Dollar. If the recent rally in the Dollar is Wave 4 and the Dollar declines below 97.92 for Wave 5, Gold will benefit. My guess is that Gold will bounce a bit more (3300 – 3320) before ultimately declining below the 3100 and the blue trend line.”
The expectation that Gold would decline below 3100 changed when Gold rallied in 5 waves off the 3127 low as discussed in the May 27 Weekly Technical Review. “Just as the Dollar declined in 5 waves from its high of 101.97, and increased the odds the recent rally was Wave 4, Gold rallied in 5 waves from its low of 3127. My initial expectation was that the correction from 3496 to 3127 was an a-b-c and the first part of a larger correction that would bring Gold below 3100. The 5 wave rally changes the outlook since the 5 wave rally from 3127 suggests Gold completed the whole correction from 3496 to 3127. If correct, Gold will rally above 3496 sooner than later. A decline below 3206 would suggest this new bullish interpretation was incorrect.”
The Dollar and Gold have been inversely correlated for a number of years. Gold bottomed in late September 2022 at $1616 just as the Dollar was topping at 114.78. If the Dollar bottoms as expected in the next few weeks, Gold is likely to record an important top after rallying to a new all time high. If the Dollar rallies in the next few months, Gold will experience a meaningful decline.
Gold – Rally above 3496 before an Intermediate high is recorded
Stocks
There are several factors that could derail the rally in the stock market.
- The economy slows enough in the next few months that investors become concerned about a recession and a decline in earnings.
- Treasury yields move up aggressively with the 10-year yield climbing above 4.81% and the 30-year pushing above 5.15%.
- The Trade War heats up again after the 90 day pause ends on July 9.
As discussed previously, the economy is facing a number of headwinds but collectively they are expected to cause a slowdown but not a recession just yet. The Unemployment Rate is still historically low (4.2%), wages continue to grow a decent pace (3.8%), and companies aren’t laying off workers even as hiring has slowed. Any slowing in the economy should help keep Treasury yields below key levels and Republicans in the Senate are likely to trim the budget deficit in 2026 and 2027.The wild card is whether trade negotiations proceed and avoid another round of tit-for-tat tariffs by the US and China, the EU, or any other key trading partner. In the near term trades ‘deals’ with India or other secondary trading partners is likely which will boost the stock market.
In February the Advance – Decline Line provided a great warning of impending weakness when it failed to confirm the new price high in the S&P 500 on February 19. On May 16 the Advance – Decline Line provided a different message when it surpassed the November 29, 2024 high even though the S&P 500 was more than 3% below the February 19 high of 6147. This is a positive as noted in the May 19 Weekly Technical Review. “The Advance – Decline Line suggests the S&P 500 will continue to make a run at a new all time high in coming weeks.” I also warned that a pullback was likely in the short term. “In the short term the market is overbought so a pullback is coming.” After topping a 5968 on May 19 the S&P 500 dipped to 5814 on May 23 after President Trump slapped the European Union with a 50% tariff.
S&P 500 – Advance – Decline Line – New high on May 19 is a big positive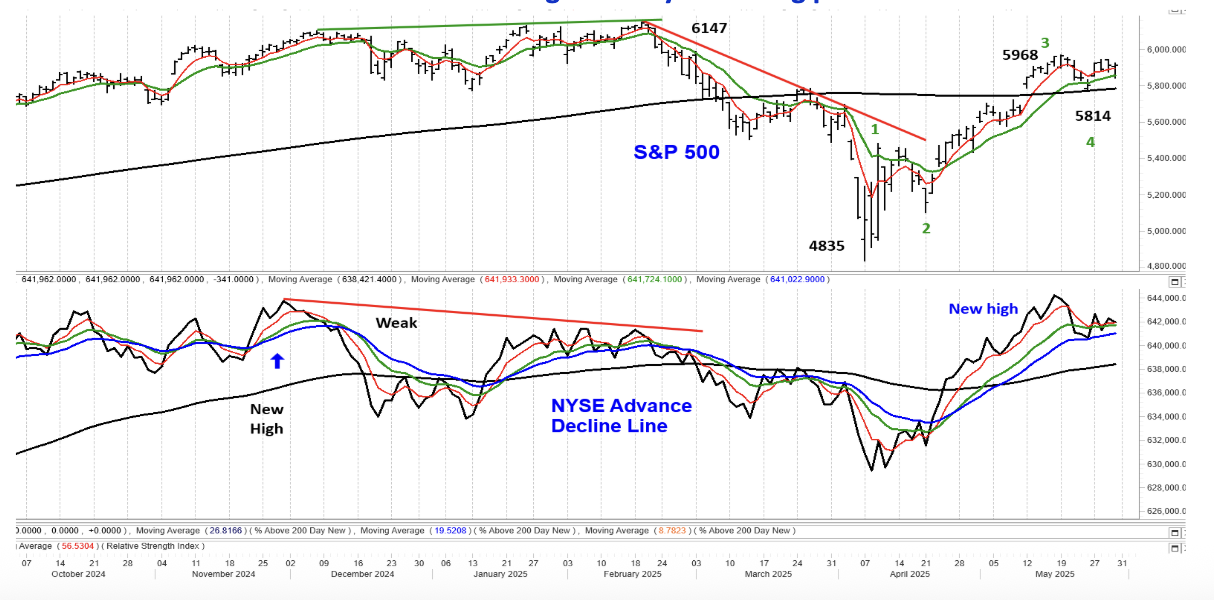
In the May 27 Weekly Technical Review I provided the context of the drop to 5814 and what to expect next. “The drop from 5968 to 5767 appears to be Wave 4 of the rally from the low of 4835. If / when the S&P 500 rallies above 5968 it will complete a 5 wave rally from 4835, whether it tests 6147 or not. The completion of a 5 wave rally will be followed by a pullback that retraces a portion of the 5 wave rally.” If the S&P 500 reaches 6035 in Wave 5, the retracement of the rally from 4835 to 6035 could be 300 points or as much as 450 points depending on whether the retracement is 23.8% or 38.2%. The strength in the Advance – Decline Line suggests this pullback will be a buying opportunity.
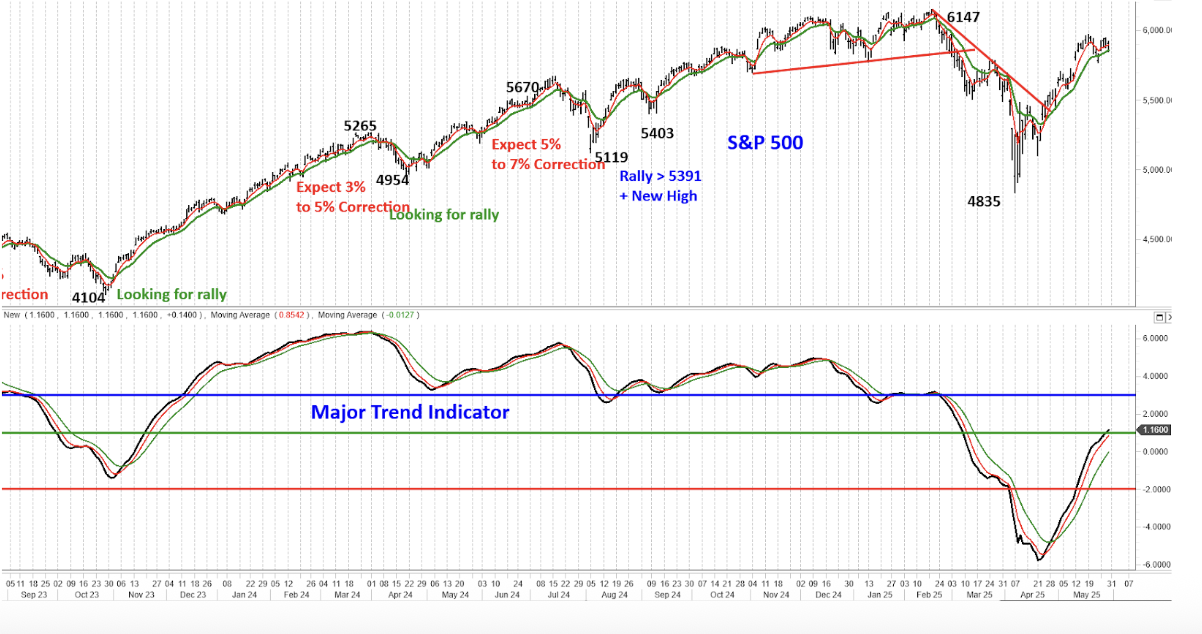
The Major Trend Indicator (MTI) closed above the red moving average when the S&P 500 closed at 5485 on April 24. This crossover represented a short term buy signal within the context of a Bear market at that time. The MTI is designed this way since one can’t know if a short term buy signal (MTI crossing above the red moving average) won’t be followed by a large bear market rally, or the beginning of a new bull market. In the May 27 WTR I noted that the Major Trend Indicator was approaching an important level. The green horizontal line is at 1.0 and on May 29 the MTI climbed above it which is a signal that a Bull market has likely begun. The last time the MTI signaled a new bull market was on November 20, 2023 when the S&P 500 closed at 4547. The MTI crossed above the red moving average on November 3 when the S&P 500 was at 4358.
This new signal from the MTI is another reason why the S&P 500 is expected to rally above 6147 after any pullback.
Major Trend Indicator – New Bull Market Signaled
The Daily Shot
Every month I include dozens of charts and the majority of them come from The Daily Shot. I highly recommend those who like charts of economic data to subscribe to The Daily shot.com.
Jim Welsh
@JimWelshMacro
[email protected], MacroTides.com
A message from Advisor Perspectives and VettaFi: To learn more about this and other topics, check out some of our webcasts.
Membership required
Membership is now required to use this feature. To learn more:
View Membership BenefitsSponsored Content
Upcoming Virtual Events View All


