Gold remains firmly in correction mode — even I will readily agree with that.
But one of the most interesting things about this bull market is that, for it at least, the word “correction” has taken on a new meaning.
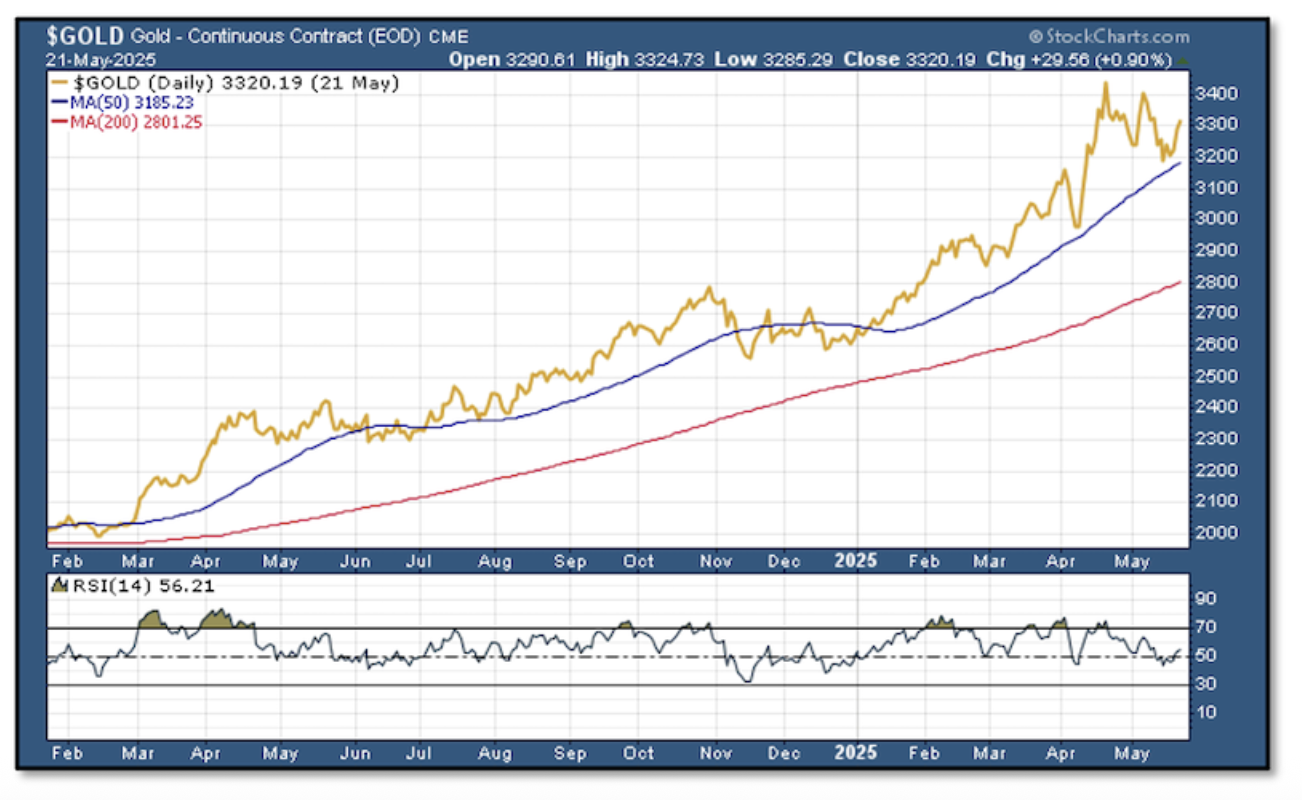
As you can see below, this has been a remarkable run for gold, one that I will confidently call unprecedented.

What we see here is that, with the exception of the downturn following the U.S. presidential election, gold hasn’t really traced out a typical correction. It’s basically only taken brief breaks from its ascent.
Only a few times has the price challenged the 50-day moving average, and only twice has it fallen below that (and one of those was the post-election decline). And never has it even approached the 200-day moving average, or had its RSI drop into oversold territory.
Those waiting for a classic interim bottom buying opportunity have been frustrated at every turn.
And I believe that those now calling for gold to correct back below the key $3,000 level, or touch the 200-day moving average, will be similarly frustrated.
The reason is that, again, this bull market is unprecedented. This is the first time that gold prices have been driven higher over a long term by the cold, hard calculations of sovereign nations — by central banks deploying overpowering capital in a strategy designed to grant them independence from the U.S. dollar.
So this gold market is not swayed by the classic swings in investor temperament from euphoria to despair, and thus every “correction” has been shorter and shallower than classic technical analysis would have predicted.
Again, I believe we’ll see the same thing play out this time.
The Single Best Analysis of the Gold Market
If you want to truly understand why this gold bull market is so different and compelling, you’ll want to read the just-released In Gold We Trust annual report.
This is, simply put, the single best annual analysis of the gold market produced by anyone. Amazingly, our friends Ronald-Peter Stoeferle and Mark Valek, along with their team at Incrementum, graciously distribute it entirely free of charge.
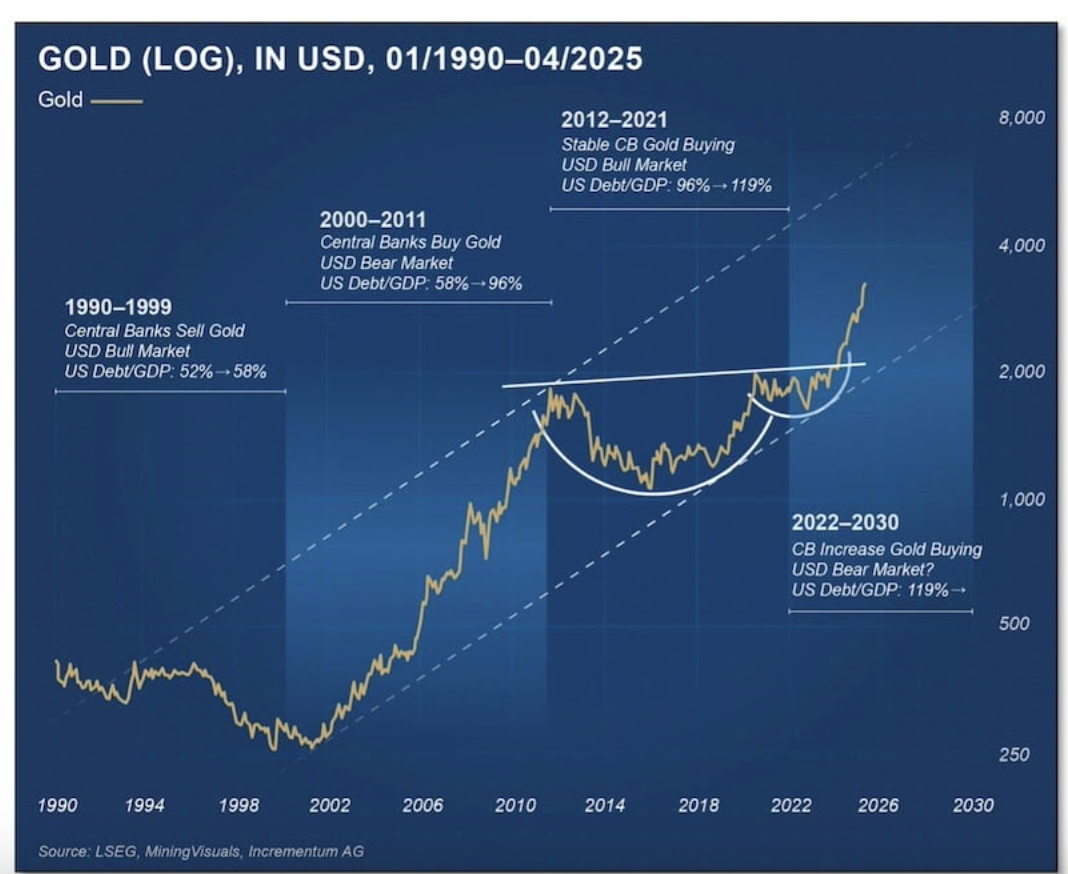
The just-released 2025 edition, entitled “The Big Long,” may be the most important edition yet. It contains dozens of compelling charts detailing why we are still in the early stages of this historic bull market.
Keeping with my theme of the importance of central bank buying, consider this remarkable graphic from the latest IGWT:
This chart shows that we are in another bullish mega-trend, much like the 2000s run that took the gold price up by about eight times. But that market was also driven by investor participation...and we are only now beginning to see investors come into gold and mining stocks in this bull market.
A message from Advisor Perspectives and VettaFi: To learn more about this and other topics, check out some of our webcasts.
Our Service, Use, and Transaction Terms (“Terms”) and Privacy Policy (collectively, the “Policies”) govern your access to and use of this Website. By using the Website or engaging in transactions with Money Metals, you acknowledge that you have read and agree to be bound by the Policies, which are incorporated herein by reference. NOTICE REGARDING MARKET RISKS, ORDER ACCEPTANCE, AND CANCELATIONS: By placing an order online or over the phone with Money Money Metals Exchange, you agree to be bound by our Terms and liable for any and all losses in value of the items you ordered. You may not cancel any order after you place it with Money Metals. If you fail to follow through with timely payment on an order, you are responsible to Money Metals for any monetary damages (including, but not limited to, market losses, collection fees, setoffs, etc).
Read more commentaries by Money Metals Exchange