Last week marked one month since the S&P 500's recent April 8th low. To say the recovery has been fast and furious might be an understatement, evidenced by the index's 13.7% gain from April 8th to May 8th. Going back to 2000, the only years in which we've seen a stronger one-month increase are 2020, 2009, 2008, 2002, and 2001.
No one wants to relive the early April days, during which stocks were quickly falling near or into bear market territory (depending on the index); but the swift plunge was enough to send many investor sentiment metrics we track into "extreme pessimism" territory. As is typically the case when that happens, it created fertile ground for a positive catalyst to help jolt stocks into the opposite direction. We'd argue that the 90-day "reciprocal" tariff pause, followed by the initiation of trade talks with some of our major partners, acted as that catalyst.
The question moving forward is whether the market plunge we experienced was more of a COVID-19-like dip and recovery, or the start of a longer, protracted bear market. Investor sentiment might hold some important keys to help answering that.
What say you?
We are always quick to remind investors of the importance in distinguishing between attitudinal and behavioral measures of investor sentiment. The former tracks how investors feel—or what they're saying—about the market, whereas the latter tracks what investors are doing with their money. At times, there are major differences between both; and at crucial turning points in cycles, the difference has important implications for future returns.
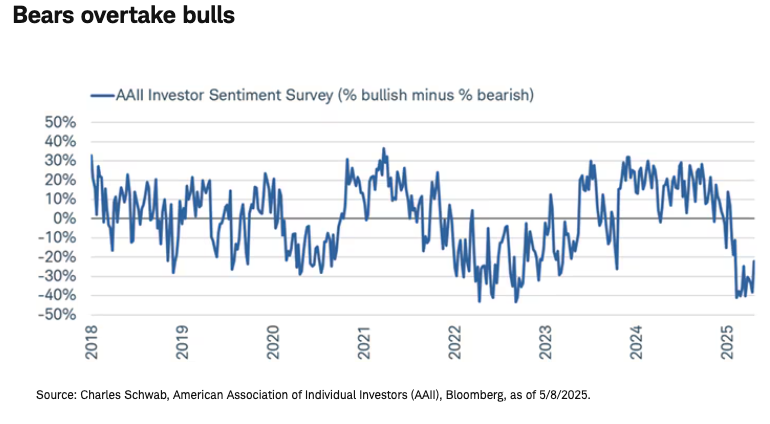
Arguably, the most popular attitudinal metric is the weekly Investor Sentiment Survey put out by the American Association of Individual Investors (AAII), which asks investors whether they are bullish, bearish, or neutral on the market looking out over the next six months. Looking at the spread between the share of bulls and bears, which you can see in the chart below, it collapsed swiftly in April (meaning bears outnumbered bulls) to a level consistent with the lows seen toward the end of the bear market in 2022.

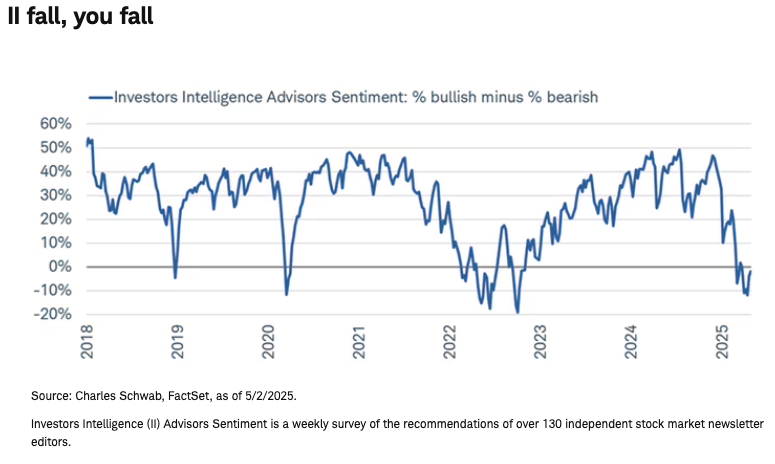
Another attitudinal metric, Investors Intelligence (II) measures bullish and bearish sentiment based on stock market newsletter editors. Looking again at the spread between the share of bulls and bears, you can see that sentiment declined swiftly to levels associated with prior bear markets. It didn't reach the lows in the 2022 bear market but was consistent with the levels seen in December 2018 and March 2020.
Walking the walk?
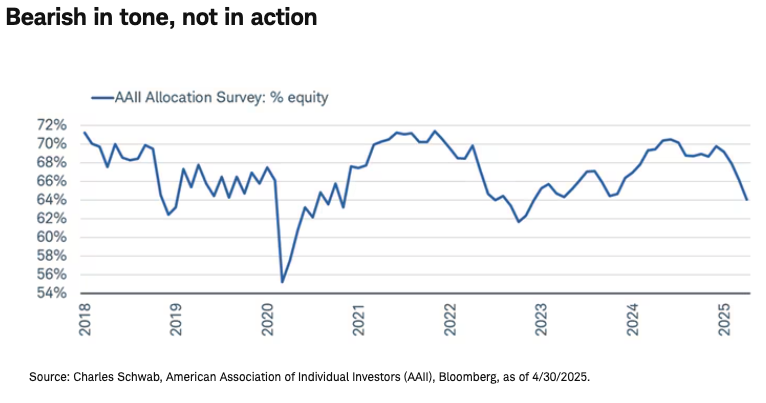
Moving onto behavioral sentiment, the story is a bit different. In addition to its weekly sentiment survey, AAII also tracks members' positioning and exposure to bonds, equities, and cash on a monthly basis. As shown in the chart below, equity positions have dipped a bit over the past couple months, but not dramatically. In short, investors have been telling AAII that they feel as if we're in a deep bear market, but haven't reflected that in their stock exposure—a dynamic akin to what we saw in June 2022 (when the bear market was only halfway complete).
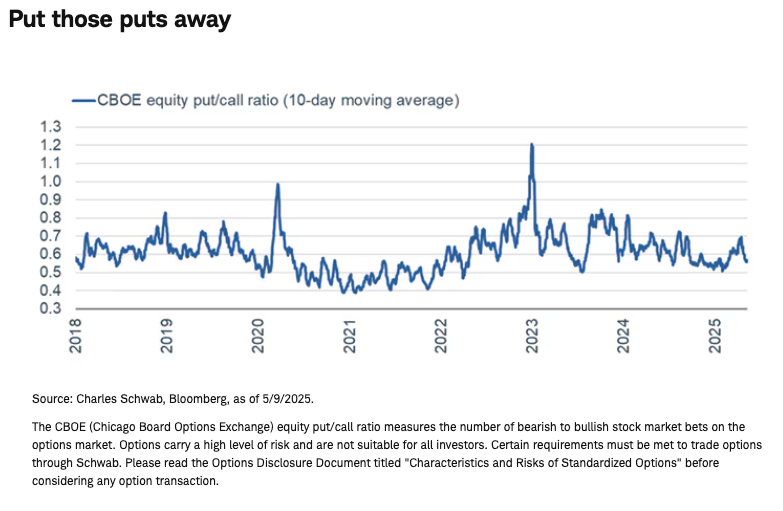
Another area in which we haven't seen much panicky behavior has been the options market. Shown below is a 10-day moving average of the Chicago Board Options Exchange (CBOE) equity put/call ratio, which measures the number of bullish bets relative to bearish bets in the options market. You can see that the ratio tends to spike to elevated levels during major market lows—in late 2018, March/April 2020, and late 2022, for example. It moved higher during the April plunge, but it's a stretch to say it was consistent with typical end-of-bear behavior.
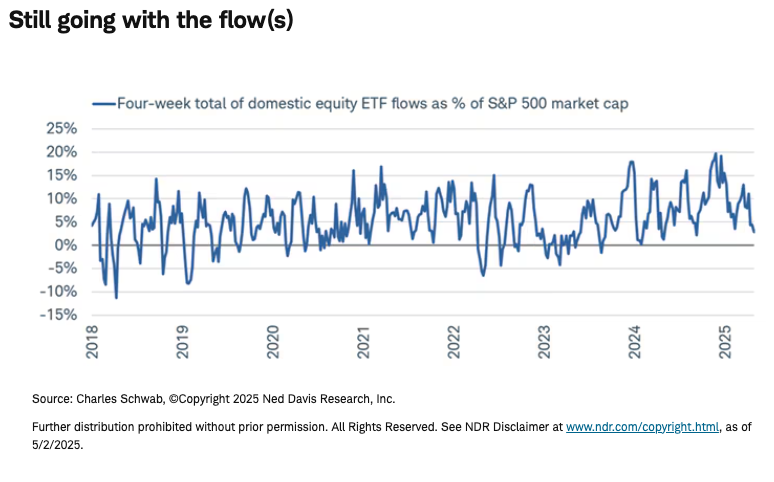
Even though there was a pickup in put buying, there wasn't a commensurate, aggressive selling of equities—which we can track by looking at flows into equity exchange-traded funds (ETFs). Shown below, the rolling four-week total of domestic equity ETF flows as a percentage of S&P 500 market capitalization is still positive. Sure, it has certainly eased from the peak last year, but major market lows are typically marked by investors flushing out more of their stock holdings, sending the percentage into negative territory.
All together now
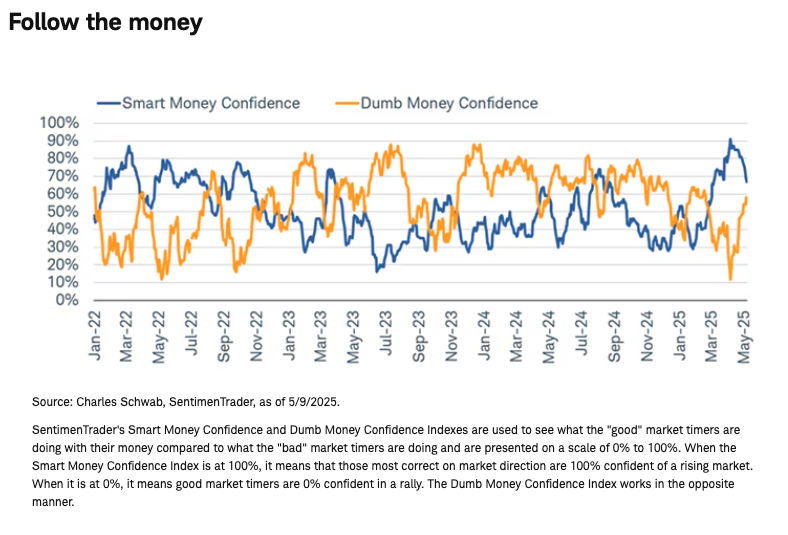
Despite the disconnect between attitudinal and behavioral metrics, the weakness in the former was enough to send most aggregate measures of sentiment (combining attitudinal and behavioral) into zones consistent with the ends of bear markets. Two of those metrics are the Smart and Dumb Money Confidence Indexes tracked by SentimenTrader (ST). Per ST, the former is comprised of things like the equity put/call ratio and small speculators' positions in equity index futures contracts—making it the trend-chasing crowd, which tends to be wrong at extremes (i.e., bull market peaks and bear market troughs). The latter tracks things like commercial hedger positions and the relationship between stocks and bonds—making it the crowd that tends to be right at extremes.
As you can see in the chart below, both Smart and Dumb Money reached extremes during the April lows, doing exactly what they tend to do when stocks reach a maximum point of pain. Smart Money was correct in its contrarian stance while Dumb Money was chasing the trend lower. Always an important caveat: these index labels are ST's, not ours.
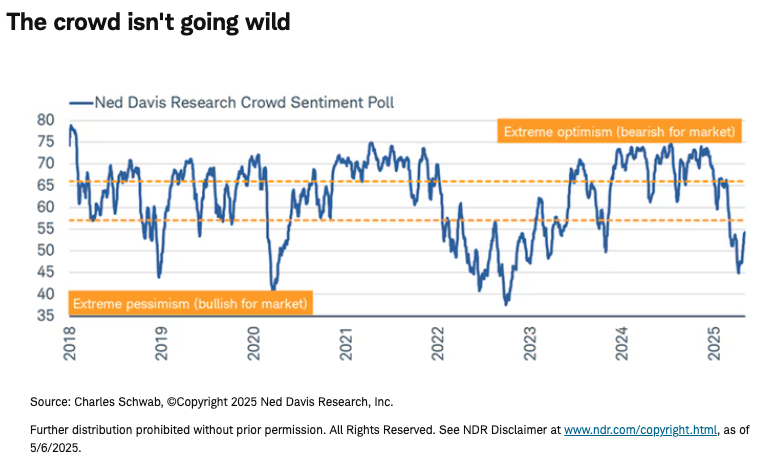
Another aggregate measure of sentiment we like to track is the Crowd Sentiment Poll (CSP) from Ned Davis Research (NDR). It not only combines several attitudinal and behavioral metrics; it has a fairly long history, which makes it useful for looking at the market's performance depending on the CSP's zone and direction. As you can see in the chart below, the CSP dropped swiftly into "extreme pessimism" territory and is still there even after rebounding a bit of late.
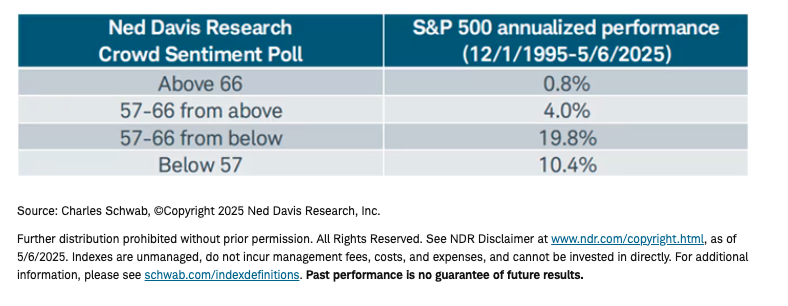
If it continues to climb back into neutral territory (above the yellow dotted line at the 57 level), it will reach a zone that tends to be consistent with the strongest annualized performance for the S&P 500, per the table below.
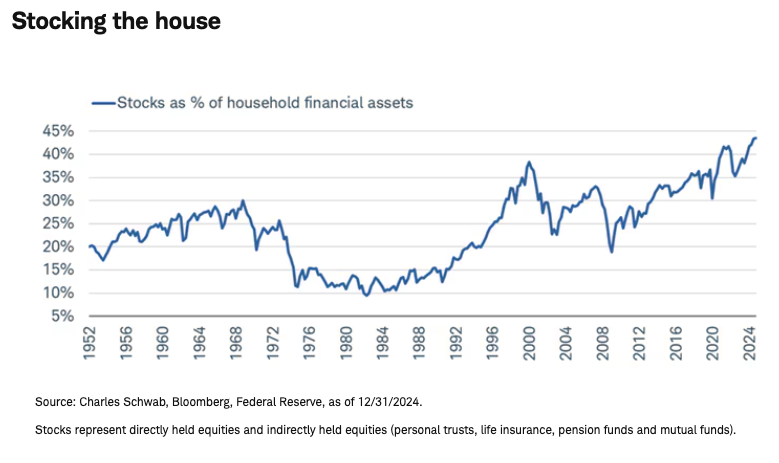
Despite that favorable short-to-medium-term setup, it's worth pointing out a longer-term sentiment risk: household stock exposure. As you can see in the chart below, investors came into 2025 with a record amount of exposure to the equity market when it comes to asset allocation (based on Federal Reserve data dating back more than half a century). That in and of itself isn't a bad thing; it's good that more households are investing in stocks. We just think it bears keeping in mind, especially as it pertains to economic channels: more exposure to stocks implies a stronger wealth effect, both to the upside and downside.
Thrust but verify
There is no shortage of market narratives these days, especially given the dynamics regarding tariffs, Department of Government Efficiency (DOGE)-driven federal layoffs, and public disagreements in Washington over Fed policy. Looking at investor sentiment helps us take a narrative-agnostic view of things, as does looking at market breadth. Both go hand-in-hand and lately, the latter is confirming what we've seen from the former.
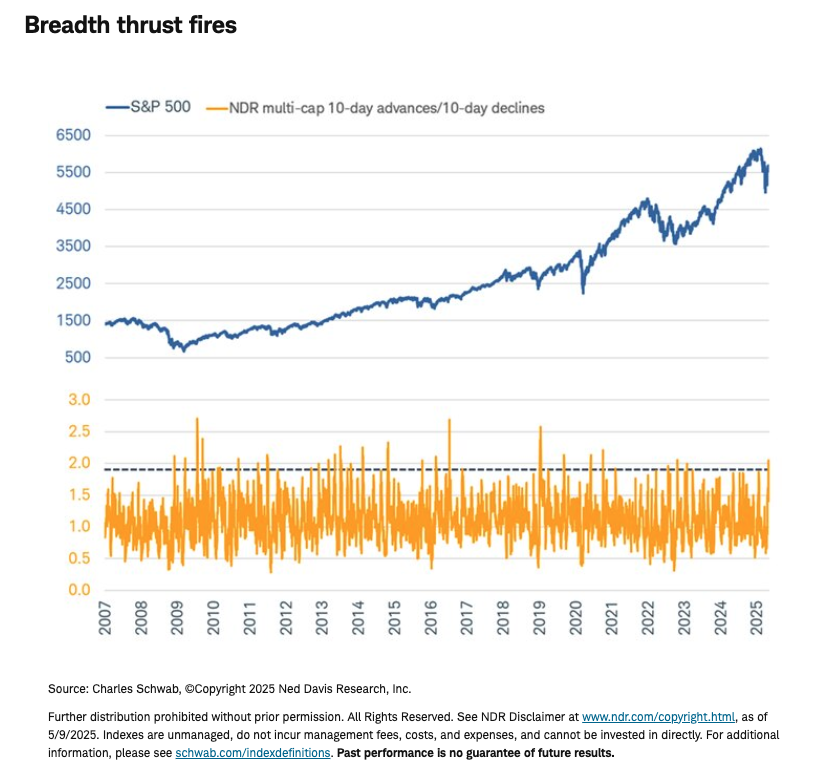
Shown below is the S&P 500 and NDR's multi-cap ratio of 10-day advances relative to 10-day declines, which looks at how many stocks are advancing vs. declining on a rolling 10-day basis. The ratio recently surged above NDR's key threshold of 1.9, indicating a breadth thrust (or sign of market strength) has occurred. A quick glance at the yellow line shows that prior moves above 1.9 have been consistent with the conclusions of bear markets (and in some cases, near-bear markets).
The recent thrust occurred as the S&P 500 was finishing one of its best one-month runs in the past 25 years. As we mentioned at the beginning of this report, in the past 25 years, we've only seen stronger one-month gains in 2020, 2009, 2008, 2002, and 2001. 2020, 2009, and 2002 were years in which bear markets ended. 2008 and 2001 marked only the midpoints of bear markets. Technically, the S&P 500 didn't fall into bear market territory in April, but we'd consider a decline of -18.9% a near-bear market, while also pointing out that the average member's maximum drawdown this year is -23%.
When it comes to stocks, nothing is perfect: history is not a perfect guide, sentiment is not a perfect market-timing tool (as if a "perfect" market-timing tool even exists), and breadth thrusts have at times been false signals for strong forward returns. Animal spirits and recent price action are still in bulls' favor for now, so we wouldn't be surprised to see a continued grind higher for stocks from here. Yet, given the unique nature of the current volatility backdrop, we also wouldn't be surprised to see stocks struggle at the first hints of deteriorating hard data. Up until this point, the market has priced in a panic and subsequent reversal of the worst-case tariff outcome; but the next phase is digesting a backdrop of tariff rates that are both well into double digits and a constant moving target. We expect significant index-level volatility to persist.
A message from Advisor Perspectives and VettaFi: To learn more about this and other topics, check out some of our webcasts.
Investors should consider carefully information contained in the prospectus, or if available, the summary prospectus, including investment objectives, risks, charges, and expenses. You can request a prospectus by calling 800-435-4000. Please read the prospectus carefully before investing.
The information provided here is for general informational purposes only and should not be considered an individualized recommendation or personalized investment advice. The investment strategies mentioned here may not be suitable for everyone. Each investor needs to review an investment strategy for his or her own particular situation before making any investment decision.
All expressions of opinion are subject to change without notice in reaction to shifting market conditions. Data contained herein from third-party providers is obtained from what are considered reliable sources. However, its accuracy, completeness or reliability cannot be guaranteed. Examples provided are for illustrative purposes only and not intended to be reflective of results you can expect to achieve.
Past performance is no guarantee of future results, and the opinions presented cannot be viewed as an indicator of future performance.
Investing involves risk, including loss of principal.
The policy analysis provided by the Charles Schwab & Co., Inc., does not constitute and should not be interpreted as an endorsement of any political party.
Performance may be affected by risks associated with non-diversification, including investments in specific countries or sectors. Additional risks may also include, but are not limited to, investments in foreign securities, especially emerging markets, real estate investment trusts (REITs), fixed income, municipal securities including state specific municipal securities, small capitalization securities and commodities. Each individual investor should consider these risks carefully before investing in a particular security or strategy.
All corporate names and market data shown above are for illustrative purposes only and are not a recommendation, offer to sell, or a solicitation of an offer to buy any security.
Diversification and asset allocation strategies do not ensure a profit and do not protect against losses in declining markets.
Schwab does not recommend the use of technical analysis as a sole means of investment research.
Source: Bloomberg Index Services Limited. BLOOMBERG® is a trademark and service mark of Bloomberg Finance L.P. and its affiliates (collectively "Bloomberg"). Bloomberg or Bloomberg's licensors own all proprietary rights in the Bloomberg Indices. Neither Bloomberg nor Bloomberg's licensors approves or endorses this material or guarantees the accuracy or completeness of any information herein, or makes any warranty, express or implied, as to the results to be obtained therefrom and, to the maximum extent allowed by law, neither shall have any liability or responsibility for injury or damages arising in connection therewith.
Indexes are unmanaged, do not incur management fees, costs, and expenses, and cannot be invested in directly. For additional information, please see schwab.com/indexdefinitions.
© Charles Schwab
Read more commentaries by Charles Schwab