The Price You Pay: Valuation Evaluation
Membership required
Membership is now required to use this feature. To learn more:
View Membership BenefitsAmid a market correction and heightened policy, inflation and growth concerns, valuations are back in the spotlight.
Equity market valuations can be analyzed in multiple contexts and via myriad metrics. Most metrics are fundamental in nature, often relating price to another fundamental component like earnings (P/E ratios), sales, or book value. But then there's the willingness factor: the ebb and flow over time of what investors are willing to pay for those fundamental components. Bull markets (and bubbles) often foster a willingness to pay historically lofty multiples, while bear markets (and crashes) typically foster the unwillingness to pay for historically low multiples. This is the psychology of markets, even if most valuation metrics have quantifiable numbers associated with them. In this sense, valuations are as much a sentiment indicator—or better put, an indicator of sentiment—as a fundamental indicator.
13 going on expensive
We keep track of a baker's dozen worth of valuation indicators, shown below. Some are more commonly followed, like the variety of P/E-related metrics. Others put equity market valuations in the context of bond yields (like equity risk premiums and the "Fed Model"). Others still are much broader and put equity market valuations in the context of the U.S. economy (like market cap/GDP, often thought of as the "Buffett Model").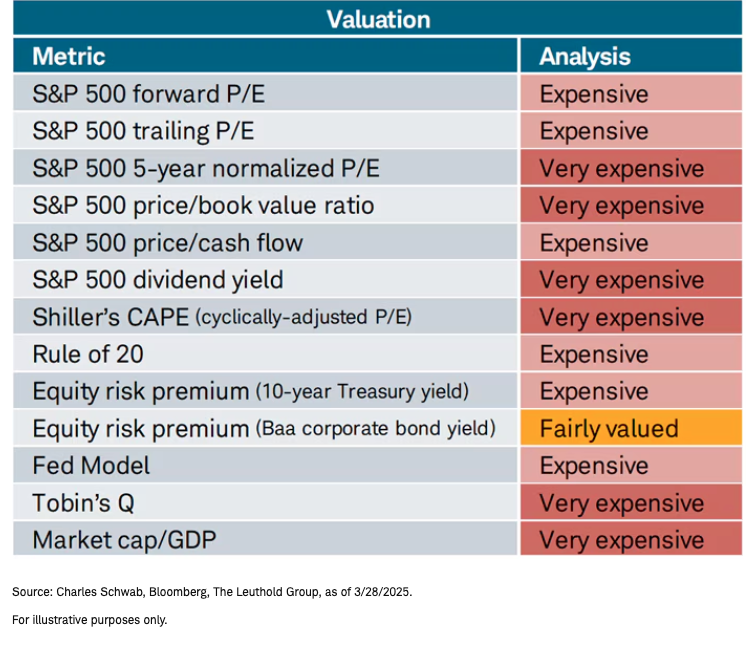
As shown above, all but one valuation indicator we track is on the expensive end of the spectrum. The marginally good news is that several of these metrics improved a notch from the "very expensive" categorization, including the forward and trailing P/Es, the Rule of 20 and the Fed Model.
Inflation matters…everywhere
As noted, increasingly relevant today is thinking about valuation in the context of inflation. The Rule of 20 valuation metric is an example. It suggests that the market is fairly valued when the sum of the P/E ratio and the inflation rate equals 20, with undervalued markets below 20 and overvalued markets above 20. But inflation matters more broadly, even as it relates to more traditional P/E ratios.
Shown below. It was several decades ago that I (Liz Ann) created the table below, which of course we update regularly, and here. It dates back to the start of the modern era of the S&P 500 (when it became an index of 500 stocks) in 1958. It relates ranges of inflation (using the Consumer Price Index, or CPI) to average forward P/E ratios, including their historical ranges and percentage of time in each range.
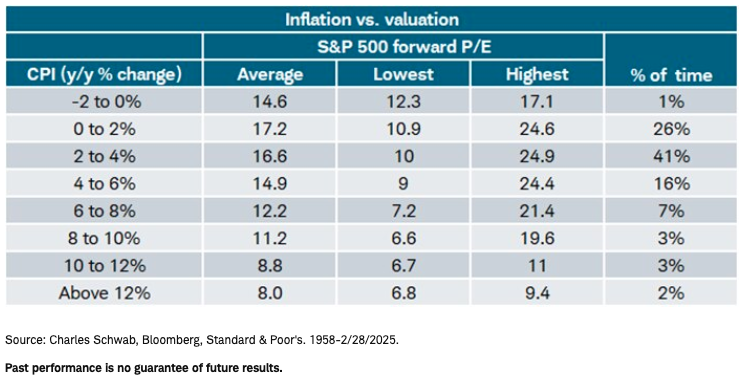
Not coincidentally, the "sweet spot" for valuations (when the market has supported higher multiples) is plus-or-minus 2%, which happens to be the target of the Federal Reserve. The lowest valuations historically have come when inflation moves into "hyper" territory (north of 8%). The direction of travel matters as well. Even if inflation at a point in time is not in a trouble zone, if it's moving up, it tends to put downward pressure on multiples.
There are a couple of "double rubs" at play presently as well. One rub is that concern has morphed from rising inflation to more perilous stagflation (higher inflation, lower economic growth) courtesy of tariffs. The other rub is that forward earnings estimates (the E in the forward P/E equation) have been trending lower. In January, the consensus (per LSEG I/B/E/S data) for 2025's year-over-year S&P 500 earnings growth was 14%; today that estimate is 10.6%. Not only is that expected deceleration notable, if the consensus is right, it would mean the growth rate in 2025 will be lower than 2024's 12% growth. On this note, it's again time to remind investors of our age-old adage that it's often the case that "better or worse matters more than good or bad."
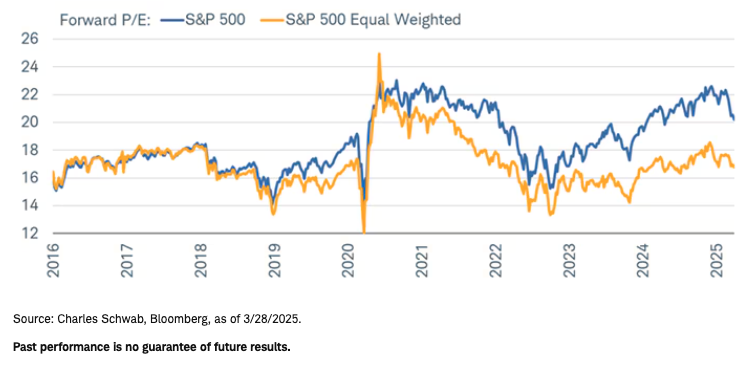
Charting the forward P/E course
When it comes to valuation, the post-pandemic era has been defined by the mega caps' influence. As shown in the chart below, since 2020, the gap between forward P/E ratios for the cap- and equal-weighted S&P 500 indexes has grown increasingly wide. At the most recent extreme, the former jumped close to 23 while the latter was slightly below 19. Much, if not all, of that was driven by the popularity of the Magnificent 7 ("Mag7") stocks—both during the dark days of the pandemic and the bull market that followed the 2022 bear market.
The recent decline in forward P/Es has explained much of the market's correction this year. Importantly, as mentioned earlier, although the consensus is still for double-digit earnings growth this year, estimates for every quarter of 2025 have been cut continuously, despite considerable strength in the reporting season for last year's fourth quarter.
P/Es not created equal

Valuation as an indicator of sentiment, noted above, rings true in this most recent drawdown, especially given many valuation metrics got to or near all-time highs. This was likely driven by the post-election euphoria that stemmed from optimism around deregulation, the extension of tax cuts, and an ample mergers and acquisitions (M&A) environment. Whenever valuation gets stretched and too hot, it tends to make stocks vulnerable to a pullback in the event of a negative catalyst.
We would argue that catalyst has been, and continues to be, volatility driven by chaotic trade and tariff policy. The back-and-forth on almost a daily basis has limited businesses' abilities to make capital spending and hiring plans, and helped drive the market into a correction, exacerbated by stretched valuations.
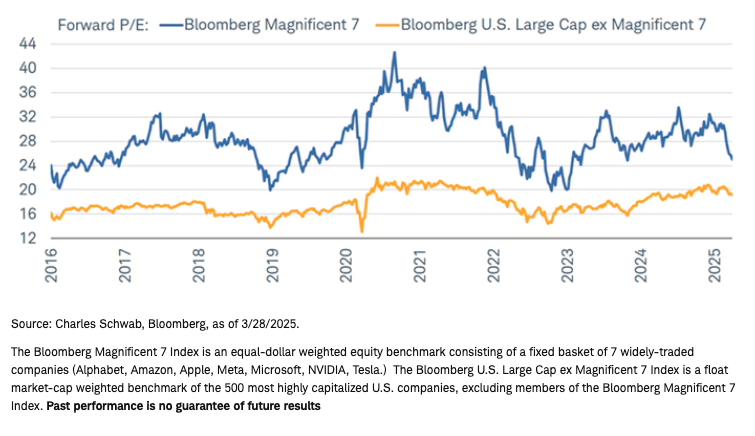
There is another dynamic at play, though, which is the massive re-rating in the mega-cap world. As a group, the Mag7—which lately can be thought of as the Lag7—has seen its forward P/E contract sharply in the most recent selloff. Shown below, at last year's peak the forward P/E jumped close to 33. As of last Friday's close, it sat just above 24. To be sure, the group has gone through more severe drawdowns before—notably, in 2022.
So, on the one hand, the current pullback hasn't been nearly as aggressive and hasn't yet dealt a major hit to the rest of of the market's valuation (shown via the yellow line). On the other hand, if we are to enter a more protracted drawdown, there is likely more froth to be wrung out of the mega caps. Unfortunately, given their weight in the cap-weighted indexes, any continued weakness would put disproportionate pressure on the market.
From Mag7 to Lag7
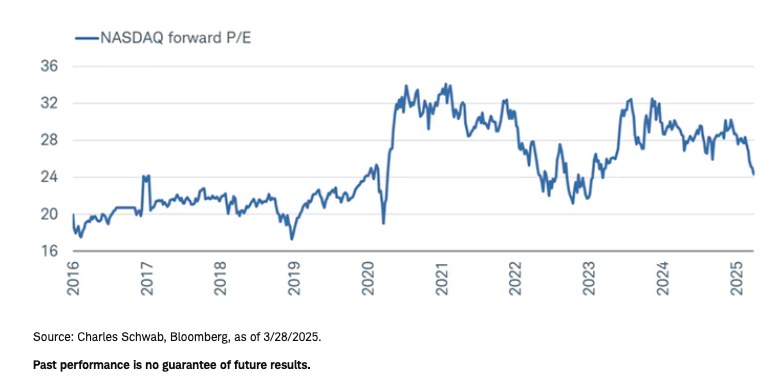
That kind of pressure is put under a microscope for an index like the tech-heavy Nasdaq. As shown in the chart below, the index's forward P/E has dropped to 24, its lowest since the early parts of 2023.
Tech and tech-adjacent under pressure
How not to use valuation
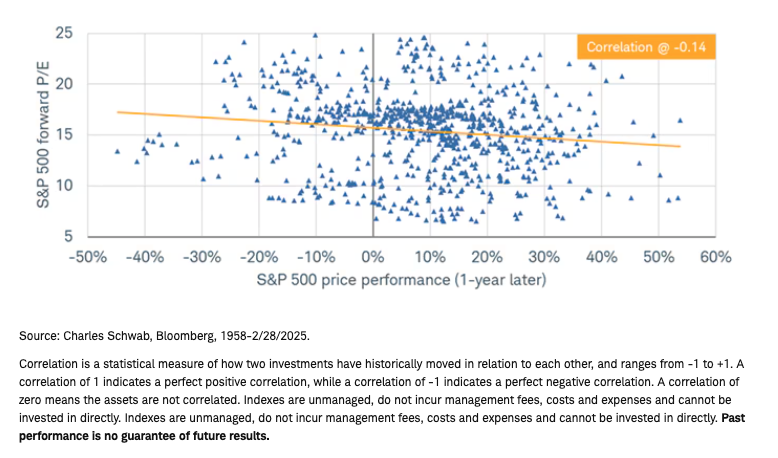
Just like we're on record for saying valuation is more useful as a sentiment indicator, the same holds for saying that it is a terrible market-timing tool (if such a thing ever existed). As shown in the chart below, the relationship between the S&P 500's forward P/E and the index's return a year later is weak at best. Going back to the late 1950s, the correlation between both is just -0.14.
To put some numbers around that, consider the fact that years in which the S&P 500's forward P/E was in the low 20s have seen forward one-year returns range from -28% to +44%. The starting valuation tells you almost nothing about what is to come in the next year.
One-year forward returns all over map
In sum
In the midst of a market correction—especially given the deteriorating inflation and forward earnings backdrop—a look a valuations is instructive. Price declines, all else equal, ease valuation excesses. But the current environment has the "double rubs" of stagflation concerns and accelerating corporate (and consumer) angst, which is putting downward pressure on future assumptions about growth and earnings. Valuation is an indicator of sentiment, and sentiment is not set to improve until there is more government policy-related clarity.
The information provided here is for general informational purposes only and should not be considered an individualized recommendation or personalized investment advice. The investment strategies mentioned here may not be suitable for everyone. Each investor needs to review an investment strategy for his or her own particular situation before making any investment decision.
All expressions of opinion are subject to change without notice in reaction to shifting market conditions. Data contained herein from third-party providers is obtained from what are considered reliable sources. However, its accuracy, completeness or reliability cannot be guaranteed. Examples provided are for illustrative purposes only and not intended to be reflective of results you can expect to achieve.
Past performance is no guarantee of future results, and the opinions presented cannot be viewed as an indicator of future performance.
Investing involves risk, including loss of principal.
The policy analysis provided by the Charles Schwab & Co., Inc., does not constitute and should not be interpreted as an endorsement of any political party.
Performance may be affected by risks associated with non-diversification, including investments in specific countries or sectors. Additional risks may also include, but are not limited to, investments in foreign securities, especially emerging markets, real estate investment trusts (REITs), fixed income, municipal securities including state specific municipal securities, small capitalization securities and commodities. Each individual investor should consider these risks carefully before investing in a particular security or strategy.
All corporate names and market data shown above are for illustrative purposes only and are not a recommendation, offer to sell, or a solicitation of an offer to buy any security.
Diversification strategies do not ensure a profit and do not protect against losses in declining markets.
Schwab does not recommend the use of technical analysis as a sole means of investment research.
Source: Bloomberg Index Services Limited. BLOOMBERG® is a trademark and service mark of Bloomberg Finance L.P. and its affiliates (collectively "Bloomberg"). Bloomberg or Bloomberg's licensors own all proprietary rights in the Bloomberg Indices. Neither Bloomberg nor Bloomberg's licensors approves or endorses this material or guarantees the accuracy or completeness of any information herein, or makes any warranty, express or implied, as to the results to be obtained therefrom and, to the maximum extent allowed by law, neither shall have any liability or responsibility for injury or damages arising in connection therewith.
Indexes are unmanaged, do not incur management fees, costs, and expenses, and cannot be invested in directly. For additional information, please see schwab.com/indexdefinitions
Shiller's Cyclically Adjusted P/E (CAPE): Uses an inflation-adjusted price for the S&P 500 and divides by reported earnings over the prior 10 years.
Rule of 20: Stocks are considered fairly valued when the sum of the S&P 500 forward P/E ratio and the year-over-year change in the consumer price index (CPI) is equal to 20 (or inexpensive when it's below 20).
Fed model: Compares the S&P 500's earnings yield (which is the inverse of the P/E—or E/P) to the yield on long-term U.S. government bonds. Negative readings suggest favoring stocks over bonds.
Tobin's Q: Developed by Nobel Laureate James Tobin. It's often called the Q Ratio and is the total price of the U.S. stock market divided by the replacement cost of all its companies.
0325-CCW0
A message from Advisor Perspectives and VettaFi: To learn more about this and other topics, check out some of our webcasts.
Membership required
Membership is now required to use this feature. To learn more:
View Membership BenefitsSponsored Content
Upcoming Virtual Events View All


