As investors have flocked to defined outcome funds or buffered outcome ETFs, certain questions have arisen, principally around buffered ETF performance and pricing. As a relatively new investment solution, it’s unsurprising that it takes some time before investors understand the risk and returns of an unfamiliar product.
One frequent question is: “Why isn’t my buffered fund up in lock-step with the market?”
Investors are often told they could expect all the S&P 500 Index’s returns up to the cap.
But then, let’s say halfway through the 12-month outcome period, if the market has risen far beyond that cap, they may wonder why the NAV of their buffered ETF is lagging the S&P 500 Index.
It is a valid question, and it has a logical answer.
To understand why the NAV of a buffered fund might lag the market it is essential to understand how a typical buffered fund is structured.
Typical Trade Structure of a Buffered ETF

The key phrase in the above description is one-year period. This graph illustrates the investor’s risk-return trade-off in the buffer ETF if it is held for the entire one-year, from when the option trades were first established to the last day when the options expire. Any holding period different than that one-year period will diverge from the above graph. The disclosures of buffered ETFs always mention this fact, but it is easy to overlook this stipulation.
So, the next likely question is, “Why does the pricing diverge over shorter periods?”
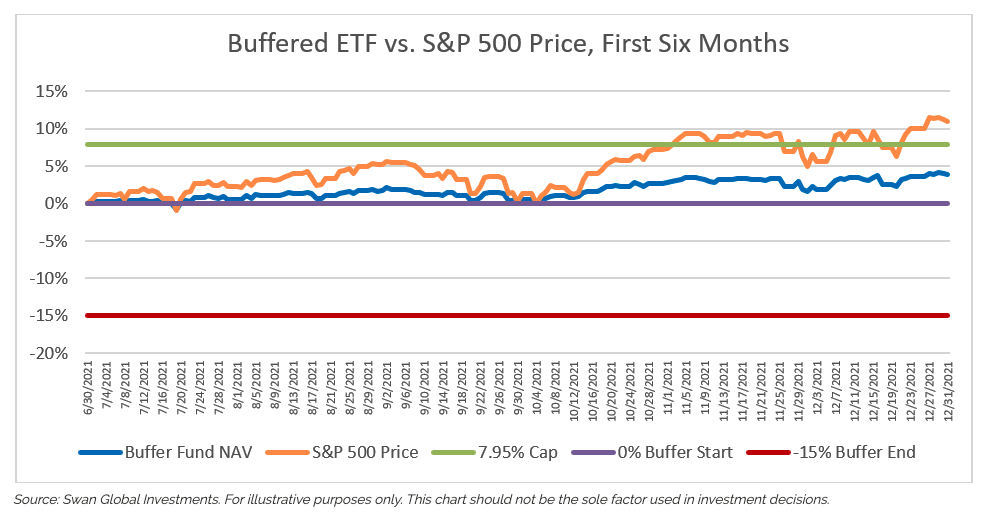
This question is best addressed via an illustration. Below we see the NAV performance of a 0% to -15% buffer with a 7.95% upside cap and a one-year time horizon. This fund’s investment period stretches from July 1st to June 30th every year, and in this case, we are examining the period of July 1st, 2021 to June 30th, 2022.
Over the first six months of this investment cycle, the price of the S&P 500 (orange line) was up 10.9%, well above and beyond the 7.95% cap. However, the NAV of the buffer fund (blue line) was up only 3.9% from July 1st, 2021 to December 31st, 2021.
It is a situation like this that leads to investors questioning whether buffer funds work as intended.
Determining a Buffered ETF’s NAV
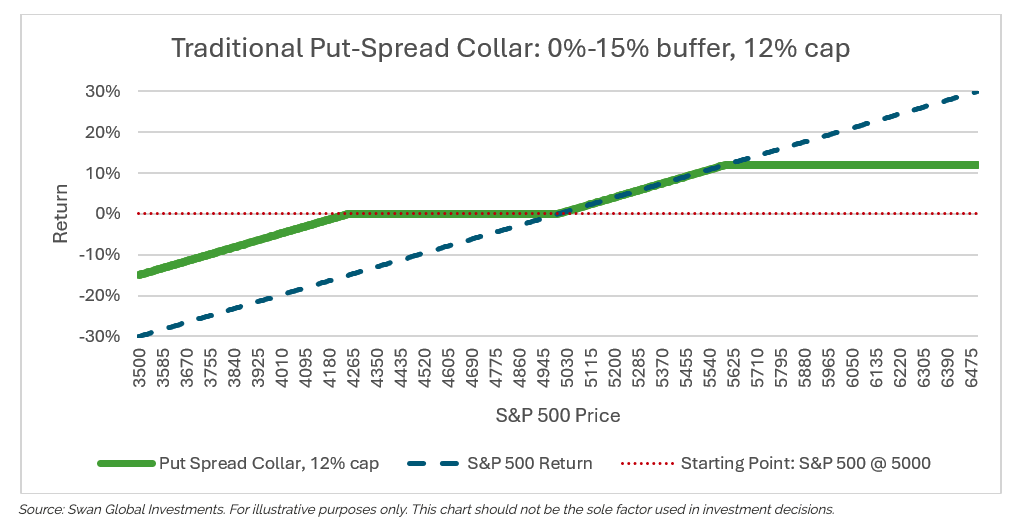
The typical defined outcome fund has the following value proposition: over a one-year period an investor can reasonably expect to have partial, but not complete, downside protection in their investment.
In exchange for this downside protection, the investor willingly forgoes potential market gains beyond a “cap.” This opportunity cost to the upside is the trade-off for having the downside hedge. The graph below illustrates a defined outcome ETF with a 0%-15% buffer to the downside and a 12% cap to the upside.
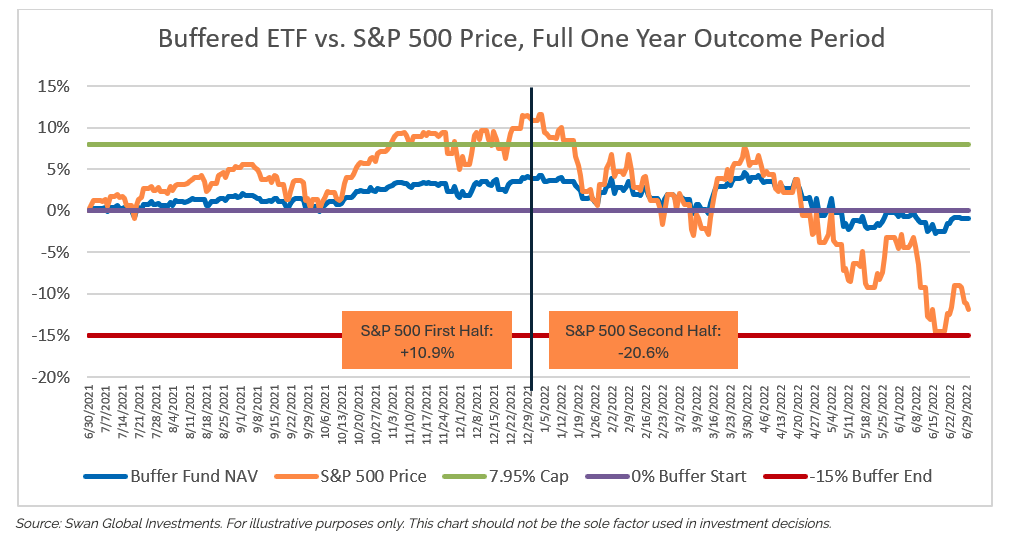
However, if one looks at the full one-year period in the graph below, two things are revealed. First, the buffer fund performs exactly as intended. Second, it becomes clear why the buffer fund’s NAV did not track the S&P 500 in lockstep. While it is true that the S&P 500 was up 10.9% during the first six months, during the subsequent six months, the S&P 500 was down -20.6%, surrendering all its previous gains.
For the full one-year from July 1st, 2021 to June 30th, 2022 the price return of the S&P 500 -11.9%. The buffer fund’s long put option did its job, hedging losses between 0% and -15%. For the same one-year period the fund’s NAV was down a slight 92 basis points, due to the expense ratio of the fund.
The Final Score (End of the Term) is All that Matters with Buffered ETFs
This situation can be illustrated with a sports analogy.
Super Bowl LVIII featured the San Francisco 49ers and the Kansas City Chiefs. Assume that someone had placed a bet on San Francisco winning the big game. Midway through the second quarter that fan felt optimistic; the 49ers were up 10-0 at one point. The bettor might ask, “why can’t I cash in my winning ticket now? My team is ahead; this game is in the bag.”
Of course, that is not how it works. The winner of the game is not determined until the final whistle. In Super Bowl LVIII, Kansas City rallied to win, and the wager on San Francisco was worthless[i].
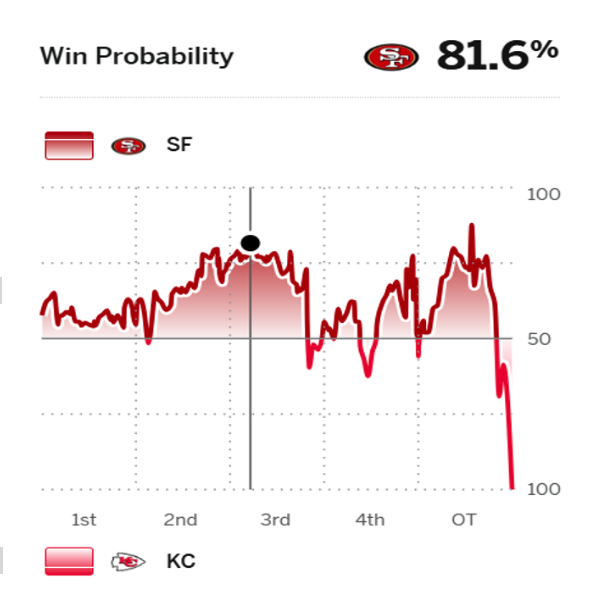
The graph below shows ESPN’s “Win Probability” calculation, illustrating the relative likelihood of either team winning a game.
When the line is above the axis, San Francisco has a higher probability of winning, and when the line is below the axis, Kansas City is favored.
Throughout most of the game, the percentages favored San Francisco. However, the only thing that matters is the score at the end of the game, and when the clock hit 0:00, the Chiefs won and the 49ers lost[i].
This is a similar scenario to the buffered outcome situation. Sure, the S&P 500 might be up for the first portion of the year. The S&P 500 might be up for most of the year. In fact, it might even be up far beyond the buffer fund’s cap. But until we get to expiration; until there is 0:00 remaining on the clock, there is the possibility that the S&P 500 could surrender those gains. That is why the NAV of a buffered fund doesn’t track the S&P 500 one-for-one on the way up and why the stated buffers and caps are only valid for the full one-year time horizon.
Defined outcome funds have become increasingly popular with investors and can fill a strategic need for downside risk mitigation. As long-time advocates of options-based strategies, Swan Global Investments is encouraged by the widespread adoption of hedged equity solutions.
Swan has also emphasized the importance of education when it comes to options. One must “know what you own” before investing, and we’ve published a white paper with that very title to examine the expanding options-based category. While defined outcome funds and other hedged equity solutions are valuable, one should understand the risks and returns of their chosen strategies.
[i] This isn’t a perfect analogy. Technically, the score was tied at the end of regulation in Super Bowl LVIII and Kansas City won in overtime. When it comes to options, there is no “overtime.”
A message from Advisor Perspectives and VettaFi: To learn more about this and other topics, check out some of our webcasts.
© Swan Global Investments
Read more commentaries by Swan Global Investments