Jigsaw Puzzle: Growth vs. Value
Membership required
Membership is now required to use this feature. To learn more:
View Membership BenefitsThe growth vs. value debate can get heated at times, but the discussions are often without appropriate context (and/or construction details). There are eight commonly followed growth and value indexes among those constructed by Russell and S&P Dow Jones:
- Russell 1000 Growth (large cap growth, some overlap into value)
- Russell 2000 Growth (small cap growth, some overlap into value)
- Russell 1000 Value (large cap value, some overlap into growth)
- Russell 2000 Value (small cap value, some overlap into growth)
- S&P 500 Pure Growth (strict growth-only, no overlap into value)
- S&P 500 Growth (traditional growth, overlap into S&P Value allowed)
- S&P 500 Pure Value (strict value-only, no overlap into growth)
- S&P 500 Value (traditional value, overlap into S&P Growth allowed)
In terms of construction, Russell uses a probability-based model, with stocks receiving growth and value scores, and can have partial exposure to both styles. Russell's growth indexes are more forward-looking, using analyst forecasts rather than historical momentum like S&P. Russell's value indexes place more emphasis on dividend yield, unlike S&P, which focuses more on price/book and price/earnings ratios.
Performance implications
The somewhat-recent pullback in "growth" sectors' performance (somewhat at the expense of their "value" counterparts) has not been even across the board—both at the index level and down the cap spectrum. Before digging into performance details, it's worth emphasizing the three ways investors typically think about growth and value:
- There are growth- and value-labeled indexes like those from S&P and Russell detailed above.
- There are pre-conceived notions of growth and value stocks.
- There are the factors, or characteristics, of growth and value.
As an example, the Technology sector is often thought of as a growth sector, while Financials is often thought of as a value sector. For the most part, those parings make sense, but there are times when they aren't reflected in the indexes. A recent instance of this was at the end of 2022, when S&P rebalanced its Growth and Value indexes rather dramatically.
December 2022 case study
In mid-December 2022, after the conclusion of that year's bear market, S&P took six of the "Magnificent 7" (Mag7) names (Alphabet, Amazon, Apple, Meta, Microsoft, NVIDIA, and Tesla) out of the S&P 500 Pure Growth Index, with only Apple remaining for the following year. That's notable given S&P's Pure indexes are meant to reflect, well, the purest growth or value characteristics (hence the no overlap policy within the Pure indexes).
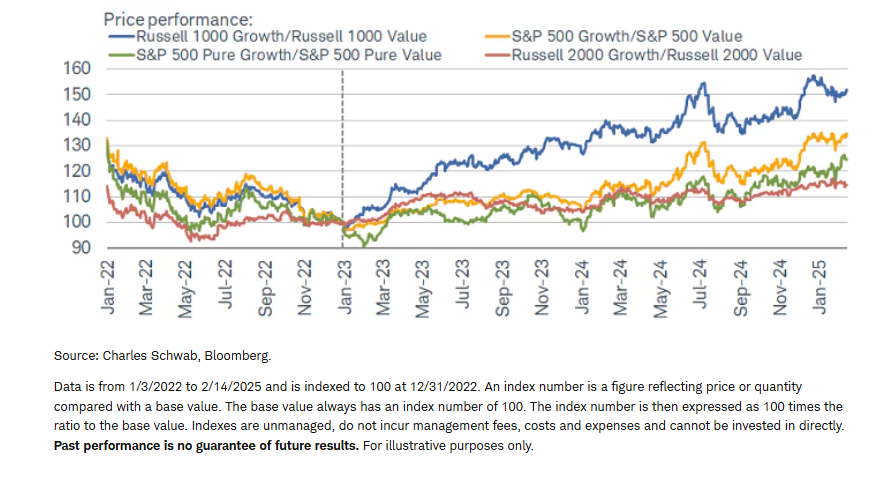
Given the mega caps' strong rebound in 2023, "growth" did well relative to "value" that year, but it wasn't equally distributed among the indexes. As shown via the green line in the chart below, S&P 500 Pure Growth barely made any headway relative to S&P 500 Pure Value; the real strength was in Russell 1000 Growth relative to Russell 1000 Value (and that is still the case today). Russell 1000 Growth's relatively sharp rebound kicked in right at the start of 2023, leaving S&P 500 Pure Growth's relative performance in the dust. That was almost entirely attributed to S&P's leaving out the aforementioned six Mag7 members; as well as the relatively mild rebalancing of the Russell indexes in the middle of 2023.
Growth dominance not equal
That "issue" hasn't necessarily been rectified today, given the list of top 10 constituents (by index weight) in S&P 500 Pure Growth doesn't include a single Mag7 stock. In fact, in the top 10, there are three Industrials stocks, one Utilities stock, and one Energy stock. Even more interesting: there is only one Technology stock (Arista Networks) in the top 10.
There are a couple of interesting take-aways when looking at year-to-date (through Friday's close) price performance among these eight indexes, shown below. To say growth is outperforming is somewhat accurate given the top ranking of S&P 500 Pure Growth. However, the performance readings for S&P 500 Growth and Russell 1000 Value are nearly identical; while Russell 2000 Growth is closer to the bottom of the ranking.
- S&P 500 Pure Growth: +8.0%
- S&P 500 Growth: +5.0%
- Russell 1000 Value: +4.9%
- Russell 1000 Growth: +3.7%
- S&P 500 Value: +2.8%
- Russell 2000 Growth: +2.6%
- S&P 500 Pure Value: +2.2%
- Russell 2000 Value: +1.9%
Source: Charles Schwab, Bloomberg. Indexes are unmanaged, do not incur management fees, costs and expenses and cannot be invested in directly. Past performance is no guarantee of future results.
More on sector dispersion
Shown below is a style index version of our quilt charts, which typically show performance among asset classes or sectors, ranked over time. This time, each percentage represents the weight of each sector (using the standard S&P GICS sector classifications) in the index listed at the top.
Variation in sector weightings
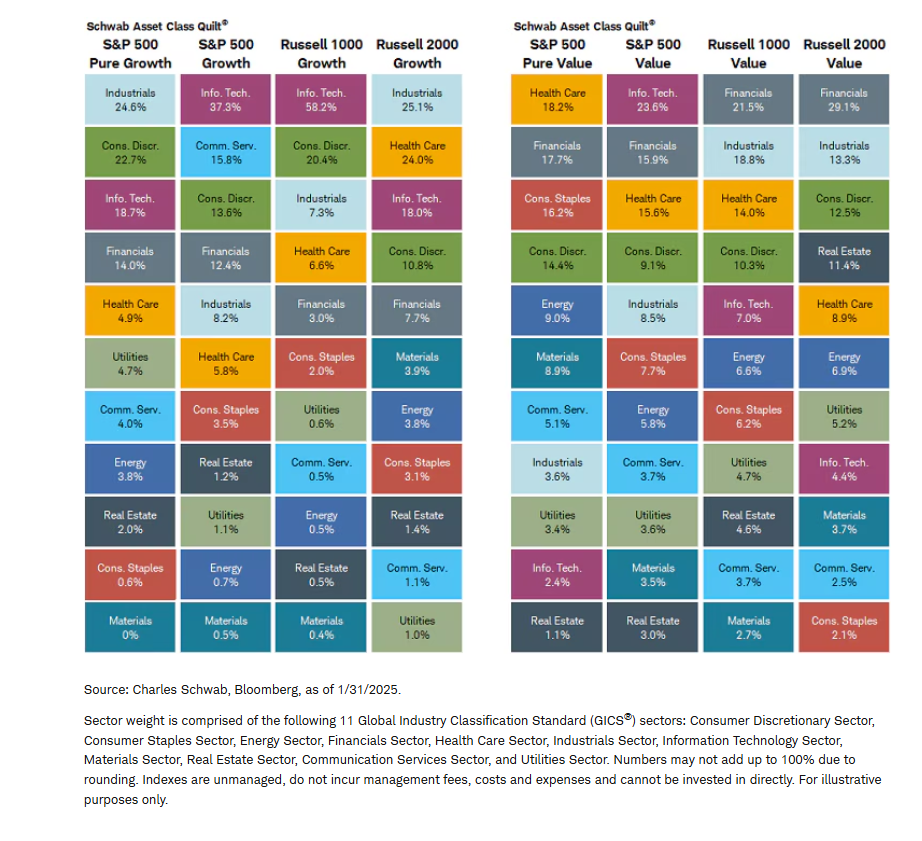
Using the Technology sector again as an example, notice the high weighting among the four growth indexes, which probably isn't a surprise. However, Technology is also the largest sector within the S&P 500 Value index. In fact, at nearly 24%, Technology is weightier in that value index more than it is in either the S&P 500 Pure Growth or Russell 2000 Growth indexes. Another example is the Industrials sector, which has the highest weight in two of the growth indexes, but also the second-highest weight in two of the value indexes. On the other hand, Communication Services is often considered a growth sector, yet its weight within the growth indexes is all over the map.
It's in the numbers
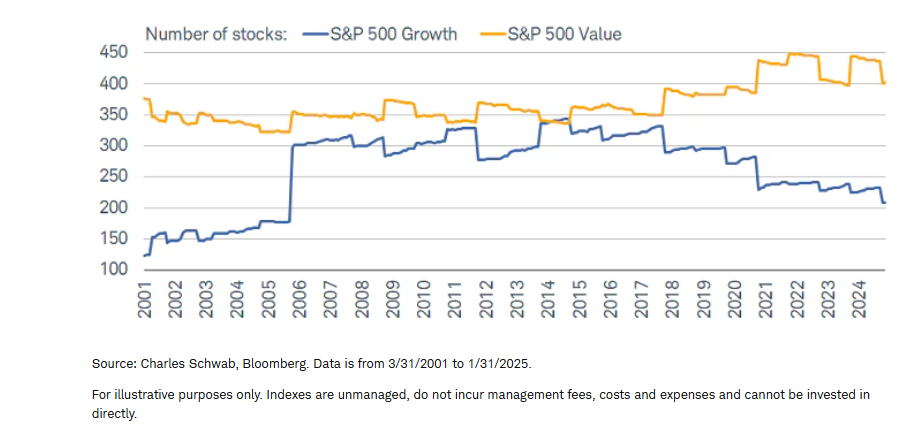
One can also look at shifts in the growth and value landscape over time by comparing how many stocks are in the indexes with how many actually exhibit growth and value factors. As shown below, the number of stocks in the S&P 500 Growth index has steadily declined from a peak about a decade ago, but still remains high relative to the inception of the index in 2001. Conversely, the number of stocks in the S&P 500 Value index, while off its peak, is still fairly high relative to history.
More value than growth
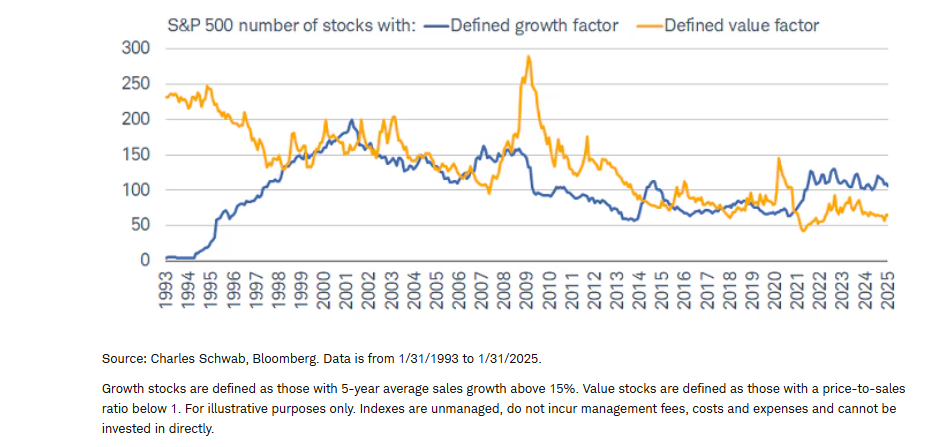
The story changes when screening for the number of stocks that have true characteristics of growth and value. This is by no means an exhaustive screen, as there are many ways to characterize and define each style, but for now we'll stick with simple definitions for each (shown in the footnote of the chart below). Within the overall S&P 500 index, the number of stocks with a defined value factor has declined more dramatically, especially since the peak associated with the global financial crisis. Those with a defined growth factor has been a bit steadier, though down from the peak during the dot com bust. This emphasizes the importance of taking a factor-based approach when it comes to growth and value. There are times (like today) when huge differences in indexes and factors can lead to dramatically different performance dynamics.
Less value in S&P 500
In sum
Pre-conceived notions of "growth" and "value" aren't always reflected in indexes labeled growth and value. That has been both exacerbated and emphasized in the post-pandemic era, especially for a sector like Technology, which is traditionally thought of as dominating the growth sphere but now has a hefty weight in some Value indexes (e.g., S&P 500 Value). These details matter at a time when sector leadership shifts remain rampant and swift—particularly when the sectors in question (i.e., Technology) constitute such a large portion of the market. This matters for investors who tend to take a more passive approach and track indexes, as changes in index construction have led to discrepancies between conventional wisdom and actual reality.
About the Authors
Liz Ann Sonders, Managing Director, Chief Investment Strategist
Liz Ann Sonders has a range of investment strategy responsibilities, from market and economic analysis to investor education, all focused on the individual investor.
A keynote speaker at numerous company and industry conferences, Liz Ann is regularly quoted in financial publications including The Wall Street Journal, The New York Times, Barron's, and the Financial Times, and she appears as a regular guest on CNBC, Bloomberg, CNN, CBS News, Yahoo! Finance, and Fox Business News programs. Liz Ann has been named "Best Market Strategist" by Kiplinger's Personal Finance and one of SmartMoney magazine's "Power 30." Barron's has named her to its "100 Most Influential Women in Finance" every year since the list's inception, and Investment Advisor has included her on the "IA 25," its list of the 25 most important people in and around the financial advisory profession. Liz Ann has also been named to Forbes' 50 Over 50.
In 1999, Liz Ann joined U.S. Trust—which was acquired by Schwab in 2000—as a managing director and member of its Investment Policy Committee. Previously, Liz Ann was a managing director and senior portfolio manager at Avatar Associates, an original division of the Zweig/Avatar Group. She holds an MBA in Finance from the Gabelli School of Business at Fordham University and a B.A. in Economics and Political Science from the University of Delaware.
Kevin Gordon, Director, Senior Investment Strategist
Kevin Gordon serves as the research associate for Schwab's Chief Investment Strategist Liz Ann Sonders. In addition to providing analysis on the U.S. economy and stock market for Schwab's clients, he helps develop deep-dive projects as well as content for Schwab's public website, internal business partners, and social media outlets. Kevin is a frequent guest on CNBC, Yahoo! Finance, Bloomberg TV, and CBS News, and has been quoted in The New York Times, Forbes, MarketWatch, CNN, The Wall Street Journal, and Bloomberg.
Prior to joining Schwab in 2019, Kevin gained experience in asset allocation research at an investment advisory firm, and worked for a U.S. senator in Washington, D.C. He graduated magna cum laude from Pepperdine University, where he co-managed a student-run investment fund and co-authored academic publications on politics and the economy. Kevin is currently an MBA candidate at New York University's Stern School of Business. He holds a B.A. in Economics and Political Science from Pepperdine University.
Kevin is a member of the President’s Advisory Council for Almost Home Kids affiliated with Ann & Robert H. Lurie Children's Hospital of Chicago.
The information provided here is for general informational purposes only and should not be considered an individualized recommendation or personalized investment advice. The investment strategies mentioned here may not be suitable for everyone. Each investor needs to review an investment strategy for his or her own particular situation before making any investment decision.
All expressions of opinion are subject to change without notice in reaction to shifting market conditions. Data contained herein from third-party providers is obtained from what are considered reliable sources. However, its accuracy, completeness or reliability cannot be guaranteed. Examples provided are for illustrative purposes only and not intended to be reflective of results you can expect to achieve.
Past performance is no guarantee of future results, and the opinions presented cannot be viewed as an indicator of future performance.
Investing involves risk, including loss of principal.
Performance may be affected by risks associated with non-diversification, including investments in specific countries or sectors. Additional risks may also include, but are not limited to, investments in foreign securities, especially emerging markets, real estate investment trusts (REITs), fixed income, municipal securities including state specific municipal securities, small capitalization securities and commodities. Each individual investor should consider these risks carefully before investing in a particular security or strategy.
All corporate names and market data shown above are for illustrative purposes only and are not a recommendation, offer to sell, or a solicitation of an offer to buy any security.
Diversification and asset allocation strategies do not ensure a profit and cannot protect against losses in a declining market.
Small-cap stocks are subject to greater volatility than those in other asset categories.
Commodity-related products carry a high level of risk and are not suitable for all investors. Commodity-related products may be extremely volatile, may be illiquid, and can be significantly affected by underlying commodity prices, world events, import controls, worldwide competition, government regulations, and economic conditions.
Schwab does not recommend the use of technical analysis as a sole means of investment research.
This information provided here is for general informational purposes only and is not intended to be a substitute for specific individualized tax, legal, or investment planning advice. Where specific advice is necessary or appropriate, you should consult with a qualified tax advisor, CPA, Financial Planner, or Investment Manager.
Source: Bloomberg Index Services Limited. BLOOMBERG® is a trademark and service mark of Bloomberg Finance L.P. and its affiliates (collectively "Bloomberg"). Bloomberg or Bloomberg's licensors own all proprietary rights in the Bloomberg Indices. Neither Bloomberg nor Bloomberg's licensors approves or endorses this material or guarantees the accuracy or completeness of any information herein, or makes any warranty, express or implied, as to the results to be obtained therefrom and, to the maximum extent allowed by law, neither shall have any liability or responsibility for injury or damages arising in connection therewith.
Indexes are unmanaged, do not incur management fees, costs, and expenses, and cannot be invested in directly. For additional information, please see schwab.com/indexdefinitions.
A message from Advisor Perspectives and VettaFi: To learn more about this and other topics, check out our podcasts.
Membership required
Membership is now required to use this feature. To learn more:
View Membership BenefitsSponsored Content
Live Virtual Event: Join Now

Upcoming Virtual Events View All


