Hard to Handle: A Look at Hard vs. Soft Data
Membership required
Membership is now required to use this feature. To learn more:
View Membership BenefitsThe "pandemicycle" (yes, that's a new term from us) has been unique in myriad ways; including multiple divergences within the economy. Divergences have occurred within the economy between goods and services, cyclical and noncyclical segments, and discretionary and nondiscretionary categories of spending; among others. A divergence we're tackling today is between soft and hard economic data. First, the definitions:
- Soft economic data refers to surveys, sentiment indicators, and expectations, such as consumer confidence, business outlook surveys, and Purchasing Managers' Indexes (PMIs).
- Hard economic data refers to measurable and objective metrics like gross domestic product (GDP), employment readings, retail sales, and industrial production.
A widely watched metric from Bloomberg is its Economic Surprise Index which tracks the difference between actual data releases and economists' forecasts. Bloomberg also separates them into hard data and soft data components, shown below.
Surprise!
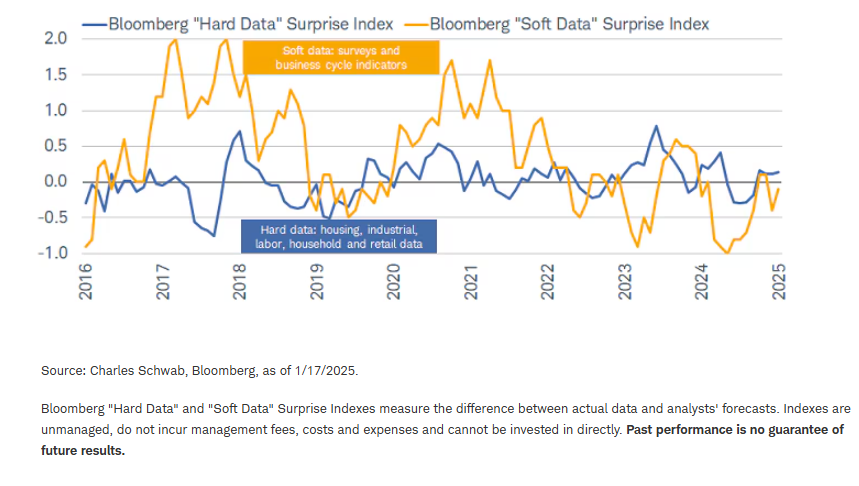
There are a couple of interesting periods over the past decade, as shown above, including the surge in soft data surprises in 2017 (typically seen as tied to President Trump's win in late 2016). While hard data surprises did start to lift in late 2017, they remained well below soft data surprises throughout 2017 and 2018. Fast forward to the pandemic, another stark divergence opened up—again in favor of soft data surprises—as the economy started to find its footing in the latter part of 2020 into 2021.
Given elevated recession concerns, alongside a bear market in stocks in 2022, soft data surprises played catch-down to hard data surprises—ultimately with a couple of meaningful divergences in favor of the hard data in 2023 and 2024. Interestingly, although there has been a recent lift in soft data surprises, for now it pales in comparison to what occurred during the post-2016 election period.
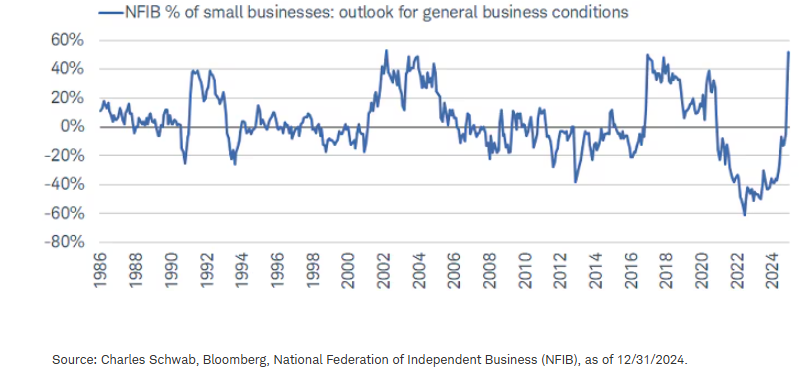
Small business optimism on fire
As noted, there is a more muted increase in soft data surprises relative to Trump's prior win, where we have seen an historically significant surge in small businesses' outlook for "general business conditions" per the latest monthly data out of the National Federation of Independent Business (NFIB), as shown below.
Small business optimism on a tear
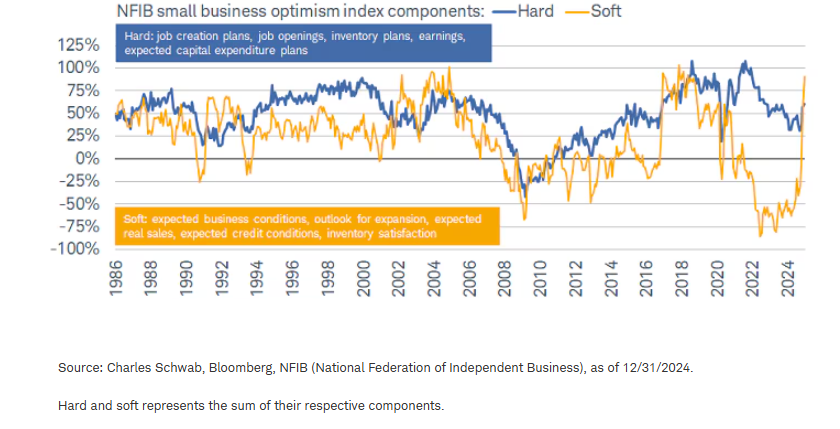
NFIB also breaks out its data into soft and hard components, as shown below. Clearly the parabolic spike in optimism among the soft components has swamped what has been a generally lower trend for the hard components. The most recent uptick in optimism around the hard data bears watching as it would be a more palatable way for the divergence to correct than if optimism around the soft data turns out to be less grounded in reality.
Soft leapfrogs hard
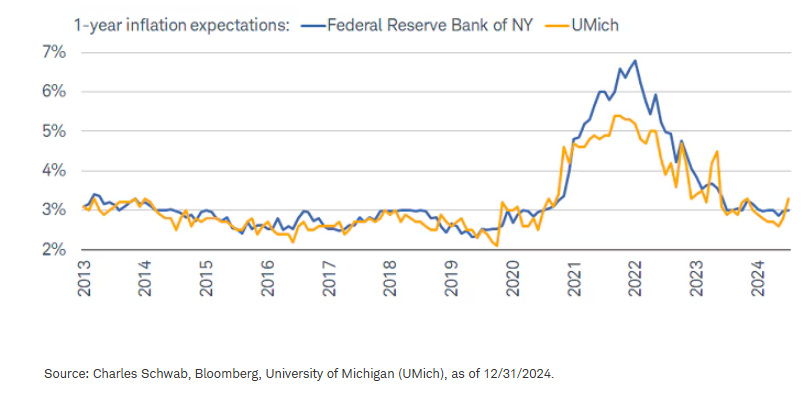
Inflation remains in focus
Divergences have abounded within inflation data, as mentioned; including between official estimates and consumers' expectations. Shown below via the blue line is the Federal Reserve Bank of New York (FRBNY) one-year inflation expectations over time. From a peak of nearly 7% in 2022, expectations have been trending lower ever since, albeit with a flatter trend over the past few months. Conversely, although consumers' inflation expectations (via University of Michigan's Consumer Sentiment report) never reached the height of FRBNY's, there has been a notable shift up recently. The yellow line shows the skittishness of consumers' expectations given three bouts of sharp acceleration over the past two years.
Consumers skittish re: inflation
If a textbook case existed for the bout of inflation we endured a few years ago, the closest one would be the experience in the 1970s and early 1980s—especially on the goods side of the economy. Of course, no two periods are the same (which rings true for any chart looking at inflation), but as shown in the chart below, core goods inflation—in year-over-year (y/y) terms—reached a peak of 10.5% in 1974. At the same time, and as expected, consumers' perceptions of buying conditions for large household durable goods plummeted.
A similar dynamic unfolded in 2021 and 2022. Yet, the rebound in confidence has not been strong. In fact, core goods inflation is back to pre-pandemic levels, yet consumers still feel that buying conditions are as bad as they were at some points in the financial crisis and/or in the depths of the pandemic lockdown phase. Contrast that with the early 1980s: by the time core goods inflation returned to its pre-spike level, confidence had rebounded completely.
Not-so-good time for goods
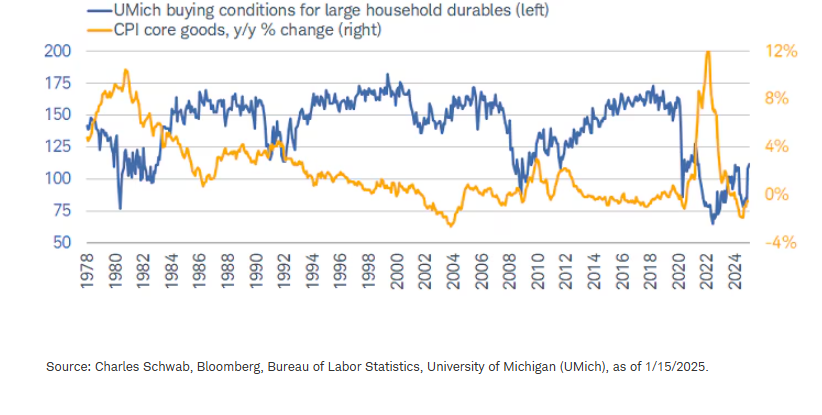
Perhaps that's because a slew of modern-day consumers haven't experienced a significant inflation surge in their lifetime, or because the spike from the low in 2020 to the high in 2022 was much larger in percentage-point terms (-1.1% to +12.3%) compared to decades ago. Regardless, the massive shift in price levels over a relatively short timeframe is likely the main culprit, in our opinion.
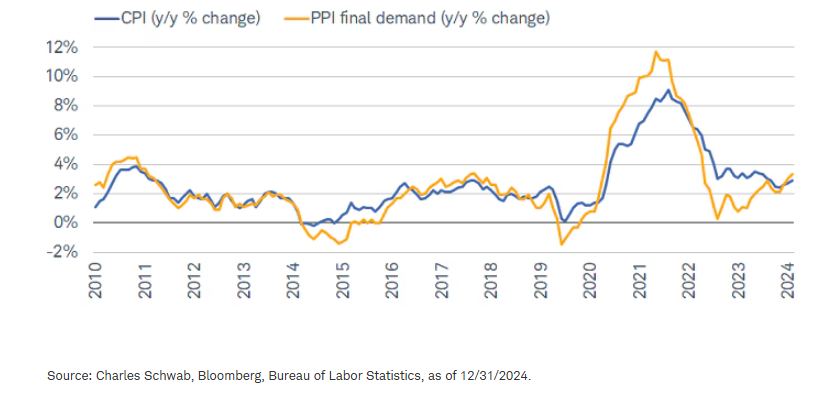
Not only that, but there isn't yet confidence (from the Federal Reserve or consumers) that broader measures of inflation are settling back to pre-pandemic averages. That is evident when looking at the Consumer Price Index (CPI) and Producer Price Index (PPI), shown below. While inflation has certainly made progress from peaks of nearly 10% (for CPI) and nearly 12% (for PPI), price pressures have bounced back of late, not yet settling in a zone consistent with the Fed's 2% target.
A higher inflation floor?
Given the surge in pricing on both the consumer and producer sides, that means businesses have not been immune to the decline in confidence over the past few years. That has been evident across myriad surveys, especially the manufacturing outlook that comes from the Philadelphia Federal Reserve Bank (PFRB).
As shown below, PFRB survey respondents reported (on a net basis) a contraction in activity for nearly the entire period from the summer of 2022 through the winter of 2023. While they also reported an easing in price pressures (shown via the yellow line), that clearly wasn't good enough to lift overall confidence—until recently. The January report showed a hyperbolic increase in firms' perceptions of current business conditions; it was the second-largest increase on record, and somewhat consistent with the aforementioned NFIB outlook spike.
Getting sunny in Philadelphia
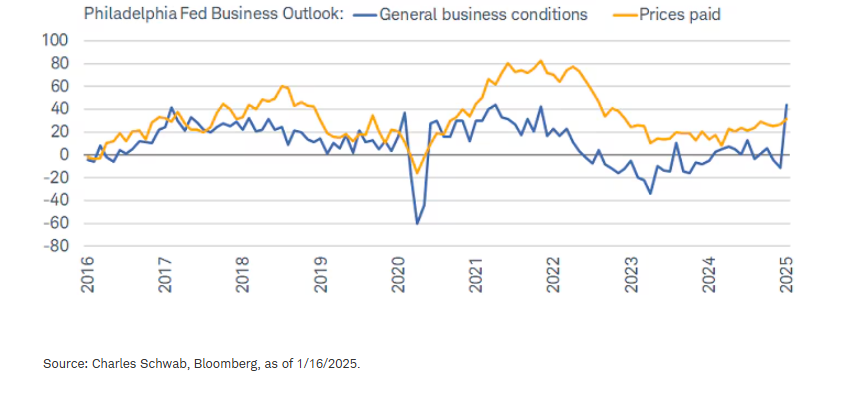
Whether the move was driven by politics or not, we don't think it should be extrapolated at this stage. First, even if it is tied to the change in the administration, there aren't any concrete results manufacturers can analyze yet—not least because the survey data was collected before the inauguration. Second, the region surveyed is quite small—encompassing the southern half of New Jersey, the eastern half of Pennsylvania, and Delaware—which means it is not at all representative of the whole country.
The latter point matters when looking at the Institute for Supply Management (ISM) Manufacturing Index, which has much broader, national coverage. As shown below, the index has been below 50 (in contraction) in every month since November 2022 except one (March 2024). That hasn't been consistent with a marked drop in industrial production (ISM's hard data counterpart), though. Year-over-year growth has been stubbornly stable around 0% for the better part of the past two years. In and of itself, that isn't great, but when overlaying the soft data (from ISM), one would think the decline would be much worse.
Still in a soft (data) patch
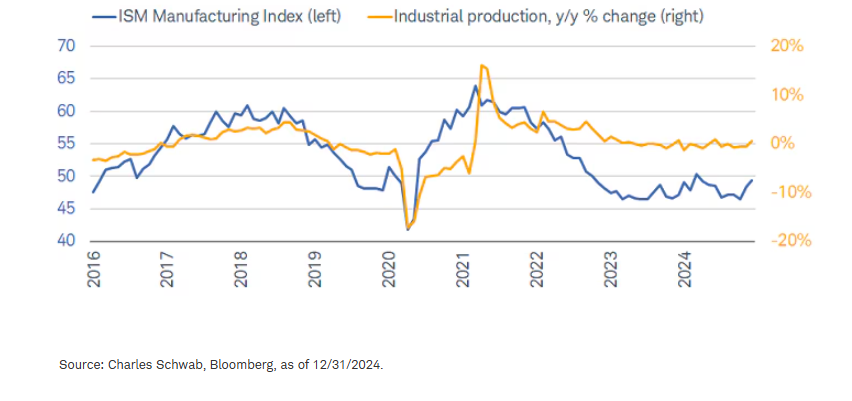
If anything, a coming recovery in soft data would likely be warranted, considering the hard data's resilience. With the economy growing at a respectable pace over the past couple years, it's clear that the persistent malaise in several soft data metrics hasn't been fully justified. Of course, the initial decline made sense given the sour inflation backdrop, but any coming rebound in the soft data should be treated as a catch-up, not a sign of an impending economic boom.
In sum
This "pandemicycle" has been disorienting in many ways, especially when it comes to the relationship between hard and soft economic data. Whether survey-based indicators have lost their touch is still up for debate—and probably a question that only applies to this unique cycle. Eventually, we think they'll reassert their importance and reliability; but the pandemic-driven gap needs to close, hopefully in favor of the hard data. Admittedly, for now, trends will likely remain murky and volatile in the near-term, given the mix of post-election hype and policy reality.
About the Authors
Liz Ann Sonders, Managing Director, Chief Investment Strategist
Liz Ann Sonders has a range of investment strategy responsibilities, from market and economic analysis to investor education, all focused on the individual investor.
A keynote speaker at numerous company and industry conferences, Liz Ann is regularly quoted in financial publications including The Wall Street Journal, The New York Times, Barron's, and the Financial Times, and she appears as a regular guest on CNBC, Bloomberg, CNN, CBS News, Yahoo! Finance, and Fox Business News programs. Liz Ann has been named "Best Market Strategist" by Kiplinger's Personal Finance and one of SmartMoney magazine's "Power 30." Barron's has named her to its "100 Most Influential Women in Finance" every year since the list's inception, and Investment Advisor has included her on the "IA 25," its list of the 25 most important people in and around the financial advisory profession. Liz Ann has also been named to Forbes' 50 Over 50.
In 1999, Liz Ann joined U.S. Trust—which was acquired by Schwab in 2000—as a managing director and member of its Investment Policy Committee. Previously, Liz Ann was a managing director and senior portfolio manager at Avatar Associates, an original division of the Zweig/Avatar Group. She holds an MBA in Finance from the Gabelli School of Business at Fordham University and a B.A. in Economics and Political Science from the University of Delaware.
Kevin Gordon, Director, Senior Investment Strategist
Kevin Gordon serves as the research associate for Schwab's Chief Investment Strategist Liz Ann Sonders. In addition to providing analysis on the U.S. economy and stock market for Schwab's clients, he helps develop deep-dive projects as well as content for Schwab's public website, internal business partners, and social media outlets. Kevin is a frequent guest on CNBC, Yahoo! Finance, Bloomberg TV, and CBS News, and has been quoted in The New York Times, Forbes, MarketWatch, CNN, The Wall Street Journal, and Bloomberg.
Prior to joining Schwab in 2019, Kevin gained experience in asset allocation research at an investment advisory firm, and worked for a U.S. senator in Washington, D.C. He graduated magna cum laude from Pepperdine University, where he co-managed a student-run investment fund and co-authored academic publications on politics and the economy. Kevin is currently an MBA candidate at New York University's Stern School of Business. He holds a B.A. in Economics and Political Science from Pepperdine University.
Kevin is a member of the President’s Advisory Council for Almost Home Kids affiliated with Ann & Robert H. Lurie Children's Hospital of Chicago.
The information provided here is for general informational purposes only and should not be considered an individualized recommendation or personalized investment advice. The investment strategies mentioned here may not be suitable for everyone. Each investor needs to review an investment strategy for his or her own particular situation before making any investment decision.
All expressions of opinion are subject to change without notice in reaction to shifting market conditions. Data contained herein from third-party providers is obtained from what are considered reliable sources. However, its accuracy, completeness or reliability cannot be guaranteed. Examples provided are for illustrative purposes only and not intended to be reflective of results you can expect to achieve.
Past performance is no guarantee of future results and the opinions presented cannot be viewed as an indicator of future performance.
Investing involves risk, including loss of principal.
The policy analysis provided by the Charles Schwab & Co., Inc., does not constitute and should not be interpreted as an endorsement of any political party.
Performance may be affected by risks associated with non-diversification, including investments in specific countries or sectors. Additional risks may also include, but are not limited to, investments in foreign securities, especially emerging markets, real estate investment trusts (REITs), fixed income, municipal securities including state specific municipal securities, small capitalization securities and commodities. Each individual investor should consider these risks carefully before investing in a particular security or strategy.
All corporate names and market data shown above are for illustrative purposes only and are not a recommendation, offer to sell, or a solicitation of an offer to buy any security.
Diversification strategies do not ensure a profit and do not protect against losses in declining markets.
Source: Bloomberg Index Services Limited. BLOOMBERG® is a trademark and service mark of Bloomberg Finance L.P. and its affiliates (collectively "Bloomberg"). Bloomberg or Bloomberg's licensors own all proprietary rights in the Bloomberg Indices. Neither Bloomberg nor Bloomberg's licensors approves or endorses this material or guarantees the accuracy or completeness of any information herein, or makes any warranty, express or implied, as to the results to be obtained therefrom and, to the maximum extent allowed by law, neither shall have any liability or responsibility for injury or damages arising in connection therewith.
Indexes are unmanaged, do not incur management fees, costs, and expenses, and cannot be invested in directly. For additional information, please see schwab.com/indexdefinitions.
0125-JKEA
A message from Advisor Perspectives and VettaFi: To learn more about this and other topics, check out our podcasts.
Membership required
Membership is now required to use this feature. To learn more:
View Membership BenefitsSponsored Content
Upcoming Virtual Events View All


