As the Fed Provides a Clearer Fiscal Policy Roadmap, Our Models Signal for Less Risk: 3Q24 Market Review
Membership required
Membership is now required to use this feature. To learn more:
View Membership BenefitsMarkets broadened as we anticipated, and our Decathlon strategies were able to take advantage.
With Central Banks around the world lowering their policy interest rates, the third quarter saw a broad-based rally in all asset-classes and geographies with the strongest performance taking place in previously lagging categories, like small capitalization and value stocks, emerging markets (especially China), and all types and maturities of bonds.
Our strategies performed well in the quarter. We rotated from the market leading technology sectors into the laggard small-capitalization and value categories shortly before the herd and rode the trend for the majority of the rally.
We are entering this quarter with the signal to tap the brakes a bit.
After the strong rally, our investment systems are currently advising a reduction in risk-appetite. As a result, we recently positioned our portfolios more cautiously, lowering our equity exposure by 10% in our more aggressive models. For the near term, our models favor a significantly narrower selection of equity categories than three months ago, with the most attractive ETFs being in the financial services, healthcare (biotech), and electrical/ industrial sectors as well as India. Bonds of all categories are ranked highly, offering a modest incremental return if we have a market pause, and possibly, significant protection and relative performance if there is an adverse geopolitical event or market correction.
The third quarter became a story of China and the Federal Reserve (Fed).
Despite titling our last quarterly letter “Betting on a Broadening”, we never could have anticipated the near perfect reversal of market leadership we saw just days later at the onset of the third quarter. While the kindling was in place, it was Jerome Powell’s July speech, all but assuring imminent rate cuts, that provided the spark. Value outperformed growth, small caps outperformed large, and international outperformed domestic stocks[1]. This was a welcome reprieve against what had become a historically concentrated equity market. After China’s recent surge it is now amazingly far and away the best-performing equity market of the year.
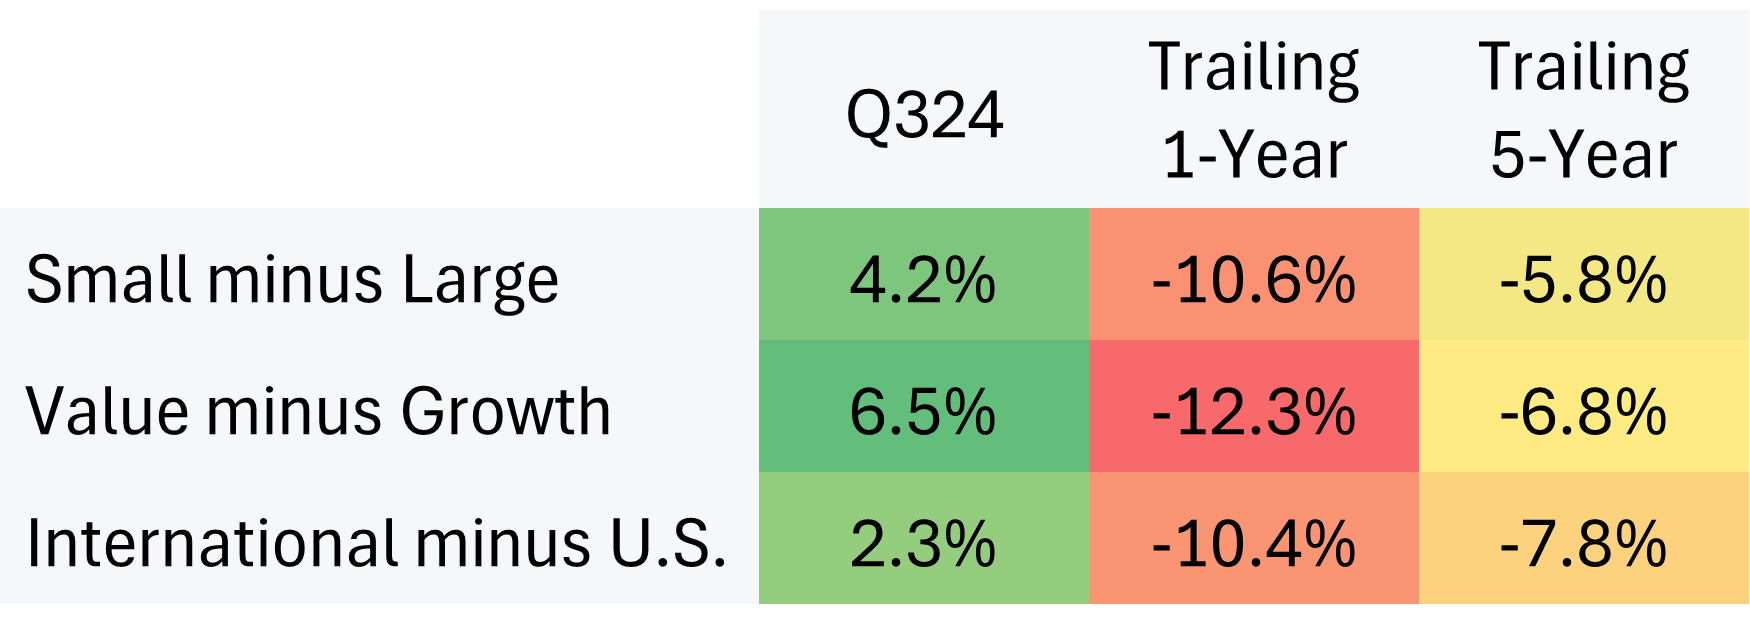
Source: Bloomberg data 9/30/2019 through 9/30/2024. “Small caps” is referencing the S&P 600 Index; “Large cap” is referencing the S&P 500 Index; “Value” is referencing the CRSP US Large Cap Value Index; “Growth” is referencing CRSP US Large Cap Growth Index; U.S. is referencing S&P 500 Index; and International” is referencing MSCI All-Country World Ex-US Index
The reversal in leadership did not come at the cost of weak performance for the prior leaders as nearly all assets did well in the quarter, driven by an expectation of better odds for a “soft landing” scenario. Economic growth and employment were weaker, but not too weak, while inflation has been subdued for some time. We suggested that a broadening would be welcome for our strategies, and it was, as performance amongst our higher-risk models was particularly strong. This quarter, the equities in our investment pool provided a tailwind to our performance as the average equity outperformed market cap indices. Most of our best-performing picks were within the financial sector, a sector whose fate is inextricably linked to economic health and interest rate policy. Energy provided the lone material performance detractor for the higher-risk models, while a general lack of fixed income duration, and the usage of alternatives, impacted the conservative model versus its target benchmark.
We expect investors to continue to shift their focus from inflation to growth.
At the beginning of the year, we stated that we believed investors’ focus would shift from inflation to growth. Now that Fed policy has shifted, we expect this shift to continue into 2025. While we believe the Fed could have lowered rates sooner, we are much more comfortable with the Fed’s narrative around interest rate policy after the last meeting. It is obvious that, on the margin, they are more focused on the risks to growth than inflation. It remains to be seen if the effects of higher rates will ultimately continue to cause pain on a lag or whether rate cuts will provide an immediate improvement in interest-sensitive areas such as housing and autos, which have had their demand substantially curtailed.
As the market has moved considerably towards the prospect of a soft landing, we don’t see a compelling risk/reward for substantial equity risk. We believe, however, that intra-sector dispersion will increase, since the economy going forward is likely to be very different from the one of the past few years, potentially creating new relative winners and losers.
While large-cap companies (particularly the very largest) have been able to navigate higher inflation with relative ease, the impact on smaller companies has been far more pronounced. Analogous to how top quintile households had an easier time absorbing inflation than bottom quintile. With inflation now in the rearview mirror, it’s possible a larger array of companies stands to benefit from a more predictable price environment.
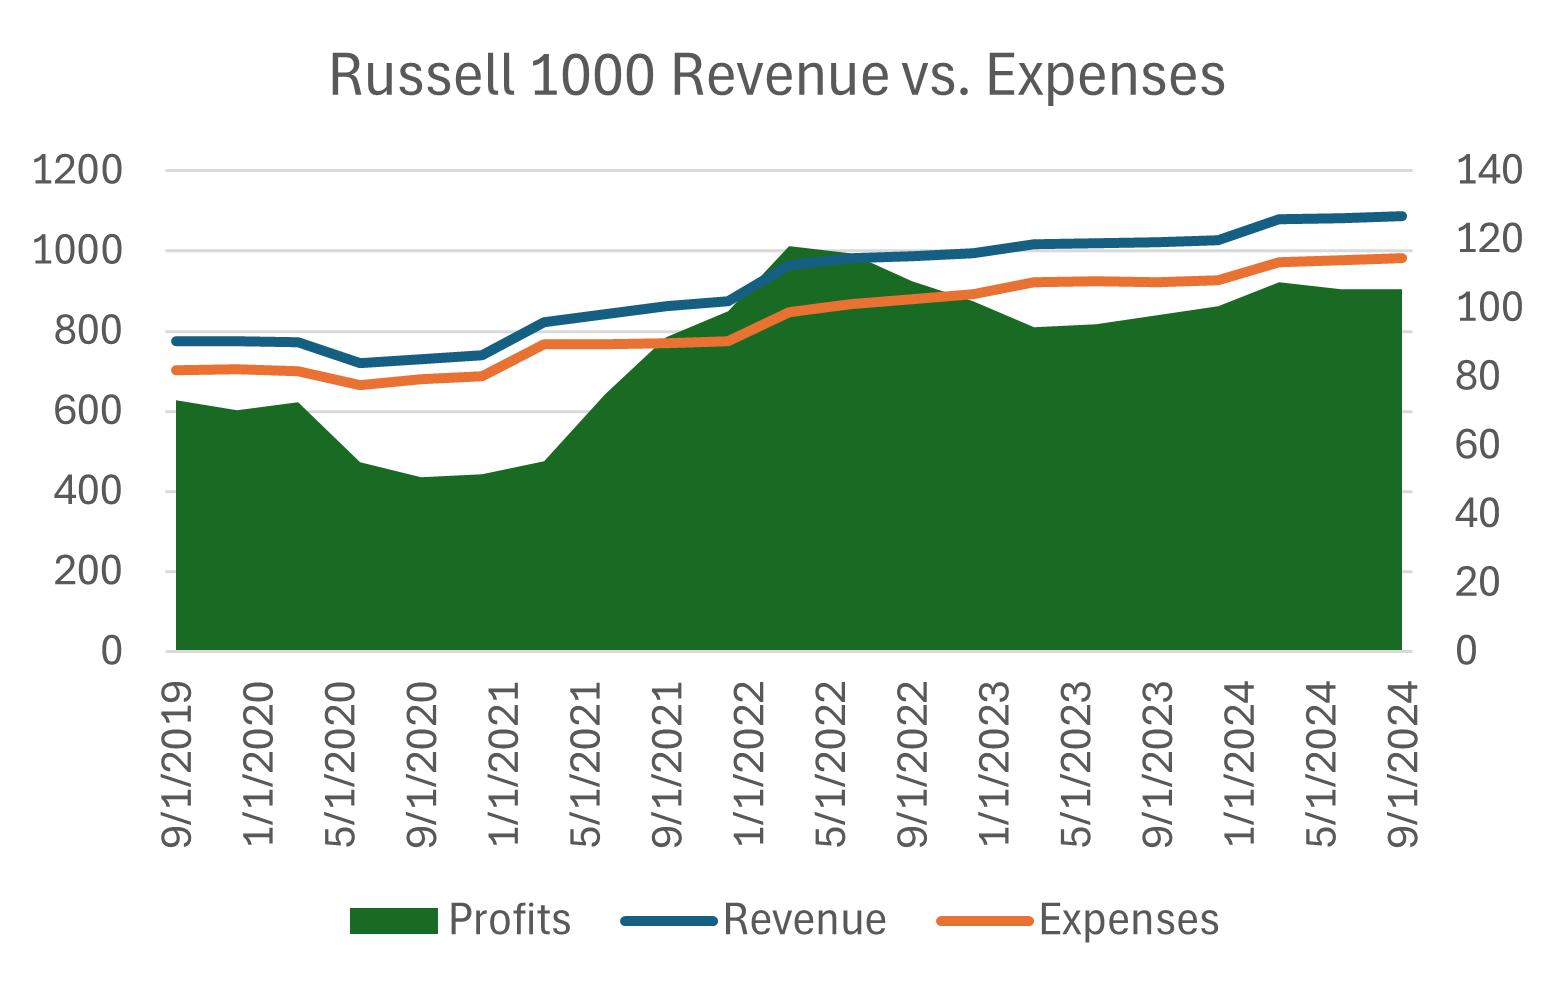
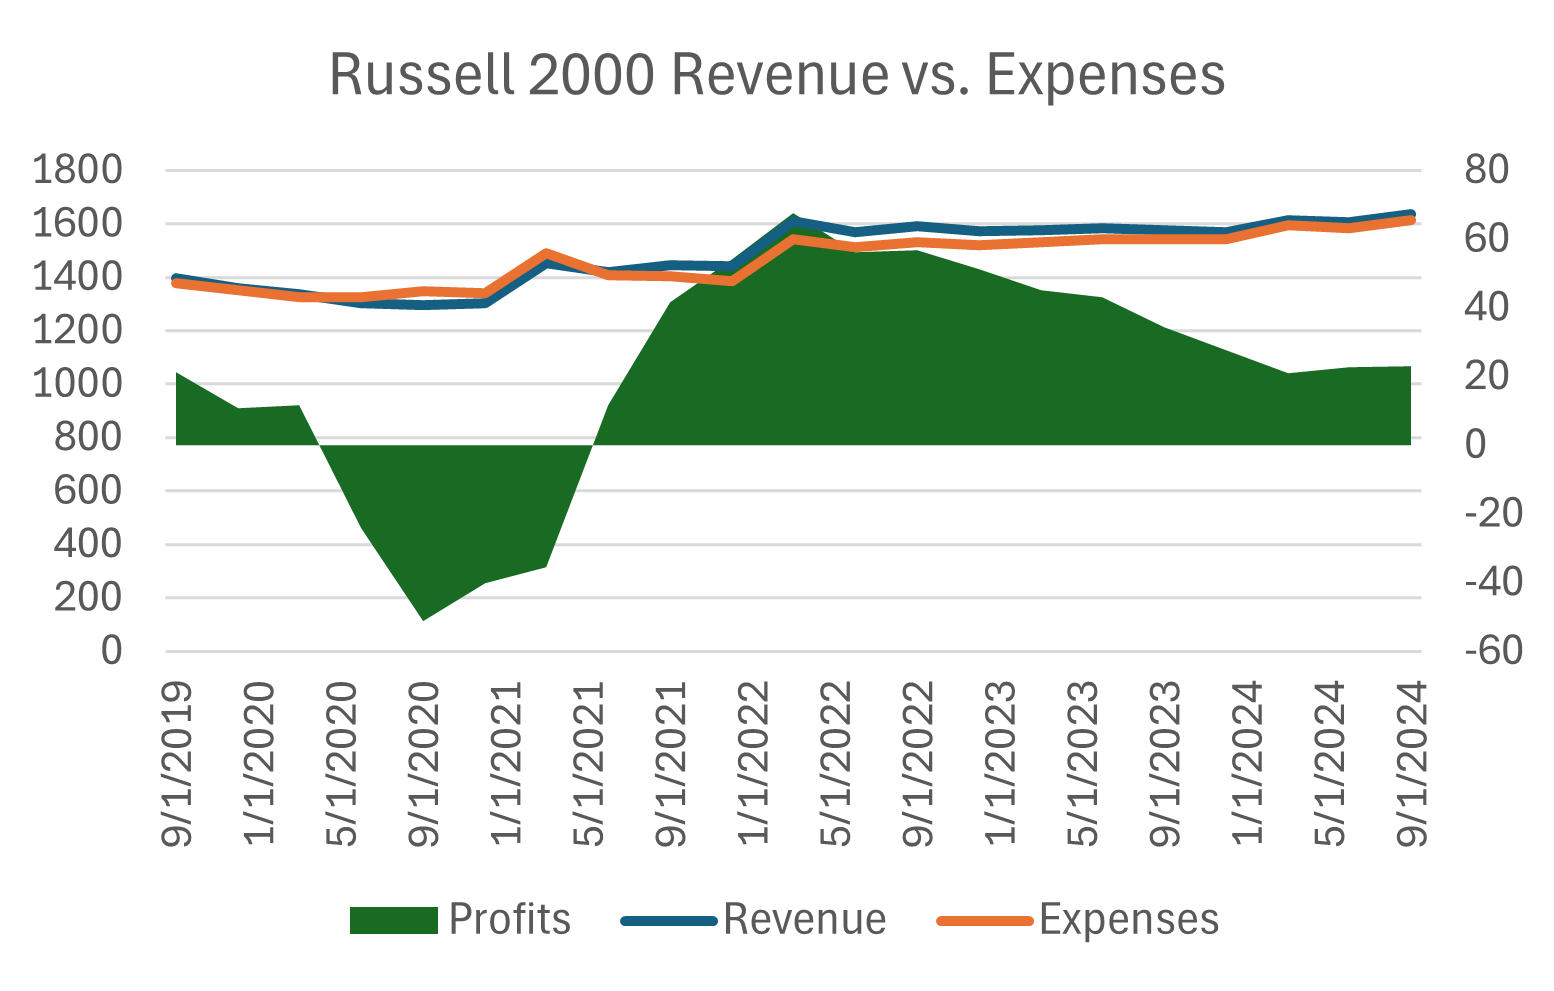
Source: Bloomberg, Russell 1000 and 2000 indices for 5-year period 9/30/2019 through 9/30/2024
Negatives
* Equities have run ahead of fundamentals. Investors have made large gains in a short time in many asset categories without having to wait for the underlying companies or economic facts to deliver.
Stocks prices have increased despite near-term earnings expectations decreasing, with investors pushing out improvements into the less predictable future.
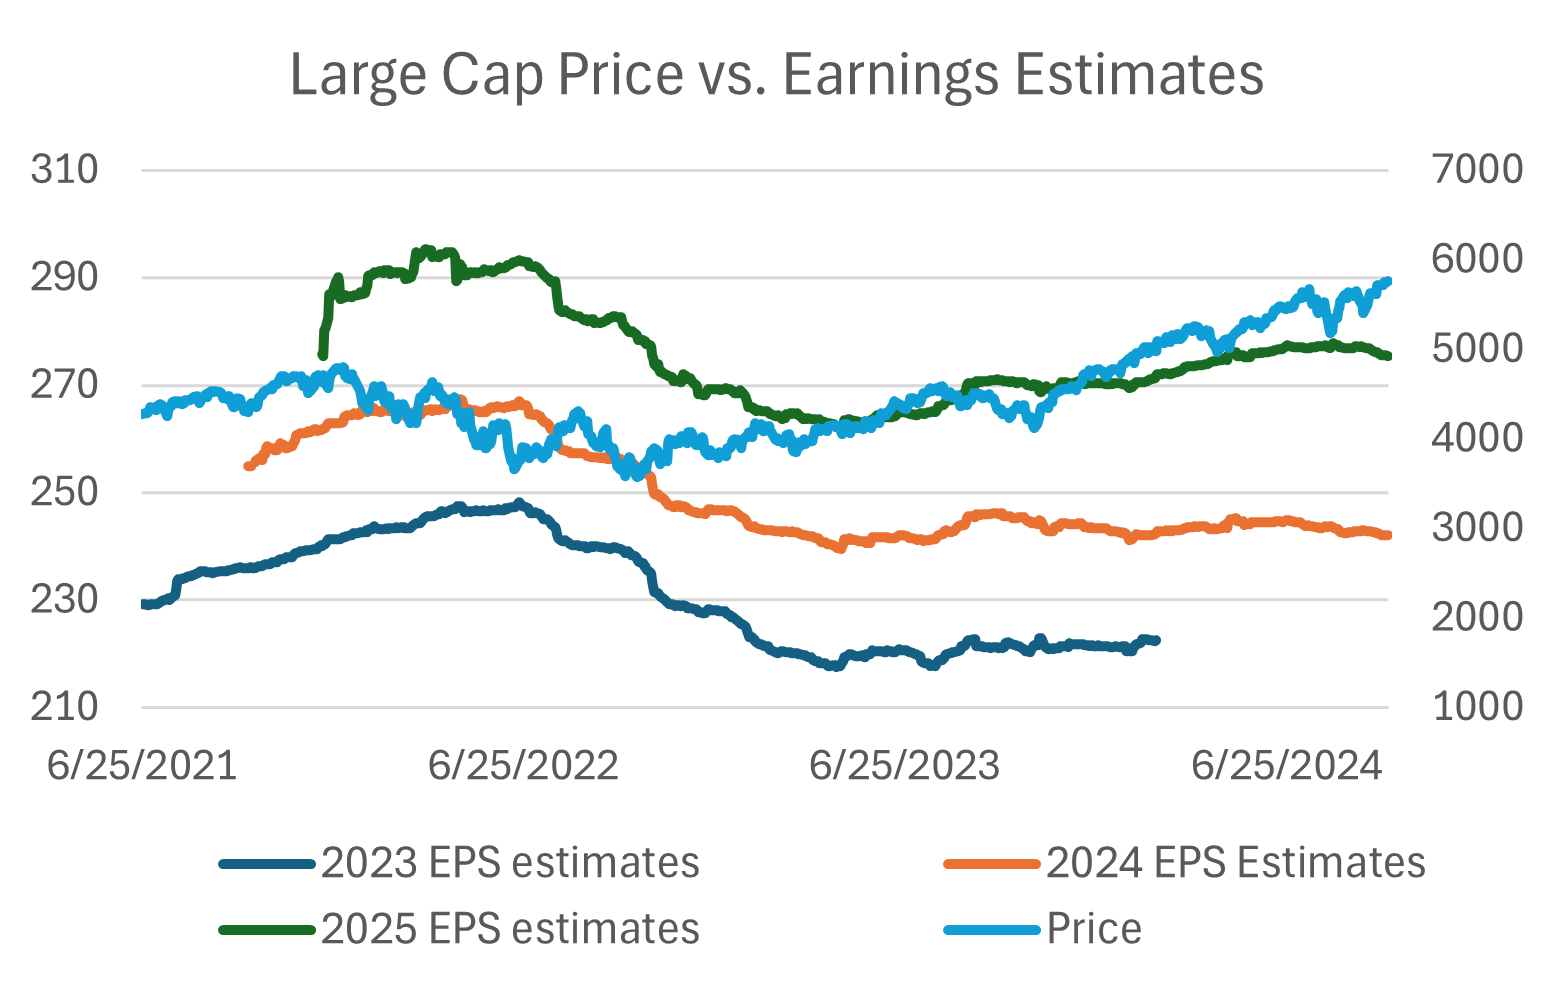
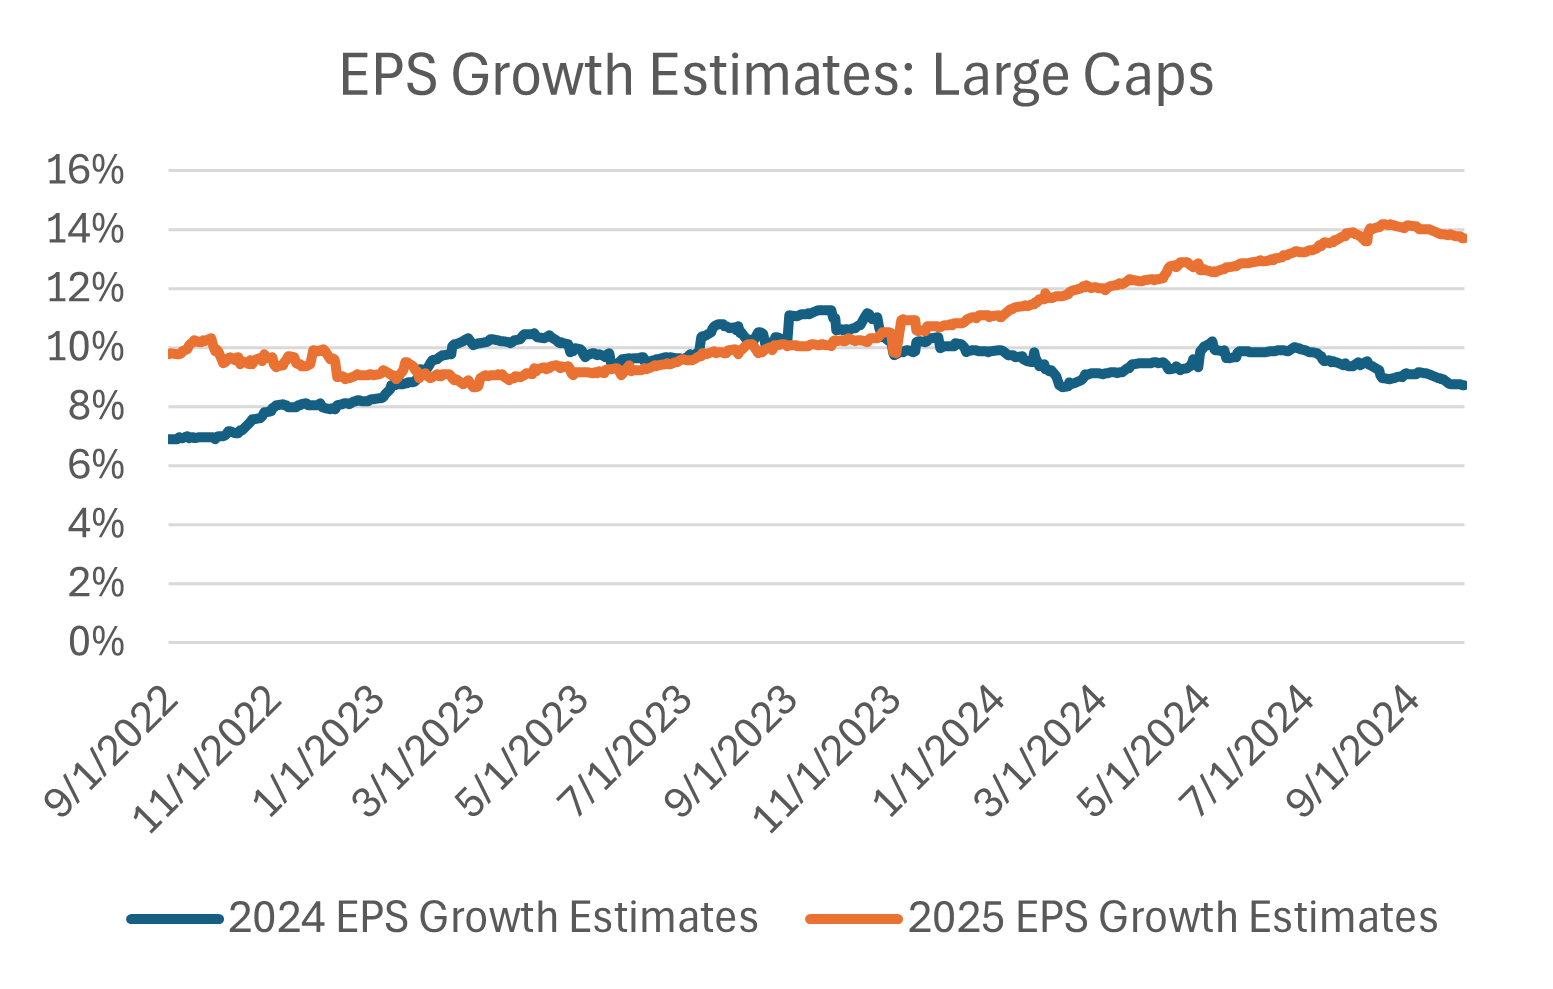
Source: Bloomberg, earnings estimates from 9/30/2021 through 9/3/2024, large cap index is the S&P 500
This is even more acute for smaller-cap companies, posing a risk to the broadening thesis.
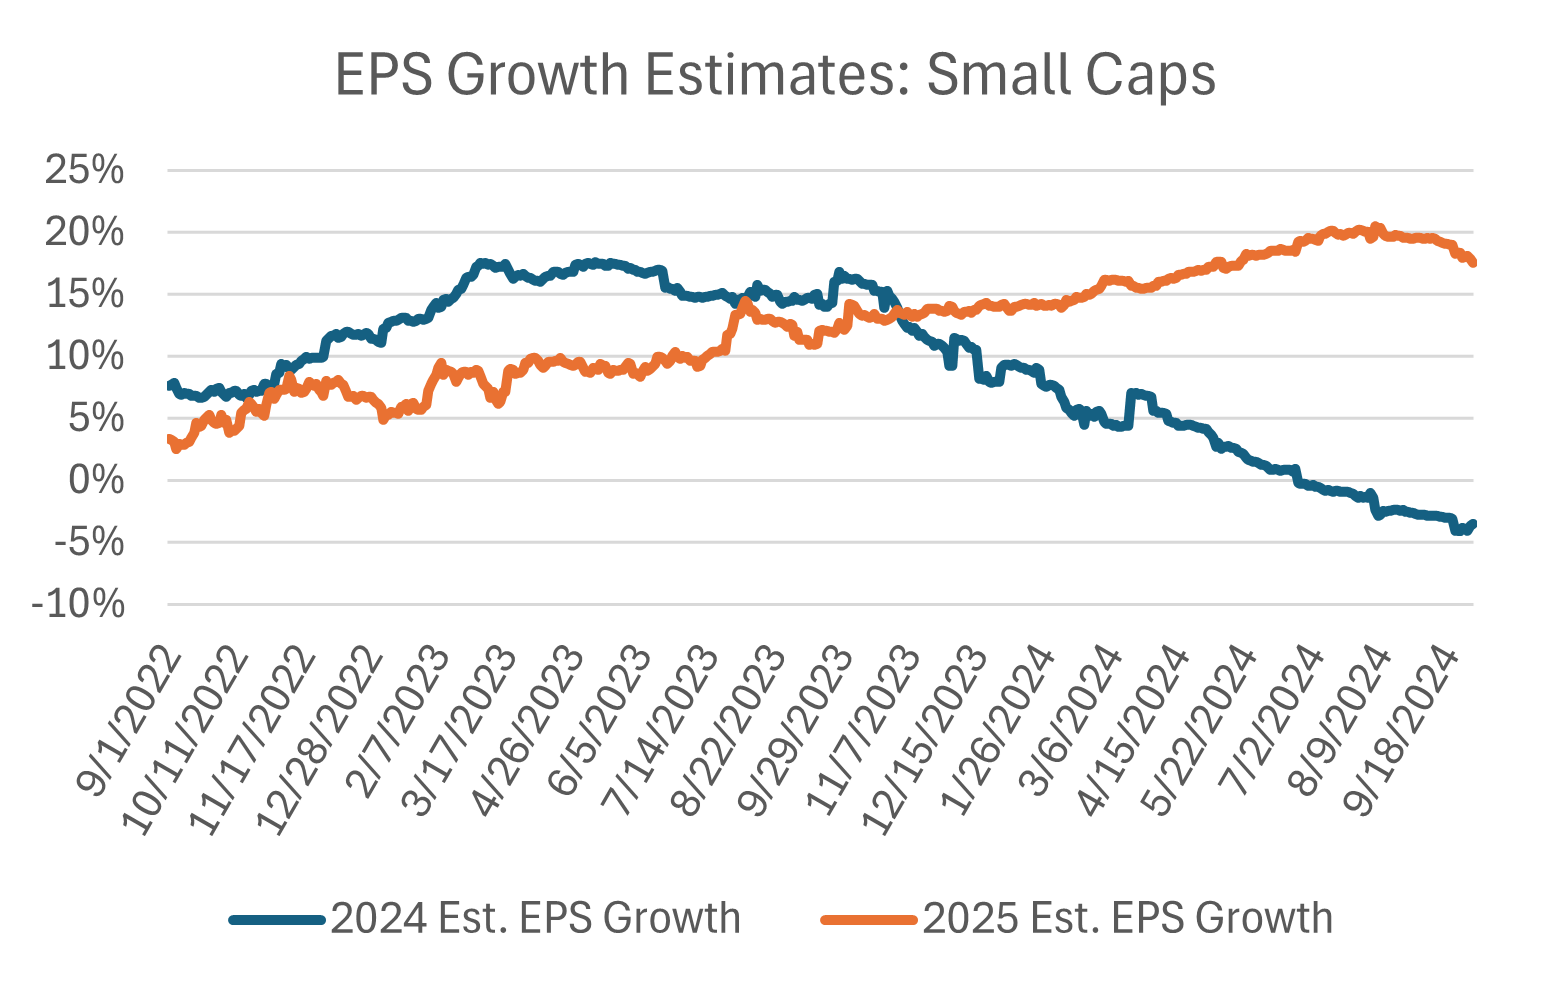
Source: Bloomberg, earnings estimates from 9/30/2021 through 9/3/2024, small cap index is the S&P 600
* High valuations: The entire S&P 500 trades for 23.8x 2024 earnings[2], but multiples for the highest quality companies are even higher. The largest, Apple, sports a P/E of 34.7[3], among the highest in the companies’ own history.
* Economic fatigue: Hiring is slowing. Both consumer credit and auto loan delinquencies are on the rise. There’s been a noticeable weakening of the low-end consumer.
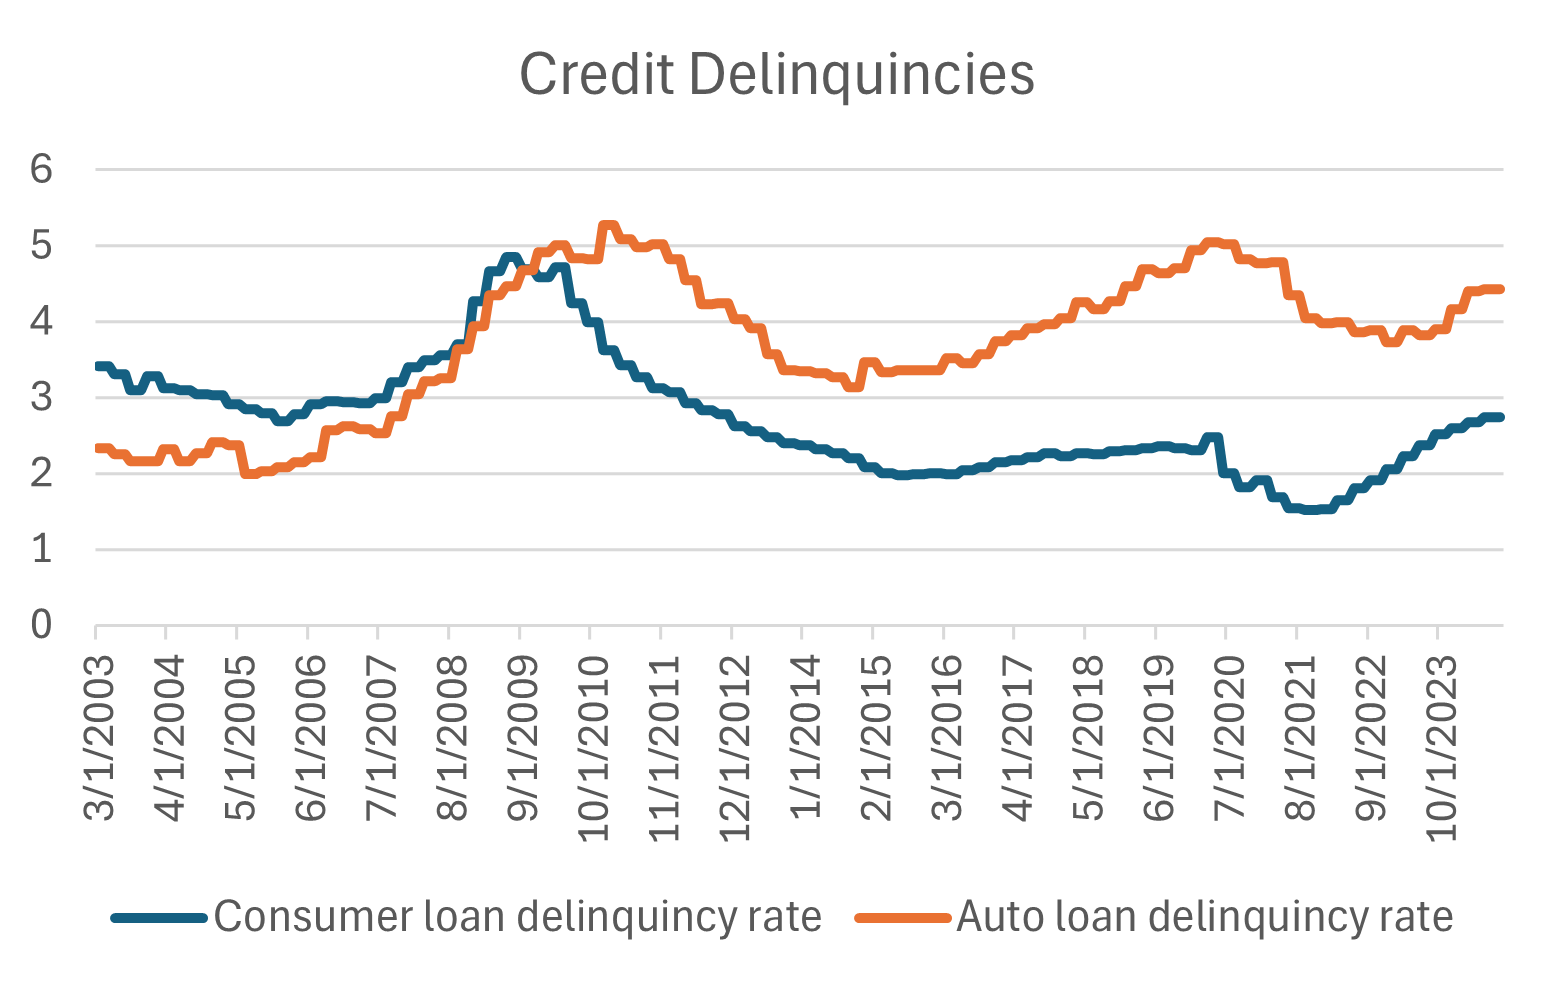
Source: Bloomberg data for 3/31/2003 through 9/30/2024, for all consumer loans and auto loans.
*On-going political uncertainty ahead of U.S. Elections.
* U.S. Government finances continue to appear unsustainable. In rough per-person terms, at a $1.6 trillion annual deficit, the government is spending $400 per month more than it is collecting in taxes. Neither presidential candidate appears willing to tackle this issue as the prospective options all require near-term economic pain.
* Geopolitical tensions remain extraordinary. Russia/Ukraine, Israel/Hamas (increasingly Israel/Hamas/Hezbollah/Iran), US economic restrictions on commerce with China.
* Possible contagion in organized labor strikes resulting in economic disruption and broad wage and generalized inflation. Wages are now firmly ahead of overall inflation which is good for aggregate consumers but may also create future inflation if it persists.
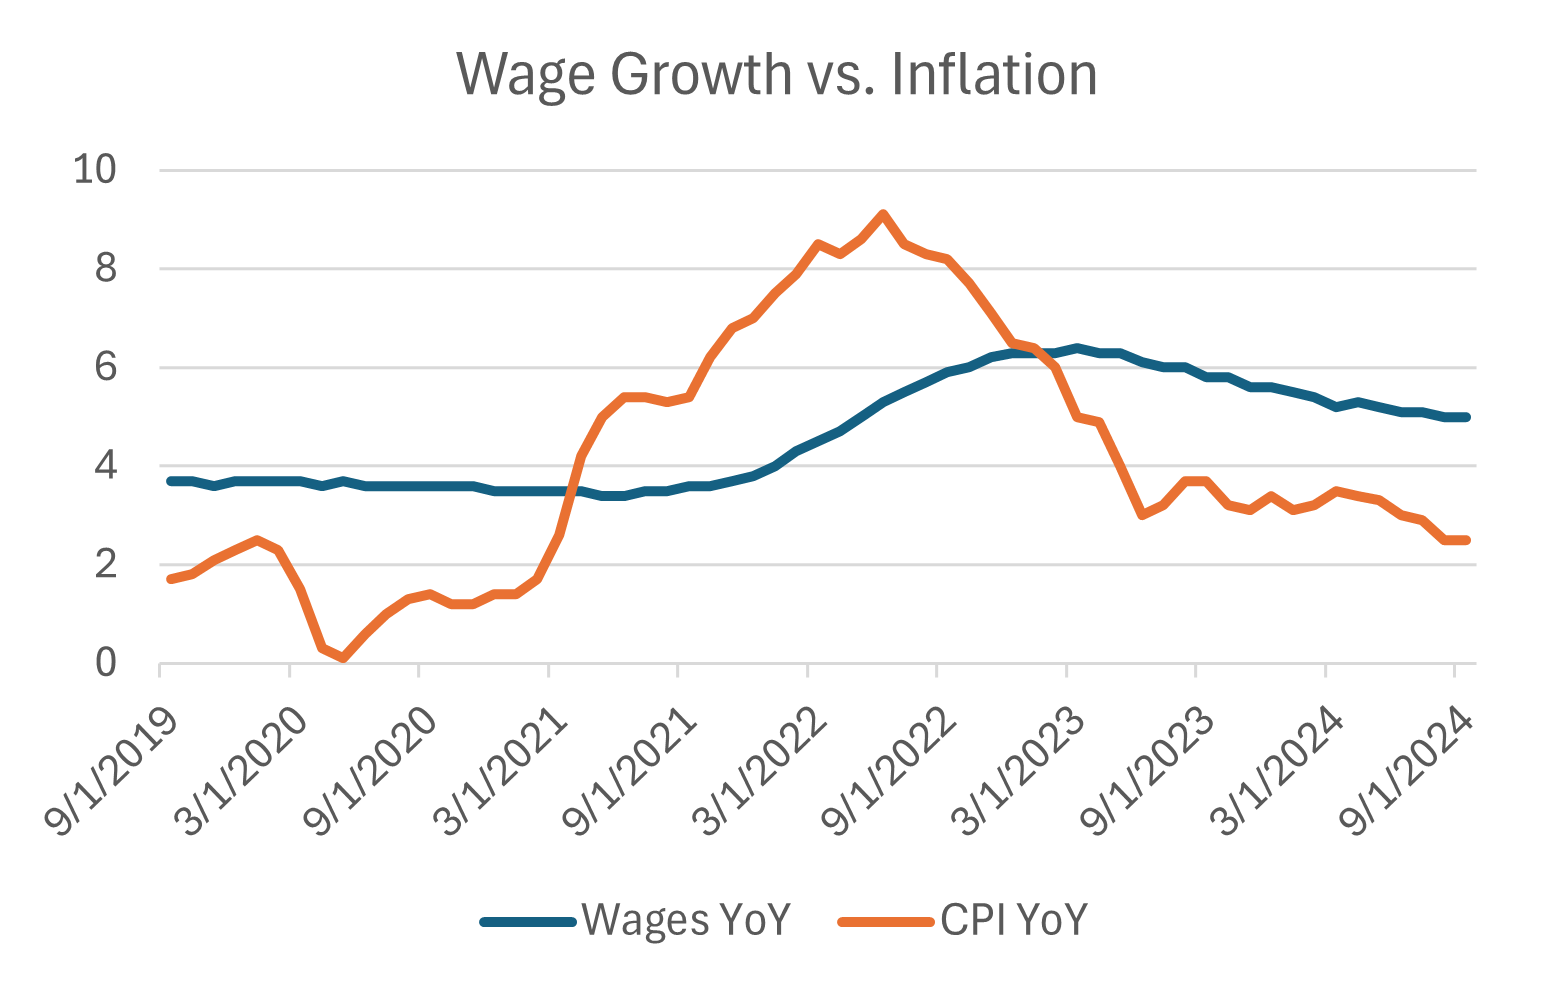
Source: Bloomberg data for 5-year period 9/30/2019 through 9/30/2024, wage growth derived from Atlanta Fed wage tracker and CPI is US CPI for urban consumers.
Positives
* Wealth effect: Household wealth is increasing significantly with equity markets and house prices at all-time highs and bond prices largely recovered.
*Future monetary policy looks more predictable. At current interest levels, retirees can earn a meaningful return on their savings. So middle- and upper-class households are in great economic shape. If the Federal Reserve lowers interest rates as projected, lower income families will have a tail wind as well.
* Earnings from market leading companies have been great. There seems to be a new cost-conscious mindset across companies of all sizes, resulting in margin improvement and highly profitable growth. The application of new AI technologies to improve productivity may accelerate the trend.
*Return of the Chinese growth engine. China’s late quarter market surge was driven by its relatively unprecedented stimulus plans. Thus far the Chinese economy has been a drag on global growth, albeit also potentially detracting from inflation. Should these measures help restore consumer confidence, which has been deeply shaken from the country’s weak housing market, China could be a very large contributor to Global growth.
Concluding Thoughts
Despite our own lukewarm outlook, our tactical strategies are poised to capitalize on any change to the prevailing market narrative. Our strategies' strong trailing one-year performance, despite a narrow market environment for much of the period, gives us confidence that we are well-positioned to benefit disproportionately if the market broadening observed this quarter marks the start of a longer-term trend aligned with the new interest rate (cutting) cycle. The average investor’s portfolio, through inertia alone, is likely anchored heavily to recent winners, offering a unique opportunity to increase exposure to more tactical strategies or those that favor some overlooked sectors should the trend of a broader market continue.
[1] Bloomberg data 9/30/2019 through 9/30/2024. “Small caps” is referencing the S&P 600 Index; “Large cap” is referencing the S&P 500 Index; “Value” is referencing the CRSP US Large Cap Value Index; “Growth” is referencing CRSP US Large Cap Growth Index; U.S. is referencing S&P 500 Index; and International” is referencing MSCI All-Country World Ex-US Index
[2] Bloomberg data through 9/30/2024 - $5672 price and $242 in estimated earnings
[3] Bloomberg data through 9/30/2024 - $233 price and $6.7 in estimated earnings
By Brendan Ryan, CFA, Partner & Portfolio Manager.
For more insights like this, visit and subscribe to our blog: blog.investbcm.com
For more news, information, and strategy, visit the ETF Strategist Channel.
Disclosure Information
Copyright © 2024 Beaumont Capital Management LLC. All rights reserved. All materials appearing in this commentary are protected by copyright as a collective work or compilation under U.S. copyright laws and are the property of Beaumont Capital Management. You may not copy, reproduce, publish, use, create derivative works, transmit, sell or in any way exploit any content, in whole or in part, in this commentary without express permission from Beaumont Capital Management.
Certain information contained herein constitutes “forward-looking statements,” which can be identified by the use of forward-looking terminology such as “may,” “will,” “should,” “expect,” “anticipate,” “project,” “estimate,” “intend,” “continue,” or “believe,” or the negatives thereof or other variations thereon or comparable terminology. Due to various risks and uncertainties, actual events, results or actual performance may differ materially from those reflected or contemplated in such forward-looking statements. Nothing contained herein may be relied upon as a guarantee, promise, assurance or a representation as to the future.
This material is provided for informational purposes only and does not in any sense constitute a solicitation or offer for the purchase or sale of a specific security or other investment options, nor does it constitute investment advice for any person. The material may contain forward or backward-looking statements regarding intent, beliefs regarding current or past expectations. The views expressed are also subject to change based on market and other conditions. The information presented in this report is based on data obtained from third party sources. Although it is believed to be accurate, no representation or warranty is made as to its accuracy or completeness.
Charts and Infographics Information
The charts and infographics contained in this blog are typically based on data obtained from third parties and are believed to be accurate. The commentary included is the opinion of the author and subject to change at any time. Any reference to specific securities or investments are for illustrative purposes only and are not intended as investment advice nor are they a recommendation to take any action. Individual securities mentioned may be held in client accounts. Past performance is no guarantee of future results.
As with all investments, there are associated inherent risks including loss of principal. Stock markets, especially foreign markets, are volatile and can decline significantly in response to adverse issuer, political, regulatory, market, or economic developments. Sector and factor investments concentrate in a particular industry or investment attribute, and the investments’ performance could depend heavily on the performance of that industry or attribute and be more volatile than the performance of less concentrated investment options and the market as a whole. Securities of companies with smaller market capitalizations tend to be more volatile and less liquid than larger company stocks. Foreign markets, particularly emerging markets, can be more volatile than U.S. markets due to increased political, regulatory, social or economic uncertainties. Fixed Income investments have exposure to credit, interest rate, market, and inflation risk. Diversification does not ensure a profit or guarantee against a loss.
S&P Information
The S&P 600 Index tracks small-cap U.S. stocks and reflects the performance of smaller companies. The S&P 500 Index measures the performance of 500 large-cap U.S. companies and is widely used as a benchmark for the overall U.S. stock market. The CRSP US Large Cap Value Index includes large-cap U.S. stocks that exhibit strong value characteristics, while the CRSP US Large Cap Growth Index tracks large-cap stocks with high growth potential. The MSCI All-Country World Ex-US Index captures the performance of global stocks, excluding the United States, representing developed and emerging markets. The Russell 1000 Index tracks the performance of the largest 1,000 U.S. companies by market capitalization, representing approximately 92% of the U.S. equity market. The Russell 2000 Index focuses on small-cap stocks, tracking the smallest 2,000 companies in the broader Russell 3000 Index.
For Investment Professional use with clients, not for independent distribution.
Please contact your BCM Regional Consultant for more information or to address any questions that you may have.
Beaumont Capital Management LLC
125 Newbury St. 4th Floor, Boston, MA 02116 (844-401-7699)
A message from Advisor Perspectives and VettaFi: To learn more about this and other topics, check out some of our webcasts.
Membership required
Membership is now required to use this feature. To learn more:
View Membership Benefits