Commodity returns are hard to predict, yet all commodities have something in common—prices that tend to return to their long-run average, a characteristic described as mean reversion. For investors, this behavior could offer an exciting opportunity to improve long-term performance potential.
We find that only those willing to take an “own them all” approach and having a preference for rebalancing can enjoy the added benefits the commodity asset class offers. Here we examine mean reversion in commodities and offer evidence that a portfolio rebalanced amid this backdrop may experience higher growth over time.
How does mean reversion relate to the commodity asset class?
Mean reversion suggests that after an extreme price move, asset prices tend to return to normal or average levels. In other words, prices that routinely bounce around some average level tend to return to that same average price over and over.
The intuition underpinning why commodities might act this way is tied to the cyclical dynamic between prices, supply and demand:
- Commodity demand typically results from investment in physical infrastructure, which often doesn’t change quickly. Neither does the theoretical equilibrium cost of production.
- Commodity producers therefore tend to reduce their output or decrease their efforts to discover and extract new supplies when prices are low. This, in turn, causes a decline in supply that’s eventually reflected in a higher price.
- Rising prices incentivize producers to dedicate resources toward capitalizing on higher prices. Since the resulting supply tends to overshoot, the market turns to an oversupplied condition, which brings prices back to the initial condition of this cycle.
Put more simply, mean reversion suggests that if an asset exhibits high returns one year, that asset may be more likely to demonstrate a low or negative return the next year. It’s not hard to find instances of this type of behavior among individual commodities.
For example, WTI crude oil prices fell approximately -60% in 2020 during the depths of the COVID-19 pandemic, only to rebound +60% the following year. Many other examples of large reversals exist through time, which we can see by ranking calendar year returns for various commodities from best to worst.
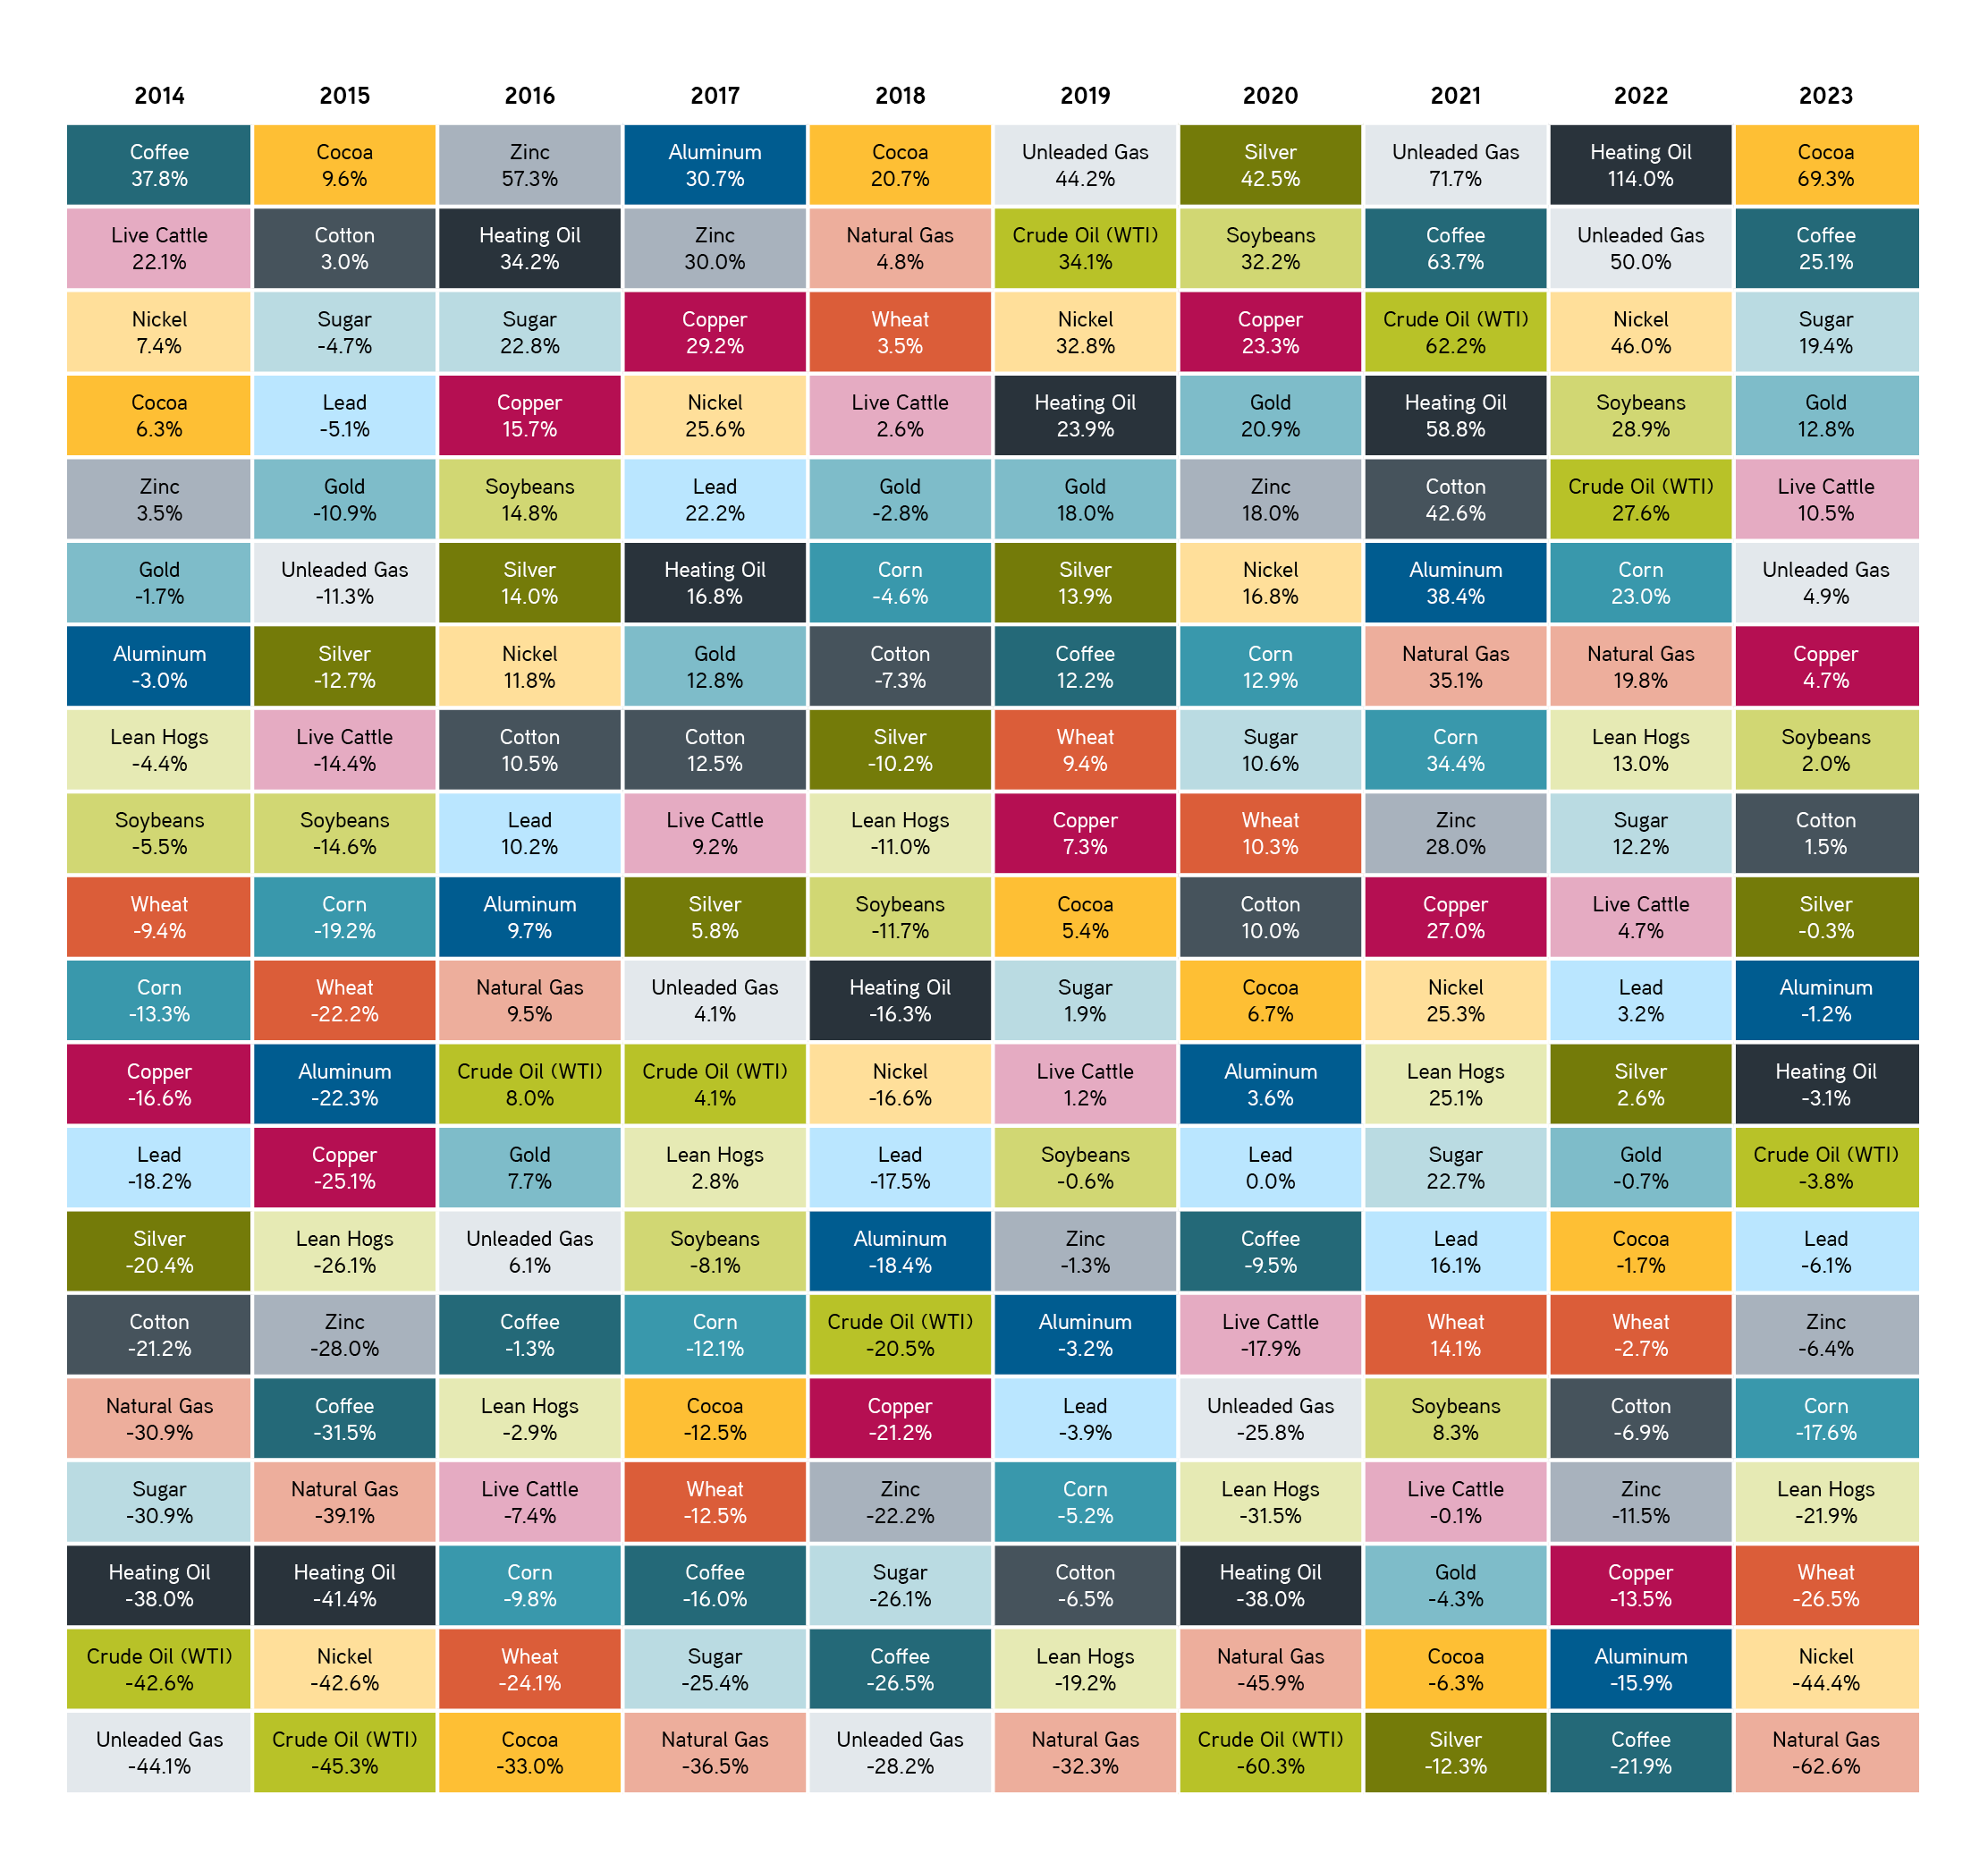
Up and Down: Annual rankings of S&P GSCI® commodity subindex returns, 2014–2023
Sources: Bloomberg, Parametric, S&P Dow Jones, 9/5/2024. Commodity returns are represented by associated S&P GSCI total return subindexes. S&P GSCI® serves as a benchmark for investment in the commodity markets and as a measure of commodity performance over time. For illustrative purposes only. Not a recommendation to buy or sell any security. Past performance is not indicative of future results. All investments are subject to risks, including the risk of loss. It is not possible to invest directly in an index. Indexes are unmanaged and do not reflect the deduction of fees or expenses.
From 2014 to 2023, we often saw a commodity performing above average one year, then subsequently performing below average the next year, and vice versa.
- Sometimes these swings were dramatic: Cocoa was the best performing commodity in 2015, 2018 and 2023, but dead last in 2016 and second worst in 2021.
- Other times they were more muted: Corn’s ranking flipped between the top and bottom halves two-thirds of the time, yet its performance never ranked in the top or bottom deciles.
In both cases, mean reversion appears to be at work with varying degrees of strength.
Note that applying the same ranking analysis above to more frequent periodicities—quarterly or monthly returns, for instance—yields similar oscillating performance patterns. We think this has important implications for portfolio construction decisions, such as diversification and rebalancing.
How can commodity investors seek to capitalize on the mean reverting tendency of individual commodities?
The absence of a consistent pattern in commodity returns suggests to us that an investor should own them all. But even a diversified portfolio will eventually become concentrated if never touched again.
This is where having a sensible rebalancing process becomes vitally important. Not only does rebalancing help keep the portfolio diversified, but it can also be an added source of performance, particularly in the commodity asset class where volatility is high.
In a more tractable sense, rebalancing back to a set of target weights can be seen as exploiting the tendency for commodities to show reversals in their prices. As we’ve shown, a commodity that exhibits high returns one year may be more likely to demonstrate a low or negative return the next year. Disciplined rebalancing locks in the gains from an increase in a commodity’s price and reduces the basis upon which the potential decline is applied.
According to the annual ranking analysis, for example, the copper subindex demonstrated a return of 29.2% in 2017 and a return of -21.2% in 2018. An investor who maintained exposure to the copper subindex throughout this cycle would have experienced a cumulative return of approximately 2%, preserving almost none of the gains from the 2017 upswing. However, an investor who rebalanced during the upswing could have effectively reduced their exposure to the copper subindex prior to the 2018 decline.
By trimming a position that has grown after a price rally, and realizing a gain on that sale, the return for the portfolio may be better preserved if the price then suddenly reverses. The same can be said about buying more of a commodity whose price has recently declined, only to see its fate subsequently improve.
The bottom line
Many aspects of our world are subjected to cycles, and commodity markets are no different. As an asset class where price reversals are the norm, commodities can be fruitful candidates for a portfolio built to emphasize diversification and rebalancing. When individual commodities are characterized by relatively high volatility, low correlations and a tendency to mean revert, an investor may find the rebalancing premium from establishing target weights and a rebalancing mechanism to be beneficial.
The views expressed in these posts are those of the authors and are current only through the date stated. These views are subject to change at any time based upon market or other conditions, and Parametric and its affiliates disclaim any responsibility to update such views. These views may not be relied upon as investment advice and, because investment decisions for Parametric are based on many factors, may not be relied upon as an indication of trading intent on behalf of any Parametric strategy. The discussion herein is general in nature and is provided for informational purposes only. There is no guarantee as to its accuracy or completeness. Past performance is no guarantee of future results. All investments are subject to the risk of loss. Prospective investors should consult with a tax or legal advisor before making any investment decision. Please refer to the Disclosure page on our website for important information about investments and risks.
10.8.2025 | RO 3880491
Investment advisory services offered through Parametric Portfolio Associates® LLC ("Parametric"), an investment advisor registered with the US Securities and Exchange Commission (CRD #114310). Parametric is also registered as a portfolio manager with the securities regulatory authorities in certain provinces of Canada (National Registration Database No. 42850) with regard to specific products and strategies. Parametric provides advisory services directly to institutional investors and indirectly to individual investors through financial intermediaries. The information on this website does not constitute an offer to sell, or a solicitation of an offer to purchase, securities in any jurisdiction to any person to whom it is not lawful to make such an offer. Investing entails risks, and there can be no assurance that Parametric (and its affiliates) will achieve profits or avoid incurring losses. All investments are subject to potential loss of principal. Parametric does not provide tax or legal advice. Prospective investors should consult with a tax or legal advisor before making any investment decision. Please refer to the disclosure page for important information about investments and risks.
S&P Dow Jones Indices are a product of S&P Dow Jones Indices LLC (“S&P DJI”) and have been licensed for use. S&P® indexes are registered trademarks of S&P DJI; Dow Jones® is a registered trademark of Dow Jones Trademark Holdings LLC (“Dow Jones”); S&P DJI, Dow Jones, and their respective affiliates do not sponsor, endorse, sell, or promote Parametric and its strategies, will not have any liability with respect thereto, and do not have any liability for any errors, omissions, or interruptions of the S&P Dow Jones Indices.
©2024 Parametric Portfolio Associates® LLC. All rights reserved. 800 Fifth Avenue, Suite 2800, Seattle, WA 98104.
NOT FDIC INSURED. OFFER NOT A BANK GUARANTEE. MAY LOSE VALUE. NOT INSURED BY ANY FEDERAL GOVERNMENT AGENCY. NOT A DEPOSIT.
A message from Advisor Perspectives and VettaFi: To learn more about this and other topics, check out our most recent white papers.
© Parametric
Read more commentaries by Parametric