The Federal Reserve’s rate cut on September 18 likely represents the first in a series of rate cuts as the Fed balances their dual mandate around employment and price stability. Each rate cut cycle is unique in its own way, and this one follows a rate hiking cycle totaling 5.25% from March 2022 through July 2023 aimed at bring inflation down towards the Fed’s 2% target. Despite this tightening, the economy has remained resilient with expectations for lower but still positive growth.
Overall, we believe the balance of economic data remains constructive and supportive of a soft landing scenario. However, uncertainty tends to be higher at these policy inflection points as investors weigh divergent outcomes. With this in mind, what can history tell us about the past performance of markets during rate cut cycles?
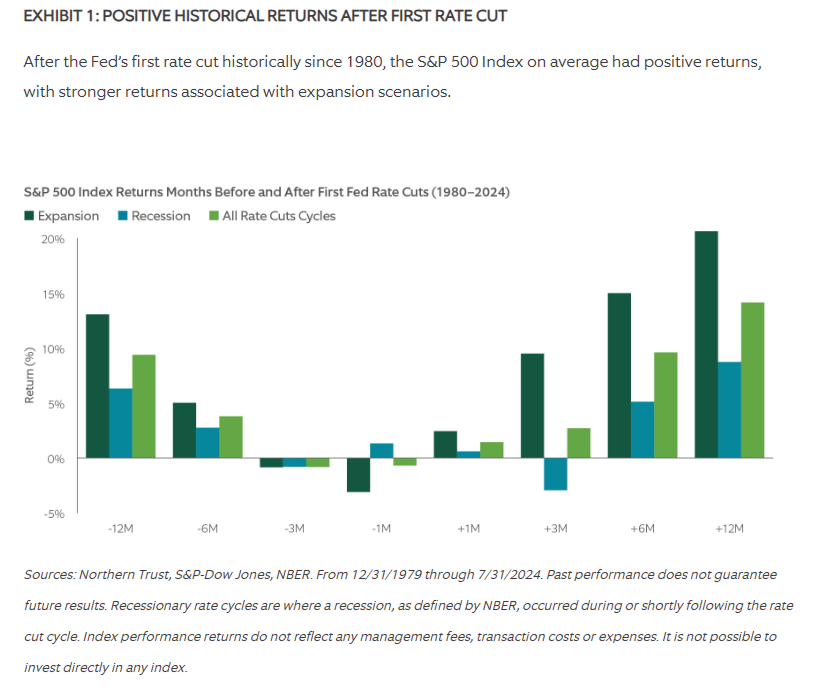
Historical U.S. Equity Performance After the First Rate Cut
Given rate cut cycles typically commence to stimulate economic activity in a slowing economy, investors may be cautious about stock returns during this timeframe.
However, looking at the history may provide comfort. However Since 1980, there have been a total of 11 rate cut cycles. In the 12 months following the start of a rate cut cycle, equity returns as measured by the S&P 500 Index%kt1% averaged 14.1%. Stocks also rose on average over three months and six months after the first rate cut.

Expect a Bumpy Ride
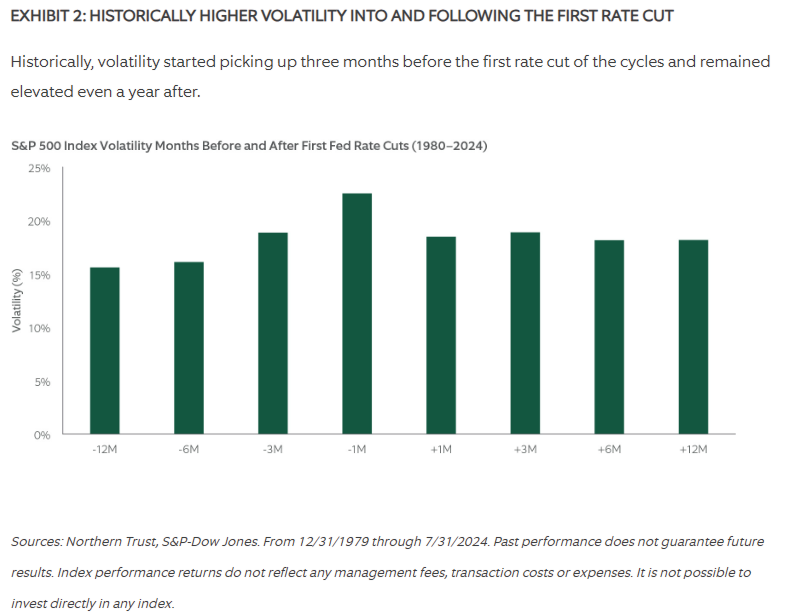
Also notable is what happens to volatility entering and during a rate cut cycle. Exhibit 2 shows that, historically, stock volatility was above average in the three months before the first rate cut of the cycle and stayed elevated over the year that followed. For example, in the one month prior to the first rate cut, volatility was 22.5% versus average market volatility of around 15%. Although the volatility lessened over time, it still remained above average a year later, highlighting that rate cut cycles are associated with more uncertainty.
In 2024, markets have played right along with this historical script. Stock volatility was subdued the first half of this year. But leading up to the September 18 rate cut, volatility picked up significantly, as equity markets sold off to start both August and September. Markets recovered in both instances, but volatility remains above the first half of the year.
What About Equity Factors?
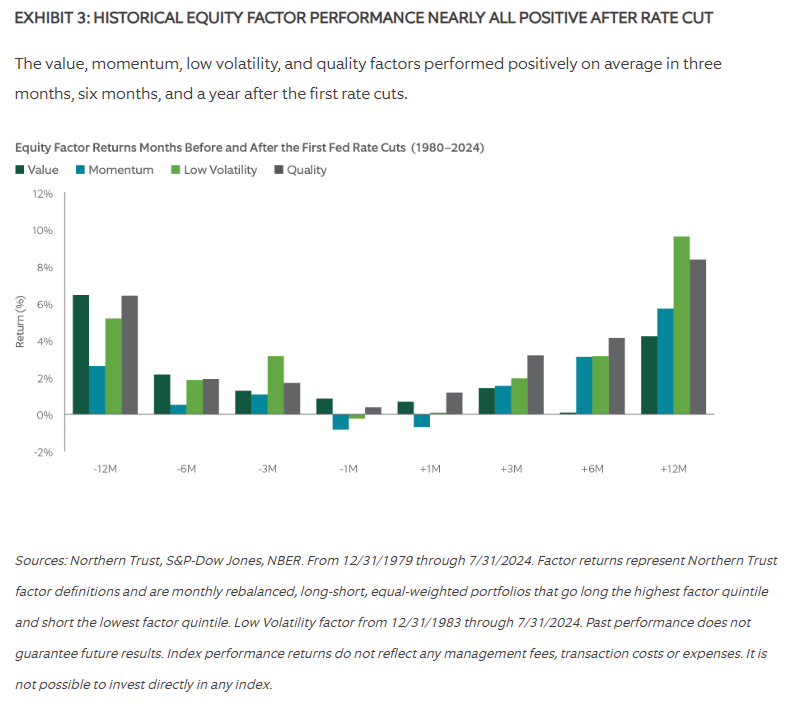
We also examined how equity market factors (quality value, low volatility, momentum) performed historically over rate cut cycles. As shown in Exhibit 3, the average returns to each factor were positive in the 12 months prior and following the first rate cut. The factor returns during these periods were generally in line with longer run averages. Of note, the quality factor performed most consistently of the factors during the rate cut cycle, which we see in other studies of economic scenarios1 as well.
Other factors, although positive overall, exhibited variability over these periods, which is not surprising given the heightened level of volatility and divergent outcomes depending on whether the economy is in expansion or recession. For example, during the 1998 rate cut cycle, the dot-com bubble continued inflating to the detriment of low volatility stocks, which underperformed significantly. However, following the dot-com peak in March 2000 and the early 2001 rate cut cycle, low volatility stocks significantly outperformed their high volatility counterparts. This is an important reminder that although we are looking at averages, each rate cut cycle had a unique set of circumstances.
What Can We Expect?
Historically, equity markets have typically performed well in the year prior to and following the start of Fed rate cut cycles. The level of performance poll has not surprisingly been conditioned on whether a recession occurred or not. We see a soft landing for the economy as our base case, with second quarter economic growth of 3%, strong U.S. corporate earnings, and slowing inflation balanced against a softening labor market. Historically speaking, this scenario has been constructive for equities. However, volatility has tended to become and remain elevated around rate cut cycles, meaning investors should expect a bumpy ride.
We also provided a look at the historical performance of factors, which were generally positive during these periods, noting the uniqueness of each rate cut cycle and the dispersion of performance. Although past performance is no guarantee for future success, we hope these results provide some perspective into equity return dynamics as we move through a period of heightened volatility surrounding markets while investors debate economic outcomes.
1 See Navigating Inflation — An Analysis of Equity Factor Performance Over 150 Years. Northern Trust White Paper (2024). See Contraction, Recovery & Growth: How Factors Performed. Northern Trust White Paper (2018).
A message from Advisor Perspectives and VettaFi: To learn more about this and other topics, check out some of our webcasts.
© Northern Trust
Read more commentaries by Northern Trust