Key Takeaways
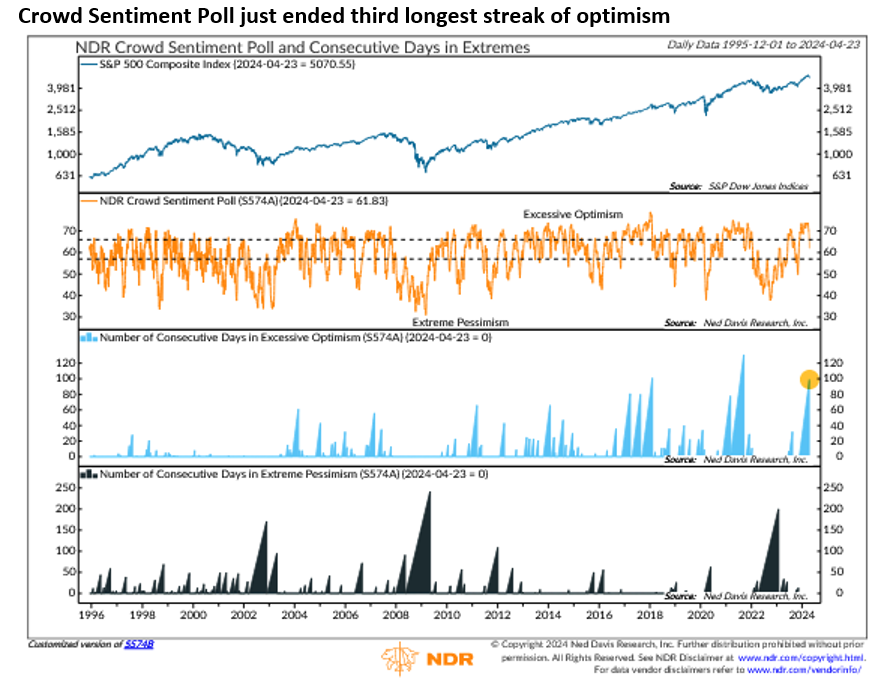
- The NDR Crowd Sentiment Poll exited its excessive optimism zone for the first time in 20 weeks, the third-longest run on record.
- Long optimism streaks have become more common and in clusters.
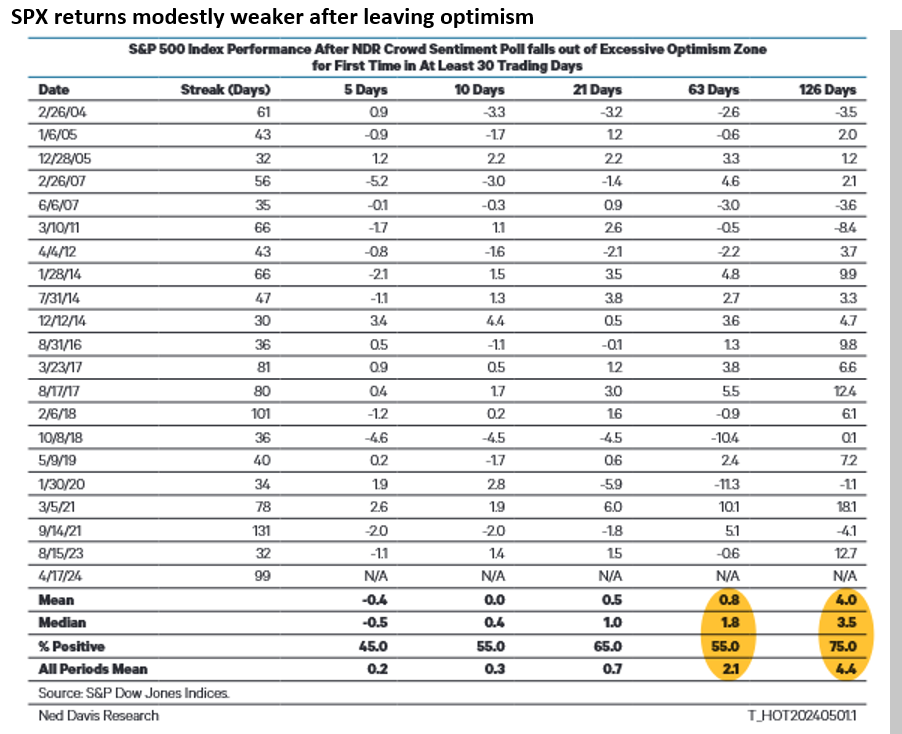
- S&P 500 returns have been mixed after optimism periods have ended.

Spell broken
The NDR Crowd Sentiment Poll took about a month after the October 2023 lows to reach its excessive optimism zone (chart, above).
Despite lingering economic fears, concerns over the timing and pace of rate cuts, sticky inflation reports, a crisis in the Middle East, and a looming close U.S. presidential election, stocks marched higher, and sentiment remained optimistic.
It was not until the S&P 500 fell over 4% that the Crowd Sentiment Poll exited its optimism zone. The above issues played a role, but the cliché that “nothing changes sentiment like price” seems applicable.
The optimism streak ended at 99 trading days, or roughly 20 weeks, the third-longest stretch since the Crowd Sentiment Poll data began in 1995.
Now what?
On January 31, we introduced the table (above) that shows that after long periods of optimism have ended, S&P 500 returns have been slightly weaker than average for the next three months.
Today, we want to highlight two other aspects of the chart. First, optimism and pessimism streaks have become more common. The six longest runs of excessive optimism have come since 2016.
On the pessimism side of the ledger, the 200-day streak that ended in January 2023 reflected pervasive recession fears, but the fact that it is the second-longest run after the 2008-09 financial crisis speaks to the tendency for sentiment to stay one-sided for longer.
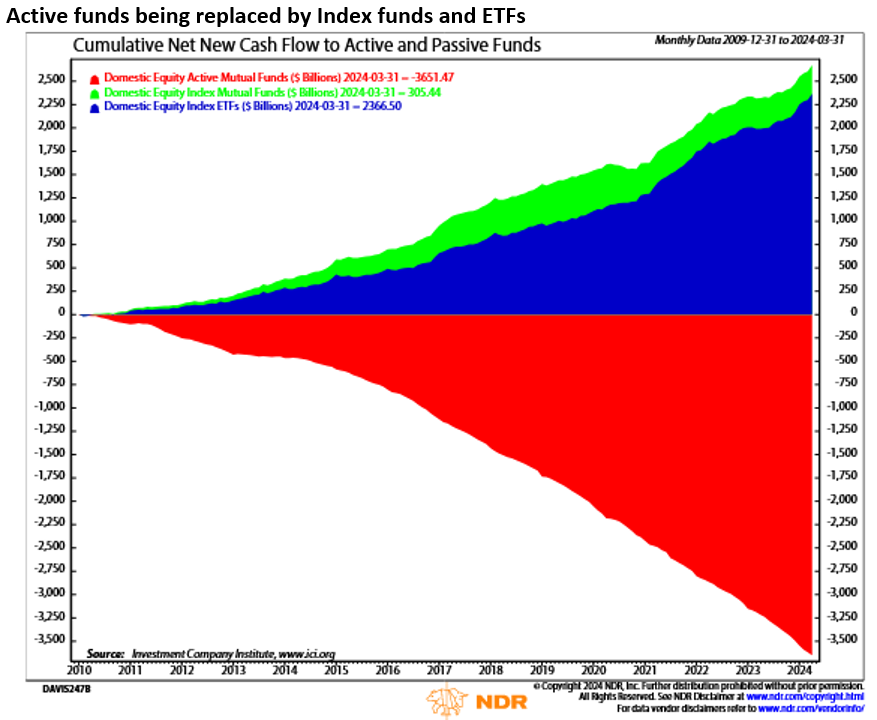
Changing market structure could be to blame. The growing influence of ETFs, algorithmic trading, and low-volatility instruments have provided the market with an inertia that was not prevalent when humans were making most of the buy and sell decisions (chart, below).
Second, streaks have come in clusters. From November 2016 to February 2018, there were three optimism streaks of at least 80 days. From November 2020 to September 2021, there were two runs of at least 78 days.
In both 2018 and 2022, macro forces — namely restrictive Fed policy — cooled the optimism fever. Whether the recent run of excessive optimism marks the end of the bull market or proves to be a pause before another streak of complacency will likely depend on inflation and the Fed’s reaction to it.
Our intermediate-term outlook for U.S. stocks remains bullish on an absolute basis and relative to bonds and cash.
Ed Clissold is the Chief U.S. Strategist at Ned Davis Research. To learn more about Ned Davis Research, please visit www.ndr.com
A message from Advisor Perspectives and VettaFi: Dive into alternative investment opportunities at our upcoming Alternatives Symposium on May 30th, and gain insights into diversifying portfolios beyond traditional equities and fixed income.
Read more commentaries by Ned Davis Research