Bonds have gained more attention as rates have risen. As a manager of more than $120B in fixed income assets, we always pay close attention to the level of interest rates and directional trends. Yet, some might be surprised that we spend little time trying to predict interest rate movements. The overwhelming majority of the assets we manage are on a duration neutral basis relative to a benchmark. We believe the best way to add value is through the relative positioning in sector allocations, individual security selection and along the yield curve holding duration neutral overall.
Our distinct management approach, however, does not prevent us from having views on interest rates and, at the risk of sounding self-promotional, we think bonds offer good value at current rate levels.
Rates may well continue to rise but it is at least equally likely they could fall as the market is signaling the Fed will be easing in 2024. Our preference would be for market rates to remain near current levels for an extended period, as the risk/reward tradeoff for investors and the economy seems to be comfortably balanced. Growth is steady, albeit at a moderate 2.6% pace YoY. And interest rates do not seem to be discouraging most borrowers or, as they were for far too long, penalizing savers and investors. With both short- and longer-term bonds now yielding between 4 – 6%, in our view, bonds are back!
We also know there are trillions of dollars currently parked in money market funds and T-bills (according to the Investment Company Institute ICI) and Treasury.gov) enjoying the seeming “free lunch” of high yields with little or no risk which, of course, won’t last forever. So, for those short-term focused investors and fans of former “Late Night” talk show host David Letterman, we have compiled our own “Top Ten” list of why we like bonds now!
Top Ten Reasons to Like Bonds Now
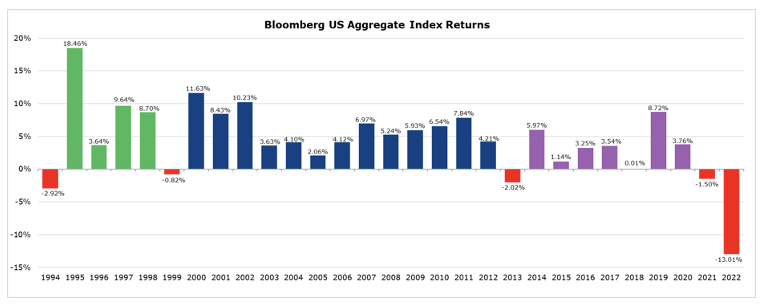
1. Positive fixed income returns have historically followed down years. 2022 was the worst year on record for the Bloomberg Aggregate Index from a total return perspective (-13.01%) and 2021 was slightly negative as well (-1.5%). Since 1980, years with negative returns (1994, 1999 and 2013) were followed by multiple years of positive returns. So far, 2023 is off to a solid start with a positive 2.02% YTD return through July 31st (Source: Bloomberg).

2. Inflation is coming down. Although still above the Fed’s 2.0% target, the CPI has fallen from 9.1% YoY to 3.0% over the last year. While core inflation measures have been stickier, they too are in a downward trend. The Fed is doing its part to moderate demand as industries focus on reducing or eliminating supply constraints, both of which improve the odds that the disinflationary trend will continue.
3. Income drives total return and income levels are attractive. The yield on the Bloomberg Aggregate Index has risen significantly (+310 basis points) since the beginning of 2022, to 4.85% (as of July 31). The yield on the Bloomberg Municipal Index has risen similarly (+239 basis points) to 3.50%, which equates to 5.91% for investors paying the top federal tax rate (40.8%). While these benchmark yields are appealing on their own, many fund offerings that are managed against both taxable and tax-exempt indices offer even higher yields.
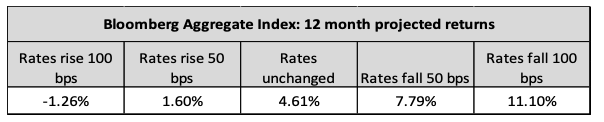
4. Income cushion helps minimize price volatility. As rates rose in 2022, bonds suffered sharp negative returns because there was extraordinarily little income to offset price declines. Now, significantly higher income levels offer more favorable total return outcomes in both rising and falling rate environments. For example, using July 31 data, if rates across the entire curve rose instantaneously 100 basis points from current levels and the curve slope and credit spreads didn’t change, the Bloomberg Aggregate Index would produce an estimated return of -1.26% over the next year. A similar fall in rates of 100 basis points rate provides an 11.10% return. Actively managed fund returns will vary from these estimates, but we believe they should be reasonably similar.
Bloomberg Aggregate Index: 12 Month Projected Returns
Source: BondEdge
Note: The scenario analysis is for illustrative purposes only and is not meant to be a recommendation or forecast. The analysis uses the starting yield to worst for the Bloomberg Aggregate Index as of July 31, 2023. The expected 12 month return calculations assume a constant yield curve slope and Index duration while implementing an instantaneous parallel rate shift with no change in spreads.)
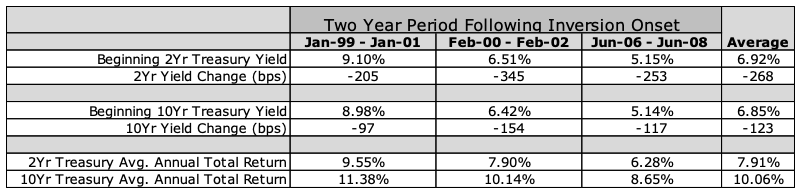
5. The curve inversion is “long-in-the-tooth.” July was the one-year anniversary of the inversion of 2s/10s on the Treasury curve, which coincidentally is the average length of each inversion cycle since the mid-1980s. In the past, inversions have telegraphed economic slowing as m expect once again. Historically, the period following inversions brings lower rates, led by sharp declines in short-term yields with positive total returns across the curve.
Treasury Yield Declines and Total Returns After Onset of Curve Inversions
Source: Bloomberg
6. The end (of the current Fed tightening cycle) is near. After boosting the federal funds rate by 525 basis points since March of 2022, the most aggressive hiking cycle since 1980, monetary policy is now restrictive relative to current inflation levels. The Fed’s own forecast (dot plots) and forward-looking market measures all assume the federal funds rate will begin to decline in 2024, although views on the timing and pace vary.
7. The credit backdrop is favorable. While credit pressures may emerge if the economy does go into recession, the credit sectors (corporate, structured and municipal) begin from a position of strength. Municipalities are flush with record reserves (Source: NASBO), corporate balance sheets are strong, and the residential housing market is firm.
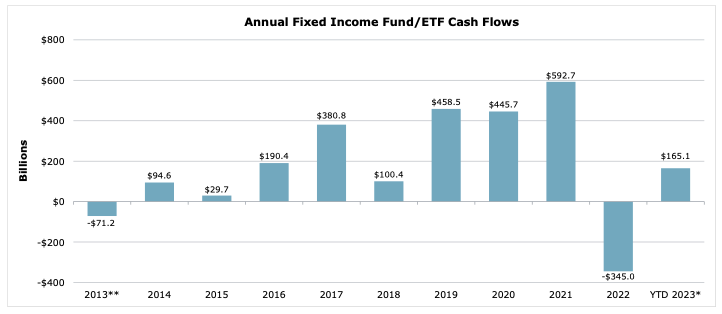
8. Fixed income fund flows are positive, again. After suffering the worst period of net outflows ever in 2022, investor demand has returned. Over $130 billion of net purchases occurred through the first six months of 2023 into fixed income funds and ETFs.
Source: Investment Company Institute (ICI)
Weekly data ending 7/26/23 (July 2023 numbers are estimated). ** 2013 Flows are only Mutual Fund flows, ETF Flows are not viable. The flows data include both taxable and municipal mutual funds and ETFs as defined by ICI. Included are investment grade, high-yield, government, multisector and world bond funds.
9. Boomers love bonds. The demographic trend suggests, and we believe demand for fixed income will continue for many years as there are still approximately 10,000 boomers leaving the workforce every day with the need to transition their assets from the accumulation to payout focused on income replacement. Prior to the mutual fund outflows in 2022 mentioned above, investor demand is evident in the positive fund inflows in each year going back to 2014.
10. Bonds (may) beat stocks. A significant yield gap has emerged as bond yields have risen and the stock market has rallied. The yield on the Bloomberg Aggregate Index of 4.85% now exceeds the 1.5% dividend yield of the S&P 500 equity benchmark by 335 basis points, the widest gap since September 2007. This suggests that the return for bonds may be very competitive relative to equities in 2024.
Disclosures
Note: The scenario analysis is for illustrative purposes only and is not meant to be a recommendation or forecast. The analysis uses the starting yield to worst for the Bloomberg Aggregate Index as of July 31, 2023. The expected 12 month return calculations assume a constant yield curve slope and Index duration while implementing an instantaneous parallel rate shift with no change in spreads. Fixed income is generally considered to be a more conservative investment than stocks, but bonds and other fixed income investments still carry a variety of risks such as interest rate risk, credit risk, inflation risk and liquidity risk. In a rising interest rate environment, the value of fixed income securities generally declines and conversely, in a falling interest rate environment, the value of fixed income securities generally increases. Past performance does not guarantee future results.
Carefully consider a fund’s investment objectives, risks, charges, and expenses before investing. For a current prospectus and summary prospectus, containing this and other information, visit bairdfunds.com. Read it carefully before investing.
©2023 Robert W. Baird & Co. Incorporated. Member SIPC. Robert W. Baird & Co. Incorporated. 777 East Wisconsin Avenue, Milwaukee, Wisconsin 53202
First Use: 8/2023
A message from Advisor Perspectives and VettaFi: To learn more about this and other topics, check out our full schedule of upcoming CE-approved virtual events.
More Exchange-Traded Products Topics >