After embarking on a rapid tightening cycle in March 2022, the Federal Open Market Committee (FOMC) appears poised to pause its interest rate hikes in the middle of this year. The Fed increased the federal funds rate from 0%– 0.25% in early 2022, to 5.00% ¬–5.25% as of its May 2023 meeting. The following research looks at equity and fixed income returns in the six- and 12-month periods after the Fed has hiked interest rates for the final time in a tightening cycle.
Background
The analysis reviews Fed tightening cycles since 1980, which include nine distinct periods where rates were increased. The average time between the last Fed rate hike and the first rate cut was 5.5 months. The minimum time to a rate cut was one month, after the last hike in March 1980 and September 1987. The maximum time was 15 months, following the last rate hike in June 2006.
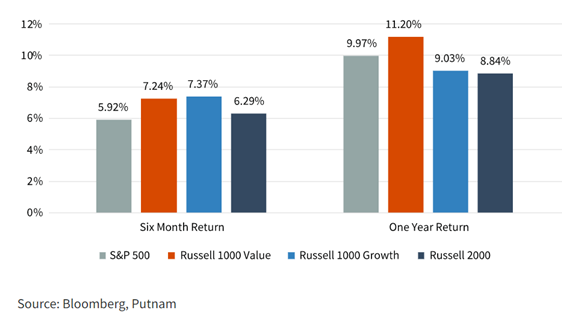
Equity style and size performance
Returns across major U.S. equity indexes were positive, on average, in both the six months and 12 months after the last rate hike. The strongest average returns in the six months after the last hike were in the Russell 1000 Growth Index. The strongest average returns in the 12 months after the last hike were in the Russell 1000 Value Index. The following chart shows the six- and 12-month returns for the S&P 500 Index, Russell 1000 Value Index, Russell 1000 Growth Index, and Russell 2000 Index. In six of the nine periods, all four indexes were positive 12 months after the last rate hike. However, there were two periods where all four indexes had negative returns 12 months after the last hike. This occurred following the December 1980 and September 1987 rate hikes.

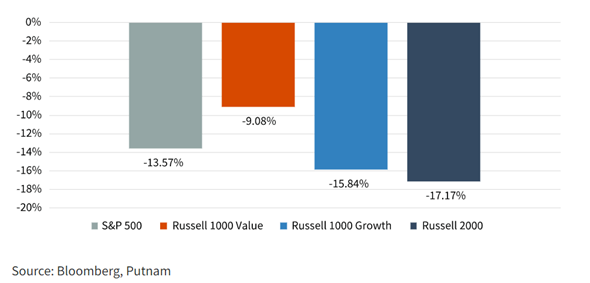
Not all smooth sailing
While returns on average were positive across the sample in the six and 12 months after the last rate increase, the periods included some market volatility. The following chart shows the average maximum drawdown for the indexes in the 12 months after the last hike. To define this number, we looked at the maximum drawdown in each period – defined as the largest peak-to-trough price drop in the sample – and calculated the 9-period average.
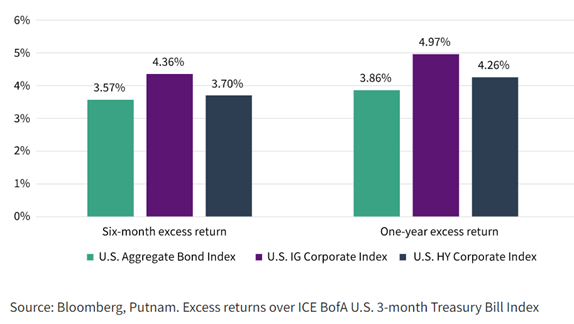
Fixed income performance
To analyze fixed income performance during these same periods, we looked at the excess returns over cash for the Bloomberg U.S. Aggregate Bond Index, the Bloomberg U.S. Corporate Investment Grade Bond Index, and the Bloomberg U.S. Corporate High Yield Bond Index. Data for the high yield index was available beginning after the first two tightening cycles which ended in March 1980 and December 1980. On average, each of the indexes had positive returns versus cash in the six- and 12-month periods after the last rate hike.
Conclusion
The Fed typically tightens monetary policy by increasing the target range of the federal funds rate with the goal of slowing the economy to combat inflation. History shows the Fed has often acted to quickly pivot their policy, with the first-rate cut made an average of 5.5 months after the last rate hike. In the six and 12 months after the Fed increased rates for the final time in a cycle, equity indexes on average had positive returns, in line with historical averages. Still, while equity markets finished higher, there was often volatility. The S&P 500 exhibited an average maximum drawdown of -13.57% in the 12 months after the last rate hike. Similarly, bond performance at the index level experienced positive returns (over cash on average) in the six and 12 months after the last rate hike.
For informational purposes only. Not an investment recommendation. Past performance is not indicative of future results.
The S&P 500® Index is an unmanaged index of common stock performance. The Russell 1000® Value Index is an unmanaged index of those companies in the large-cap Russell 1000 Index chosen for their value orientation. The Russell 1000® Growth Index is an unmanaged index of those companies in the large-cap Russell 1000 Index chosen for their growth orientation. The Bloomberg U.S. Aggregate Bond Index is an unmanaged index of U.S. investment-grade fixed-income securities. The Bloomberg U.S. Corporate High-Yield Index covers the U.S. dollar-denominated, non-investment-grade, fixed-rate, taxable corporate bond market and includes securities with ratings by Moody’s, Fitch, and S&P of Ba1/BB+/BB+ or below. The Bloomberg U.S. Corporate Bond Index measures the investment-grade, fixed-rate, taxable corporate bond market. It includes U.S. dollar-denominated securities publicly issued by U.S. and non-U.S. industrial, utility, and financial issuers. The ICE BofA (Intercontinental Exchange Bank of America) U.S. 3-Month Treasury Bill Index is an unmanaged index that seeks to measure the performance of U.S. Treasury bills available in the marketplace. You cannot directly invest in an index.
Frank Russell Company is the source and owner of the trademarks, service marks, and copyrights related to the Russell Indexes. Russell® is a trademark of Frank Russell Company.
BLOOMBERG® is a trademark and service mark of Bloomberg Finance L.P. and its affiliates (collectively “Bloomberg”). Bloomberg or Bloomberg’s licensors own all proprietary rights in the Bloomberg Indices. Neither Bloomberg nor Bloomberg’s licensors approve or endorse this material, or guarantee the accuracy or completeness of any information herein, or make any warranty, express or implied, as to the results to be obtained therefrom, and to the maximum extent allowed by law, neither shall have any liability or responsibility for injury or damages arising in connection therewith.
ICE Data Indices, LLC (ICE BofA), used with permission. ICE BofA permits the use of the ICE BofA indices and related data on an “as is” basis; makes no warranties regarding same; does not guarantee the suitability, quality, accuracy, timeliness, and/or completeness of the ICE BofA indices or any data included in, related to, or derived therefrom; assumes no liability in connection with the use of the foregoing; and does not sponsor, endorse, or recommend Putnam Investments, or any of its products or services.
A message from Advisor Perspectives and Vetta Fi: To learn more on this and other topics, check out our full schedule of upcoming CE-approved virtual events.
© Putnam
Read more commentaries by Putnam