To properly guide their clients, financial advisors must have a good understanding of the long-run behavior of stock and bonds returns. A very useful and free data source for this analysis — and a great example of academic work that has great practical value — can be found at macrohistory.net. This organization put together 150+ years of annual stock, bond, and inflation data for 18 developed market economies.
Stock and bond returns
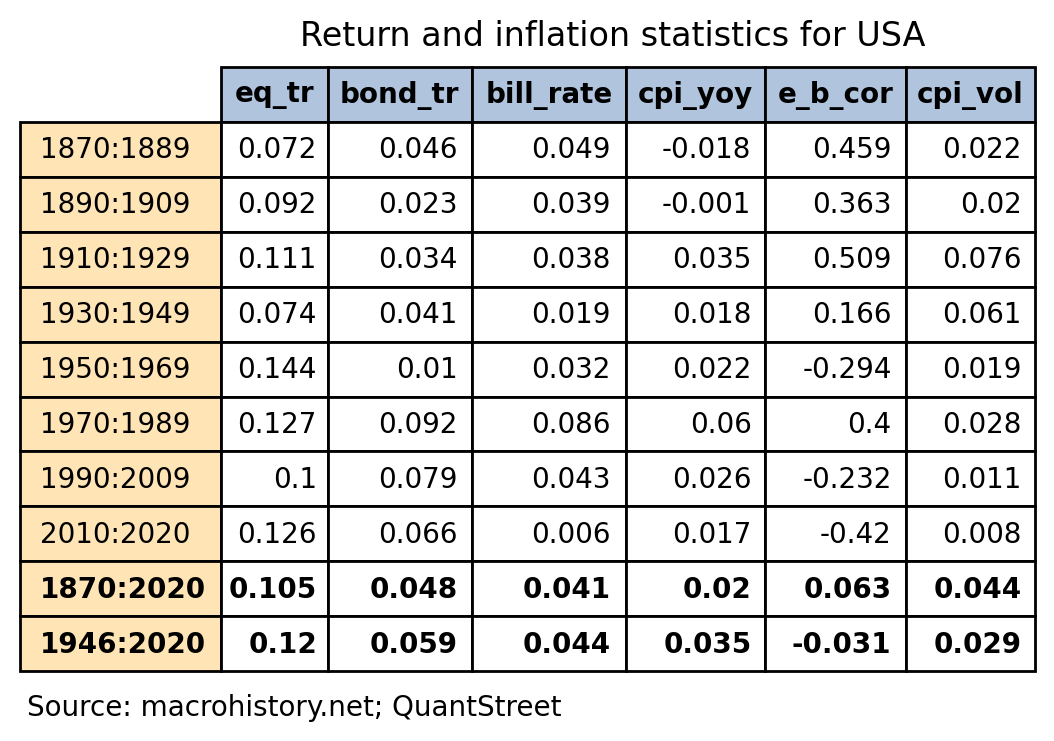
Using this data set for the U.S. economy, we put together some summary statistics on stock-bond performance and inflation, grouped into 20-year subperiods.

Explanation: The eq_tr, bond_tr, bill_rate, and cpi_yoy columns are the average equity return, government bond return, government bill return, and inflation (year-over-year CPI growth rates) level in each subperiod. The e_b_cor column shows the correlation of annual stock and government bond returns in each subperiod, and the cpi_vol column shows the year-over-year CPI growth rates. All underlying data are in annual terms.
A few observations:
- The highest-inflation period was 1970-1989 (which was the oil shock and the Volcker Fed). Stocks and bonds did fine during this period, at least in nominal terms. Even in real terms (i.e., after subtracting out inflation), the performance was decent.
- The difference between government bond and bill (very short-term bonds) returns was by far the highest in the 2010-2020 period, which reflected a decade of loose monetary policy post the Global Financial Crisis.
- In the full sample, stocks are up 10.5% per year on average and bonds are up 4.8% on average.
- Over the post-war sample, stocks have averaged 12% nominal returns per year. Government bonds have averaged about half that, at 5.9%.
- The Fed's 2% inflation target is exactly in line with the 150+ years of data for the U.S.
Overall, when the holding period is long enough (e.g., 20 years), stocks do well in inflationary and non-inflationary time periods.
Stock-Bond Correlations
When thinking about portfolio allocation between stocks and government bonds, another crucial consideration is whether the negative stock-bond correlation seen over the past few decades will persist. The e_b_cor column in the above table shows the correlation of annual stock and government bond returns in each subperiod. The cpi_vol column measures the volatility of year-over-year CPI inflation in each subperiod.
The picture that emerges is that stocks and bonds were positively correlated in the first four subperiods (1870-1949), then were negatively correlated in the 1950s and 1960s, positively again during the inflationary 1970s and early 1980s, and then negatively since the 1990s.
Interestingly, the key driver of this correlation is not the average level of inflation — look at 1870-1889 when inflation was negative — but its volatility. Loosely speaking, it seems stocks and bonds are positively correlated in periods with high inflation volatility, and negatively correlated in periods with low inflation volatility.
So thinking ahead, if we believe the Federal Reserve and other central banks will get inflation under control and that future inflation volatility will be low, then stocks and bonds may stay in their negative correlation regime going forward.
© QuantStreet Capital
Read more commentaries by QuantStreet Capital
 Explanation: The eq_tr, bond_tr, bill_rate, and cpi_yoy columns are the average equity return, government bond return, government bill return, and inflation (year-over-year CPI growth rates) level in each subperiod. The e_b_cor column shows the correlation of annual stock and government bond returns in each subperiod, and the cpi_vol column shows the year-over-year CPI growth rates. All underlying data are in annual terms.


