2022 has been a notable year so far for small-caps, but for all the wrong reasons. Through this year’s first nine months, the Russell 2000 Index posted its second worst opening nine months to a year in its more than 40-year history. Of course, regardless of capitalization size, U.S. equity investors have been reminded of the relevance of the investment adage, “Don’t Fight the Fed” as the central bank’s hawkish pivot and rapid rate increases have led to the re-pricing of all financial assets.
Having established the scene in the rearview mirror, what do we think is ahead for small-caps? We have made the case previously that there are three counterintuitive indicators that have proven valuable for identifying attractive entry points for small-caps and that have been followed by above-average returns: low trailing returns, specifically five-year returns below 5%; moderate to high high-yield spreads, specifically 500 basis points or more; and elevated VIX readings of at least 20. All three are currently flashing green.
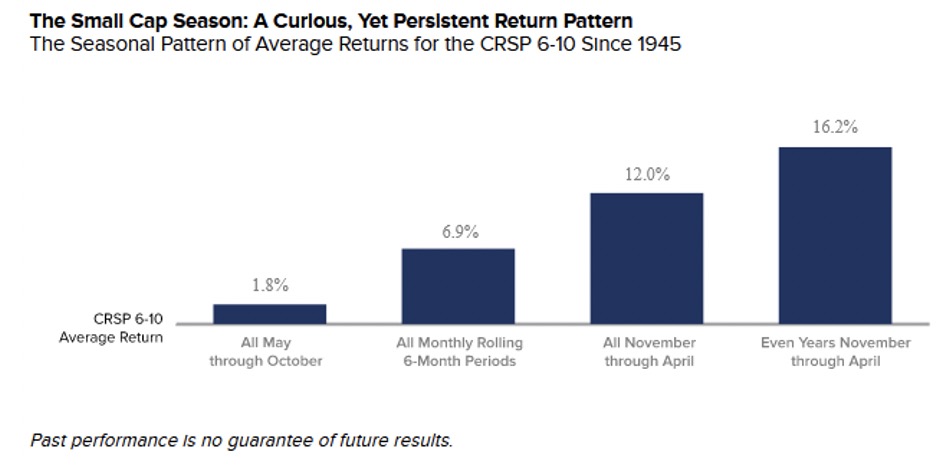
To this trio of signals, we would add two calendar-based patterns that lead us to expect that robust small-cap returns lie ahead. The first is the well-known and long-established pattern of seasonality, which we found is especially notable in even numbered years. We analyzed this pattern back to 1946 and found that, while the average small cap return for all six-month periods was 6.9%, the average from November through April was 12.0%. In even numbered years, this

What accounts for this longstanding, 75-year return pattern? The most widely held theory is that presidential and midterm elections held in even numbered years create uncertainty for small-cap stocks, which has had a negative effect on share prices, just as increased high-yield spreads and rising VIX levels historically have. This uncertainty may have contributed to below-average performance in the six months prior to the elections and above-average performance afterward, when greater clarity emerges on fiscal and regulatory policies.
Another calendar pattern also forecasts a change in the weather for small-caps. Two related aspects of their returns are easily recognized by those of us who focus on this area of the stock market. First, small-caps tend to have deeper declines than large caps, absorbing risk concerns to a greater extent. However, the second aspect is that they typically rebound more robustly than large-caps, often delivering outsized returns in the early part of their recovery.
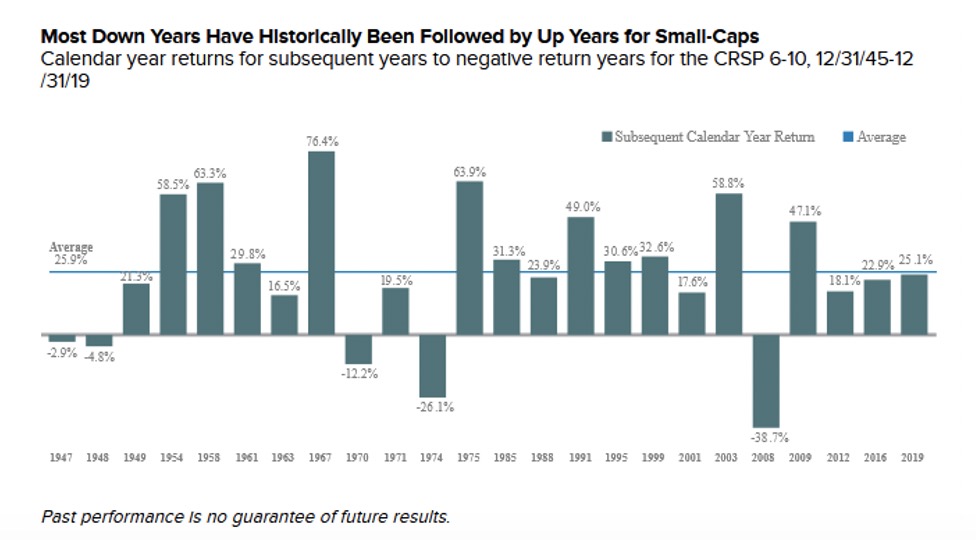
Small-cap’s tendency to enjoy robust recoveries is visible in several ways. One pattern that has so far received less attention than we think it should is for robust returns in the calendar year following a down year. In our analysis of small-cap returns since 1946, we identified 24 years with negative returns. In 19 of the subsequent years, or 79% of the time, small-caps posted positive returns, which contrasts with 65% of positive years following a positive year. Yet arguably the most notable finding was that the average return for those years following a negative year was 25.9%, significantly higher than the average 10% return for calendar years following a positive small-cap return.
Let’s look more closely at the three periods, encompassing five different calendar years, when we saw consecutive negative calendar years, and examine to what extent we can see parallels to the current environment. The most recent consecutive negative year experience was the Global Financial Crisis (“GFC“), when both 2007 and 2008 were negative. Our view is that the current downturn is not likely to deepen into a similar experience primarily due to the much stronger position of household and bank balance sheets compared with the earlier period. While a recession in the U.S. seems more likely than not, current indications point to a short and shallow contraction, further reducing the likelihood of a GFC repeat.
The prior period of negative calendar year small-cap returns was a string of five negative years out of six—1969, 1970, 1971, 1973, and 1974. Our founder, Chuck Royce, was a professional investor during this period, so we can perhaps offer more insight than most into the parallels. This period was marked by surging and persistent inflation, which led to consistent losses for both stock and bond investors. The current surge in inflation is leading some market commentators to see a repeat of that miserable 1970’s experience, yet we see this scenario as unlikely. Our view is that inflation in the 1970’s became persistent and unprecedentedly high in the U.S. because the Federal Reserve acted too slowly and inconsistently. However, we do not see the Fed repeating that behavior. After a slow start, it has demonstrated a resolve that few expected. Currently, the Fed is more often criticized for being too hawkish than being too unresponsive. Additionally, we are already seeing indications that the current bout of inflation may have peaked.
The earliest period of multi-year negative small-cap returns came in 1946-48, placing it well outside most active investors’ experience. This period was dominated by establishing a new equilibrium following the end of WWII. One of the biggest economic effects was an unprecedentedly large reduction in federal spending, from 41% of GDP in 1945 (driven by war-related spending) to 11% in 1948, resulting in a shift from a 21% deficit in 1945 to a 4.5% surplus in 1948. For reference, the estimate for federal spending for fiscal 2022 is 24.1% of GDP. Thus, it is mathematically impossible to have a comparable reduction of 30% of GDP derived from fiscal spending to what was seen in the early post-war period. We are not taking a position in the debate about the appropriate level of federal spending, just noting that the extreme fiscal contraction in the 1945-48 period that likely contributed to small cap’s three consecutive years of negative returns is unlikely to be repeated in the near term.
So, in the past 75 years, there have been only three periods where we’ve seen consecutive negative return years for small caps—each an extreme experience that seems unlikely to be repeated, at least to us. Does this mean that we couldn’t see an unprecedented negative development that gives small-caps a negative return next year? It does not. The future will continue to surprise us on the up and downside. Having said that, we think the more relevant question is, what are the probabilities for attractive prospective small-cap returns based on what we can glean from the past? We believe that the probabilities are good to excellent. With low trailing returns, above-average risk readings, and two positive calendar patterns all providing support, we believe that investors committing capital to small-caps now will enjoy attractive results in the years to come.
Read more commentaries by Royce Investment Partners