At -20%, the first half of this year officially went down as the worst 6-month period to start the year for the stock market (as measured by the S&P 500) since 1962 when it returned -22%. While 1970 came close to matching this year's -20.0% first half return, once you include dividends it did slightly better in 1970 at -19.5%.
Unfortunately for investors, bonds also had one of the worst first half starts to a year on record with a return of -10.4% (as measured by the Bloomberg US Aggregate bond index) which is the worst start to a year since the index's inception in 1973. By some accounts you would have to go back to before the 1900s to find worse performance for government bonds1.
The Whatchamacallit
Are we in a recession? Are we in a “Growth Slowdown”? How do we know when we are in a recession and who defines a recession anyway? Does it even matter what they call it?
You will commonly hear a recession defined as two consecutive negative quarters of real Gross Domestic Product (GDP). While it is true most recessions in the past have contained two consecutive quarters of negative GDP, not all have (the recessions in 1960 & 2001 did not meet this definition). Although, it is also true that since 1950 every period that has contained two consecutive quarters of negative GDP have overlapped with periods that have ultimately been determined to be recessionary periods.
The reality is that in the US recessions are ultimately dated by the National Bureau of Economic Research (NBER). The NBER defines a recession as “a significant decline in economic activity that is spread across the economy and that lasts more than a few months”. Some of the important economic data points beyond GDP that go into that determination are industrial production, retail sales, jobs and personal income adjusted for inflation.
First quarter GDP came in negative and according to the Federal Reserve Bank of Atlanta second quarter GDP is currently on pace to come in negative as well at -1.2%2. So it is completely possible that we already meet the more simplistic definition of a recession that the media often latches onto (The official GDP number will be released on July 28th).
It should be noted however that when it comes to jobs, which is what people generally think of when talking about a recession, there are very little signs of a recession at this point. Job losses have not lined up with the negative GDP numbers since the start of the year.
In fact, there were more jobs added in the first half of this year than any 6-month period during the entire 10-year expansion following the 2008-2009 financial crisis3. Unfilled job openings also remain near all-time highs and the number of unemployed people per job opening at all-time lows. If this were determined to be a recession it would be the first recession going back to at least 1950 where there was not a single month of job losses that coincided with the two consecutive quarters of negative GDP.
Are Recession Dates Even Relevant?
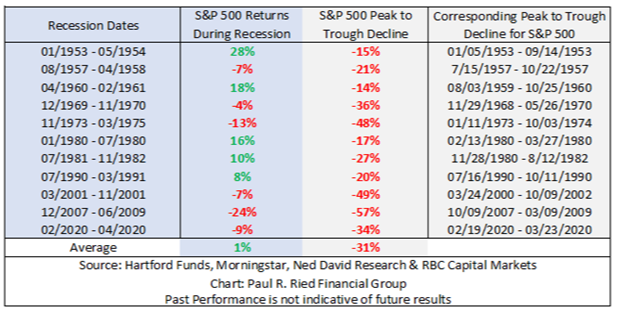
While the official dates of recessions might be useful for historical purposes, they are not very useful when it comes to investing. The NBER has historically waited anywhere from 4 to 21 months after the start of a recession to officially declare the start date4. Even if you timed the exact month a recession was going to start in real time and perfectly timed the end of a recession, historically you would have still been exposed to the majority of the corresponding market declines which have taken place around recessions….and in 5 of the last 11 recessions you would have actually missed out on gains.
The chart below shows both the official recession dates with the corresponding returns of the S&P 500 during the recession, as well as the max peak-to-trough declines the market experienced around each recession with the dates of those declines.

As you can see, the reason the majority of the market decline is not avoided by avoiding the actual recessions is because markets generally start falling in advance of the recession and start their recovery before the recession is even over. As we discussed in our August 2020 commentary, historically the market has begun falling 6 months prior to the start of a recession and has begun its recovery about 4 months before the end of a recession…..Although the ranges around these averages have been very wide.
Tempering the Pessimism
It’s easy to get caught up in the media reactions to negative economic data. However, it is important to constantly remind yourself that the stock market is not the economy, and the economy is not the stock market…..they can and do often move independently.
While we showed earlier the performance of the stock market during the official recession dates of the past, it might also be worthwhile to take a look at the more simplistic definition of a recession often used by the media (two consecutive quarters of negative GDP) and see if past periods warranted investor panic.
It is important to remember by the time we get two quarters of negative GDP the economy has already been struggling. So how has the stock market performed going forward after such events?
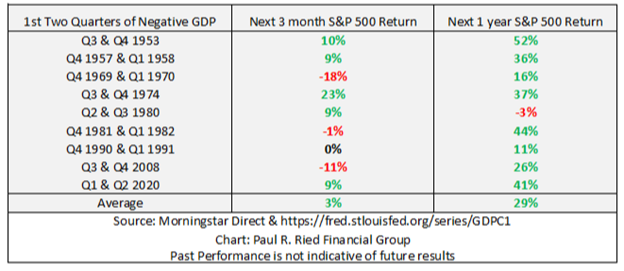
The below chart shows every recession since 1950 that included two consecutive quarters of negative GDP (which is every recession except for 1960 & 2001). We then look at how the S&P 500 performed going forward after those periods of negative growth for the next 3 months, as well as the next year.
All but one of the periods resulted in very strong double digit returns over the following year. Obviously, past performance is not necessarily indicative of future performance, further market struggles are definitely on the table. However, it’s important to at least be aware of the past to help counter the impulse to make knee jerk reactions regarding your portfolio when you hear constant “recession talk” on the news.
Keeping it Simple
I have thrown a lot of numbers at you but the key takeaway is that the market may not always act the way our initial instincts might lead us to believe. This isn’t just about recessions, it applies to the multitude of risks whether we are talking about Russia & Ukraine, China & Taiwan, COVID, inflation, supply chains, interest rates, Federal Reserve policy….the list goes on. Deviating from your plan due to the news of the day often doesn’t turn out the way you might assume.
While the start to this year has been one of the worst on record for both stocks and bonds, we believe this has only reinforced the importance of broad diversification and disciplined active management.
It’s important to keep the focus on the long-term. Your portfolios were designed with the understanding that recessions and bear markets are inevitable. The goal is not to avoid these risks but to build portfolios durable enough to withstand them and still meet your long-term objectives.
As always, we are here to serve you. We encourage you to reach out to us should you have any questions or concerns.
Prepared By:
Adam Jordan, CIMA®, AAMS®
Director of Investments/ CCO
Investment Advisor Representative
1 - https://www.wsj.com/articles/its-the-worst-bond-market-since-1842-thats-the-good-news-11651849380
2 - https://www.atlantafed.org/cqer/research/gdpnow as of 7/8/22
3 – Jobs as measured by Total Nonfarm Payroll - https://fred.stlouisfed.org/series/PAYEMS
4- https://www.nber.org/business-cycle-dating-procedure-frequently-asked-questions
https://www.hartfordfunds.com/practice-management/client-conversations/financial-planning/10-things-you-should-know-about-recessions.html
Opinions expressed are not intended as investment advice or to predict future performance. All information is believed to be from reliable sources; however, we make no representation as to its completeness or accuracy. All economic and performance information is historical and not indicative of future results. No investment strategy can ensure profits or protect against loss. The return and principal value of bonds fluctuate with changes in market conditions. If bonds are not held to maturity, they may be worth more or less than their original value. Past performance does not guarantee future results.
Investors cannot invest directly in indexes. The S&P 500 is a capitalization-weighted index of 500 stocks designed to measure performance of the broad domestic economy through changes in the aggregate market value of 500 stocks representing all major industries. The performance of any index is not indicative of the performance of any investment and does not take into account the effects of inflation and the fees and expenses associated with investing. The Bloomberg Barclays U.S. Aggregate Bond Index, which was originally called the Lehman Aggregate Bond Index, is a broad based flagship benchmark that measures the investment grade, U.S. dollar-denominated, fixed-rate taxable bond market. The index includes Treasuries, government–related and corporate debt securities, MBS (agency fixed-rate and hybrid ARM pass-throughs), ABS and CMBS (agency and non-agency) debt securities that are rated at least Baa3 by Moody’s and BBB- by S&P. Taxable municipals, including Build America bonds and a small amount of foreign bonds traded in U.S. markets are also included. Eligible bonds must have at least one year until final maturity, but in practice the index holdings has a fluctuating average life of around 8.25 years. This total return index, created in 1986 with history backfilled to January 1, 1976, is unhedged and rebalances monthly.
Read more commentaries by Paul R. Ried Financial Group