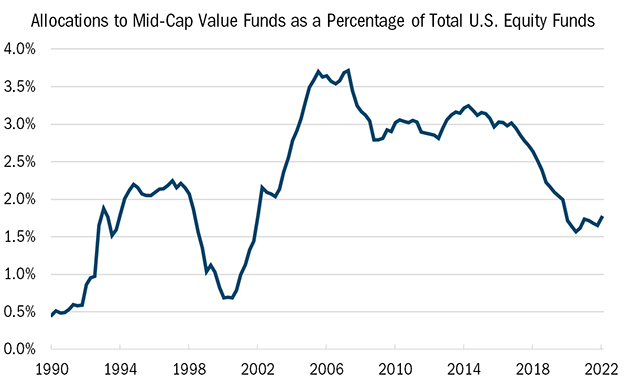
Source: Lipper & Company, L.L.C. The chart above allocations to mid-cap value funds as a percentage of total U.S equity funds from 3/31/1990 to 3/31/2022. All indices are unmanaged. It is not possible to invest in an index. Past performance does not guarantee future results.
There’s a tendency among investors to conflate exposure to the S&P 500 with exposure to the broad market, even though these stocks are almost all large caps. No less an authority than Warren Buffett has fallen into this trap, when he publicly announced that he would like 90% of his money invested in the S&P 500 and 10% in bonds for his wife after he dies.
To be sure, the lower end of the S&P 500 universe does provide a modicum of exposure to smaller stocks. But the 100 smallest stocks in the S&P 500, with a median market capitalization of around $10 billion, account for just 3% of the entire index. At the same time, exposure to the S&P 500 is actually narrower than is often assumed. Earlier this year, just five mega-cap growth stocks accounted for nearly a quarter of the index, which isn’t surprising given that the S&P 500 is a market-capitalization weighted index where the biggest stocks hold the most sway.
Many investors have been willing to overlook this for much of the past decade because large stocks have outpaced the rest of the market during this period. But the market’s biggest stocks don’t always outperform, as investors have found out at the start of this year. In fact, history shows that over long stretches of time, mid-cap stocks have beaten large caps in both absolute and risk-adjusted terms. From January 1994 through the end of 2021, the S&P Mid Cap 400 Index has produced annualized returns of 11.9%, versus 10.7% for the S&P 500.


