Until recently, inflation and interest rates had been on a secular downtrend after peaking in the early 1980s. For the first time in four decades, however, inflation is rapidly approaching double digits and posing a credible threat. The market is not overly concerned that inflation will persist long-term, as it is discounted to return to the low 2-3% levels to which we’ve become accustomed. 1 But with Russia’s invasion of Ukraine, tight housing and labor markets, and lingering supply shortages, inflation may continue to surprise to the upside despite the Fed’s plans to tighten.
Many investors seem to think that stocks are a good inflation hedge, but historically they have been the opposite – slightly underperforming cash during rising inflation environments. We believe investors should not rely on this asset class to protect them should we return to a 1970s-type economic climate.
Conceptually, Rising Inflation Is Bad for Stocks
A company’s value is primarily driven by its long-term profitability and the discount rate used to value those future cashflows. Inflation increases the cost of inputs (commodities, labor, rent, goods and services, etc.) and capital expenditures, as well as the cost of financing operations and investment due to higher interest rates. Most businesses are unable to pass on all these cost increases by raising prices or can do so only with a lag, so margins are squeezed. Inflation can also hurt demand, as consumers who pay more for gas, food and housing have less money for discretionary spending. In addition, higher inflation is typically associated with higher interest rates (as central bankers tighten monetary policy to bring inflation down), which can make major purchases, often bought with borrowed money like cars and homes, less affordable. Higher interest rates can also produce a downward pressure on stock prices because of an increase in the discount rate used to value a company’s future cash flows, resulting in lower valuation multiples.
Finally, inflation can also impact a company’s operations. Inflation can create substantial uncertainty, making it difficult for companies to plan and invest for the long term. And if it’s caused by supply shocks, that can hamper production, not just make it more expensive, as we’ve witnessed during the pandemic and the Russia-Ukraine war.
Historically, Rising Inflation Has Been Bad for Stocks
Equity returns are by and large impacted by surprises rather than absolute results. What matters is not whether inflation is high or low, but how it transpires relative to what was expected. This is because the market constantly factors in current market and economic conditions as well as expectations for the future in the current price. It wouldn’t make sense for investors to ignore these factors when determining how much they are willing to pay for an asset.
We can use long-term historical data to assess the performance of equities during rising inflation periods. Our analysis applies two different methodologies to capture inflation surprises. The first focuses on an inflationary decade, the 1970s – the last extended period when inflation unexpectedly soared to record levels. The second identifies all periods across time (short and long) when inflation surprised to the upside.
The 1970s
U.S. inflation averaged over 7% per year in the 1970s, greater than any time before then. The market persistently underestimated the increase in inflation, assuming a reversion to the mean (which made sense since inflation had never been so high). This resulted in a protracted stretch during which inflation outpaced what had been discounted. U.S. stocks underperformed inflation and trailed the return of cash over the full decade, returning 5.8% per annum versus 6.3% for cash and 7.4% for inflation. Investors would have been better off leaving their money in cash than investing in the stock market for 10 years. That’s a long time to invest and a lot of volatility to endure for negative excess returns. 2
All Periods
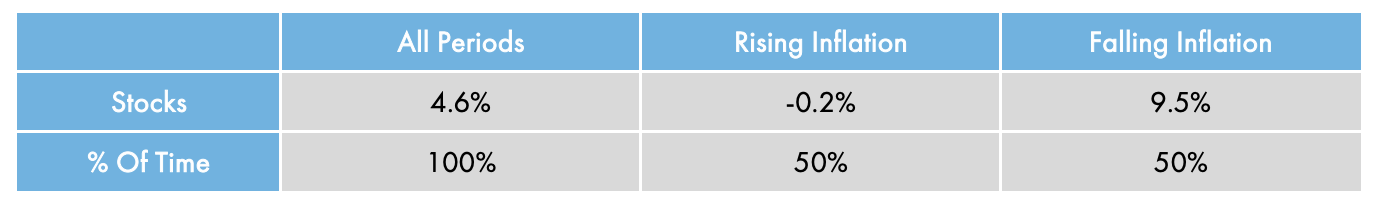
We can expand our data set to include all periods beyond the exceptionally high inflationary environment of the 1970s. A simple method to determine whether inflation is rising or falling versus expectations is to compare the current inflation rate to the recent inflation trend. If inflation comes in above trend, then that could be considered a rising inflation period. The logic is based on the observation that most market participants expect the future to closely resemble the recent past, which can be approximated with the trailing 12-month average inflation rate. Exhibit 1 provides the average excess return of U.S. stocks above cash since 1970 during rising inflation and falling inflation periods.
Exhibit 1: U.S. Equity Annualized Excess Returns by Rising/Falling Inflation Environments (1970–2022)3

Note that equities have underperformed cash during rising inflation environments going back to 1970. This is a critical data point because it not only applies to the high inflation of the 1970s but to all rising inflation periods. Importantly, about half the periods since 1970 can be characterized as rising inflation using this methodology while the other half are falling. This makes sense since inflation is as likely to surprise to the upside as it is to surprise to the downside. This is the case even during secular down-waves in inflation, during which there will inevitably be interim stretches of rising inflation.
Portfolio Implications
Most portfolios are overweight stocks because investors expect them to deliver high returns over the long run. While U.S. stocks have averaged over 9% per year since 1970 (earning about 5% above cash), as shown in Exhibit 1, the returns are heavily skewed towards falling inflation environments. The difference is even starker in real teams (i.e., adjusted for inflation). As a result, equity-centric portfolios are biased to do well when inflation is falling and poorly in the opposite environment. Whether they realize it or not, investors in traditional portfolios are implicitly betting that inflation will surprise to the downside. Given the growing risks of inflation surprising to the upside for an extended period (particularly since the market is still pricing in low inflation longer-term), this doesn’t seem to be a bet that investors would knowingly wish to make.
It could also be risky for investors holding equity-centric portfolios to use historical market downturns over the past few decades as a reference point to “buy the dips.” During the secular downtrend of falling inflation, the Federal Reserve had the luxury of being able to cut interest rates and engage in money printing whenever growth disappointed and stocks suffered a bear market. Equity markets were cut in half during the major recessions of 2000-2002 and 2008- 2009 but swiftly recovered once monetary policy shifted to easing. When COVID-19 caused one of the steepest market declines in history in early 2020 (stocks fell by a third in just five weeks), the Fed saved the market again with massive monetary stimulus, subsequently producing one of the strongest bull markets ever. Predictably, investors have grown accustomed to buying on downturns with the anticipation that the market always comes back.
We don’t know what the next economic downturn will look like or what will cause it, but what is clear is that the tools available to reverse a slowdown are more limited than in previous bear markets. Faced with high inflation levels, central banks are focused on restoring price stability by tightening monetary policy and will likely be slower to engage in renewed stimulus.
Diversify with Better Inflation Hedges
Fortunately, there are easy-to-access asset classes that potentially offer better inflation protection than equities. Adding these exposures to a portfolio could make it more balanced to different inflation outcomes and more resilient over a long period of rising inflation. Four major asset classes are commonly viewed as good inflation hedges: industrial commodities, gold, TIPS and real estate.
One way to hedge against rising inflation is to invest in industrial commodities like energy, metals and agriculture. Prices of these commodities are part of the standard inflation measurement, the Consumer Price Index (CPI), and indirectly impact the prices of many other inflation-basket items like goods, dining, and travel. By investing in the underlying commodities, investors can effectively hedge the risk of rising prices.
There are two main ways to gain industrial commodity exposure in portfolios. First, investors can buy the equities of commodity producers that benefit from rising commodity prices because they extract and sell the commodities. Commodity stocks performed well during the 1970s and have done better than the broad stock market during rising inflation environments, including thus far in 2022. 4 Alternatively, commodity futures provide more direct exposure to commodity prices than commodity-producer stocks. One potential issue with commodity futures is their lower historical returns over the long run compared to commodity-producer equities, although futures have offered a higher correlation to inflation during inflationary episodes. 5
We separate gold from the broader commodity basket because it serves as a storehold of wealth and is the oldest currency in the world. Gold is a monetary inflation hedge, as it tends to do well when the supply of paper money increases. It is also biased to perform better when growth falls and particularly in crises, as capital flows into gold as a safe-haven asset. Industrial commodities, on the other hand, have a propensity to do better in a rising growth environment, as economic growth drives more demand for raw materials.
TIPS, or Treasury Inflation-Protected Securities, are perhaps the purest inflation hedge. These are governmentguaranteed bonds (like nominal Treasuries) that pay an interest rate indexed to CPI. The higher the inflation rate, the more TIPS investors receive. U.S. TIPS were not created until the late 1990s, so historical returns during the 1970s are not available. That said, TIPS would have presumably performed well, as high inflation rates would have been passed through to investors, and real yields (nominal yields minus inflation) fell over the decade (i.e., nominal interest rates didn’t keep up with surging inflation).
Real estate’s inflation-hedging benefits are less clear because real estate faces competing influences during risinginflation environments. Real estate is a real asset that should generally benefit from rising prices of goods, services and commodities. In fact, the cost of housing makes up about a third of the CPI measure. However, real estate is often purchased using leverage, which can become more expensive due to higher interest rates. The type of real estate also matters. Assets with long-term leases often perform poorly, as rents fall behind the market and fail to keep up with inflation and rising costs (maintenance, management, taxes, etc.). And to the extent inflation hurts people and businesses, it can affect tenants' ability to pay. Finally, as interest rates rise, so do capitalization rates (the property’s yield), as real estate must re-price just as equities do to offer competitive returns. Therefore, inflation can often hurt real estate in the same ways as it does any other business.
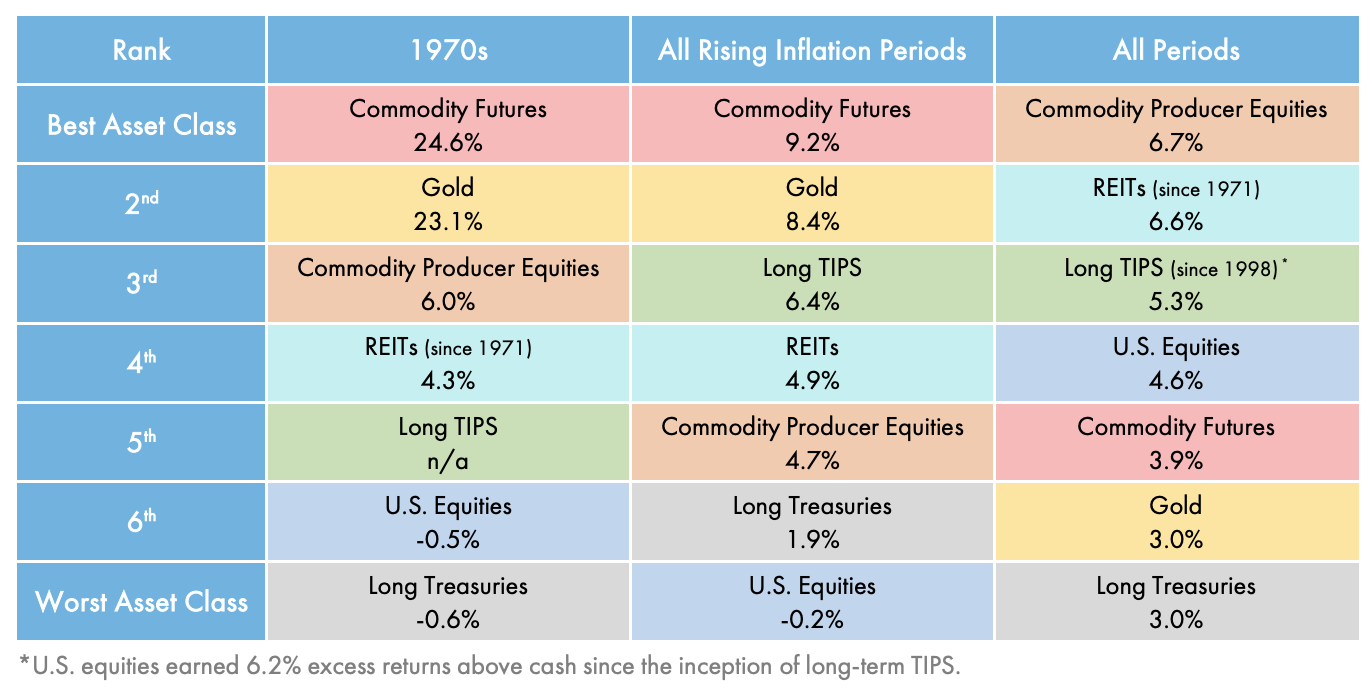
Exhibit 2 summarizes the returns of these inflation-hedging asset classes relative to cash in the 1970s (when cash averaged 6.3%) and during all rising inflation environments (when cash averaged 4.6%). We also list the long-term average excess return of each asset class over all periods since 1970 and include U.S. stocks and long-term Treasuries in each category for reference.
Exhibit 2: Major Asset Class Annualized Excess Returns (1970-2022)6
Given the mounting risk of rising inflation and the poor performance of equity markets during similar historical periods, inflation protection is probably more critical today than at any time during the past few decades. We encourage market participants and investors to consider adding inflation hedges.
Endnotes
1 5-Year forward inflation expectation rate is 2.59% as of 4/22/22. Data source: https://fred.stlouisfed.org/series/T5YIFR
2 “Excess return” refers to the total return of an asset less the return of cash. In this example, equities had a negative excess return since they underperformed cash over the referenced period.
3 Data source: Bloomberg and Evoke Advisors analysis 12/31/69 to 3/31/22. Indexes used: Russell 3000 from 12/31/78 to 3/31/22 and S&P 500 from 12/31/69 to 12/31/78.
4 Data source: Bloomberg and Evoke Advisors analysis 12/31/69 to 3/31/22. Indexes used: Russell 3000 from 12/31/78 to 3/31/22 and S&P 500 from 12/31/69 to 12/31/78 for U.S. equities; Morningstar Global Upstream Natural Resources from 12/31/69 to 3/31/22 for commodity producer equities.
5 Data source: Bloomberg and Evoke Advisors analysis 12/31/69 to 3/31/22. Index used: Bloomberg Commodity from 12/31/69 to 3/31/22 for commodity futures.
6 Data source: Bloomberg and Evoke Advisors analysis 12/31/69 to 3/31/22. Indexes used: Russell 3000 from 12/31/78 to 3/31/22 and S&P 500 from 12/31/69 to 12/31/78 for U.S. equities; Morningstar Global Upstream Natural Resources from 12/31/69 to 3/31/22 for commodity producer equities; Bloomberg Commodity from 12/31/69 to 3/31/22 for commodity futures; FTSE NAREIT from 12/31/71 to 3/31/22 for REITs; Merrill Lynch TIPS 15+ Years from 4/30/98 to 3/31/22 for long TIPS; spot price of gold from 12/31/69 to 3/31/22 for gold; Bloomberg U.S. Long Treasury from 1/31/73 to 3/31/22 and Ibbotson SBBI Yearbook 2016 Long Term Govt Bond Returns from 12/31/69 to 1/31/73 for long Treasuries.
Important Information
Past performance is not an indication of future results.
Advanced Research Investment Solutions, LLC (“ARIS”) and Evoke Wealth, LLC (“Evoke Wealth”) (collectively referred to hereinafter as “Evoke Advisors”) are SEC-registered investment advisers that provide investment advisory services and investment consulting services to a select set of clients and pooled investment vehicles. None of Evoke Advisors’ services are intended to represent a complete investment program. This publication is for educational, illustrative and informational purposes only and does not represent investment advice or a recommendation of or as an offer or solicitation with respect to the purchase or sale of any particular security, strategy or investment product, or any Evoke Advisors investment product mentioned herein. Past performance is not indicative of future results. Different types of investments involve varying degrees of risk, including possible loss of the principal amount invested. Therefore, it should not be assumed that future performance of any specific investment or investment strategy (including the investments and/or investment strategies recommended and/or undertaken by Evoke Advisors), or any non-investment related content, will be profitable, equal any corresponding indicated historical performance level(s), be suitable for a client’s portfolio or individual situation, or prove successful. Nothing contained herein is intended to predict the performance of any investment. There can be no assurance that actual outcomes will match the assumptions or that actual returns will match any expected returns. This publication does not constitute, and should not be construed to constitute, an offer to sell, or a solicitation of any offer to buy, interests in any Evoke Advisors-sponsored fund, which can only be made by means of an offering memorandum and other governing documents for the respective fund. This publication does not take into account your particular investment objectives, financial situation or needs, should not be construed as legal, tax, financial or other advice, and is not to be relied upon in making an investment or other decision. Certain information contained herein constitutes forward-looking statements (including projections, targets, hypotheticals, ratios, estimates, returns, performance, opinions, activity and other events contained or referenced herein), which can be identified by the use of terms such as “may,” “will,” “should,” “expect,” “anticipate,” “project,” “estimate,” “intend,” “continue” or “believe” or other variations (or the negatives thereof) thereof. Due to various risks, assumptions, uncertainties and actual events, including those discussed herein and in the respective analyses, actual results, returns or performance may differ materially from those reflected or contemplated in such forward-looking statements. As a result, you should not rely on such forward-looking statements in making any investment decisions. Certain information contained herein has been obtained or derived from unaffiliated third-party sources and, while Evoke Advisors believes this information to be reliable, neither Evoke Advisors nor any of its affiliates make any representation or warranty, express or implied, as to the accuracy, timeliness, sequence, adequacy or completeness of the information. The information contained herein and the opinions expressed herein are those of Evoke Advisors as of the date of writing, are subject to change due to market conditions and without notice, and have not been approved or verified by the United States Securities and Exchange Commission (the “SEC”), the Financial Industry Regulatory Authority (“FINRA”), or by any state securities authority. This publication is not intended for redistribution or public use without Evoke Advisors’ express written consent.
© Evoke Advisors
Read more commentaries by Evoke Advisors