After a third quarter where large capitalization US equities were barely up and global equities were down, both came roaring back in the fourth quarter of 2021. The S&P 500 was up 11.1% and the MSCI All-Country World Index was up 7% between the end of September and December. Commodities were up a modest 1.5%. “Safe haven” assets were also up. Long-dated US Treasury bonds added 3.2% during the quarter and gold was up 4.1%. 1
For the full year 2021, “risk assets” significantly outperformed “safe haven” assets. Commodities were up a remarkable 38.8% and global equities were up 18.7%. Both bonds and gold were down on the year. Long-dated US Treasury bonds finished down 4.6% while a broader mix of fixed income securities that includes corporate bonds was down 1.8%. Gold was 4.2% lower over the twelve-month period.
Grey Owl’s All-Weather strategy finished the year up 6.7%. In comparison, a 60/40 benchmark was up 10.5%. 2
Beginning in the middle of the year, the equity market became more and more narrow. That is, only the largest stocks were contributing positively and the market capitalization indices like the S&P 500 significantly outperformed equally weighted and smaller capitalization indices. In the fourth quarter when the S&P 500 was up 11.1%, the Russell 2000 Growth index was down 0.1% and the ARK Innovation ETF (now a bellwether for innovative, yet speculative, growth companies) was down 14%. This market narrowing contributed to Grey Owl’s underperformance (we held positions in a few small capitalization stocks for too long), but it also presaged the current market downturn and a likelihood that the downturn continues for several months or quarters.
Market Internals Have Weakened Considerably
Despite the equity rally over the past few weeks (from oversold conditions), most equity indices remain down year-to-date and market internals remain weak. For example, Lowry’s Buying Power remains in a one-year downtrend and Selling Pressure in a one-year uptrend. Selling Pressure is now well above Buying Power.

In their most recent weekly missive, Lowry’s puts the Buying Power / Selling Pressure data in context.
Framing the unconvincing short-term picture are unchanged weak, long-term trends in Lowry’s core indicators. After falling to its most depressed level since early April 2020, the Net Percent Spread between Lowry’s Buying Power and Selling Pressure Indexes has made little effort to change its course. As has been the case since late June 2021, the Spread remains in a downtrend below its falling 40-week moving average (WMA). Historically, this condition is representative of an increasingly difficult investing environment – marred by high levels of Demand selectivity and punctuated by bouts of market volatility as well as sharp drawdowns.4
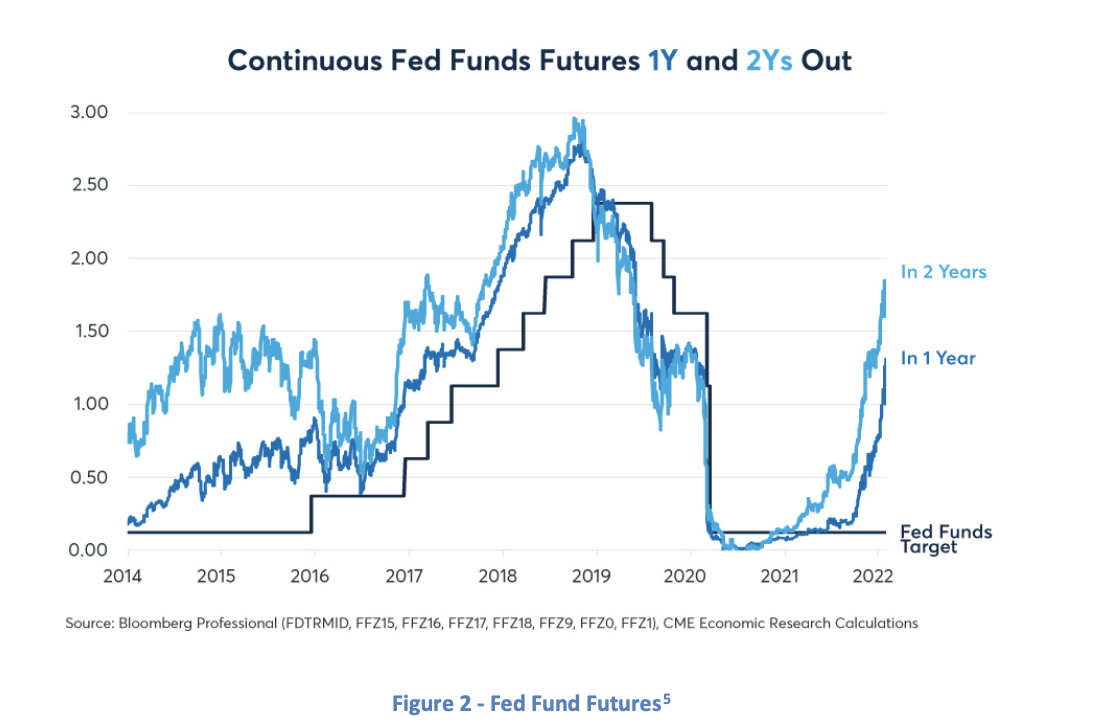
Broad equity market weakness has coincided with a rapid repricing of interest rates – all along the curve, but particularly at the shorter end. Toward the end of 2021, the market began to adjust expectations regarding the likelihood that the Federal Reserve would raise interest rates over the next year. In just a few months, the market went from expecting no rate hikes to today where six to seven are expected in the next year.
The repricing of interest rates has helped to feed the repricing of equity risk premia (i.e. stock prices have moved lower as interest rates have moved higher) and has contributed to the increase in market volatility. In a reflexive way, it is worth noting that if the Federal Reserve perceives their rate hike guidance responsible for a significant equity market correction, that could cause them to reverse the guidance.
All the while, the economic growth (i.e. the “reopening”) that followed the global lockdown response to Covid-19, is poised to slow significantly. How could it not as late-2020 to early-2021 saw unprecedented positive growth rates? By most measures, the positive growth rates peaked in April of 2021. For example, real personal consumption expenditures (PCE) were up 25% in April of 2021 compared to April of 2020. PCE growth rates have remained positive in the months since, but at a slowing rate.6 With significantly slowing growth, increased inflation, and rising interest rates, corporate profit margins are likely to come under significant pressure. This could very well make for a difficult investment environment.
Positioned for Economic Deceleration and Market Volatility
Over the last few months, the Grey Owl All-Weather portfolio has shifted to a decidedly more “all-weather” stance from the more “risk-oriented” positioning late in the third quarter of 2021. Our “safe haven” positions are the largest they have been in several years and our equity positions are now focused on low-volatility and staples. We do continue to hold modest positions in individual equities that are benefiting from the end of the Omicron variant’s spread, but we are likely to opportunistically sell those names as the current round of reopening is completed.
Strauss and Howe’s description of man’s use of technology to “flatten the very physical evidence” of cycles is correct. But, note they don’t suggest the elimination of the cycle itself. So to with economic and financial markets. Federal Reserve or no Federal Reserve, fiscal stimulus or not, economic cycles persist. Technology (and other exogenous forces) may (repeat may) be able to alter the shape of cycles, but there is no historical evidence that they can actually banish their existence.
As always, if you have any thoughts regarding the above ideas or your specific portfolio that you would like to discuss, please feel free to call us at 1-888-GREY-OWL.
Sincerely,
Grey Owl Capital Management, LLC
1 We refer to US equities, long-dated US Treasury bonds, gold, and commodities as “primary” asset classes borrowing the language of HCWE & Company. The idea is that these four assets best capture two variables that explain a significant amount of asset price movement: global growth (explained by investor risk sentiment) and inflation. This framework is the basis for a permanent portfolio, an “all-weather” portfolio, risk-parity, etc. US equities and commodities are “risk” assets, while US Treasury bonds and gold are “haven” assets. The market (or asset class) returns are measured on a total return basis using index exchange traded funds (ETFs): SPY for the S&P 500, ACWI for the MSCI All-Country World Index, GSG for the S&P GSCI Commodity Index, TLT for 20+ Year Treasury Bond index (i.e. “long-dated” US Treasury bonds), and GLD for gold.
2 The Grey Owl All-Weather strategy performance is taken from an individual representative account. The 60/40 benchmark is 60% ACWI and 40% AGG for the iShares Core U.S. Aggregate Bond ETF.
3 www.lowryondemand.com
4 Ibid. 5 https://www.cmegroup.com/insights/economic-research/2022/fed-rate-hikes-expectations-and-reality.html
Read more commentaries by Grey Owl Capital Management