People who have played both checkers and chess would likely agree that chess is the harder of the two games. Although both are played on a board with 64 squares, the rules of checkers are easier to learn, and the objective straightforward – take all your opponent’s pieces. Chess, on the other hand, is more complex, requiring a deeper level of study, strategy, and practice. There are six unique chess pieces, which move differently and have different value in the game. A player would readily sacrifice a pawn for the opponent’s rook or queen, for example, but not vice versa. And the king must be protected at all costs to avoid ending in checkmate. Even the most experienced players would admit they can always improve, which can only come through study and experience.
As we examine the municipal “board” at the start this new year, it looks to us to be a more challenging one than a year ago. More like chess than checkers. Winning will likely require a more complex, multi-faceted strategy than in 2021. Experience, study and caution will be rewarded.
Checkers in 2021
Despite a board full of uncertainty at the start of 2021, including Covid, labor shortages, supply chain bottlenecks, wage and price pressures, political uncertainty and shifting Fed views (to name a few!), two key portfolio decisions – Credit and Curve – determined the outcome of the game. It was relatively straightforward and if you executed the strategy well, you were rewarded.
Municipal credit was relatively cheap at the start of 2021 but became richer as the year progressed; credit spreads narrowed to record lows by year end. Investors recognized that the massive fiscal stimulus in 2020, with additional support from the $1.9T American Rescue Plan Act (ARPA) in early 2021, would strengthen even the weakest municipal credits and it did. In addition, state and local tax revenues rose sharply as the economy re-opened post-vaccinations, pushing reserve levels to new highs and budget surpluses to the highest level as a percentage of GDP in at least forty years. The result was that lower-quality credits significantly outperformed higher-quality; BBBs provided 438 bps of excess return over AAAs in 2021 (source: Bloomberg Municipal Index).
Managing the curve strategy was a bit more complicated as yields rose and the curve steepened, requiring more active curve management. As the curve steepened in Q1 our modest barbell was extended to capture the steeper slope. This was rewarded later in the year when longer-term rates fell and significant flattening occurred. By monitoring curve slope throughout the year, we were able to effectively balance the desire to optimize roll-down benefits while also maintaining a barbell curve allocation. Thankfully, an upwardly sloping yield curve provides investors opportunities to enhance returns over time and we were successful in doing so in 2021.
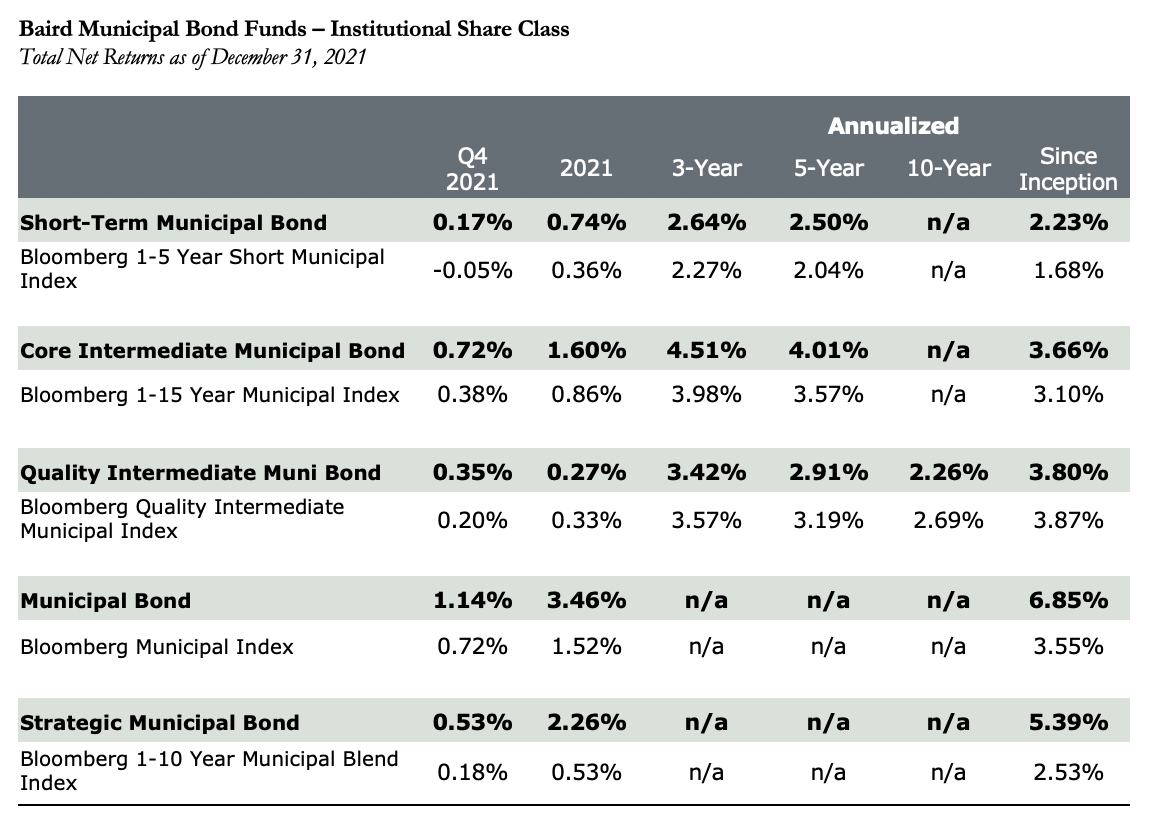
We had outlined our strategy at the start of 2021 as the “Four C’s – Carry, Credit, Compression and Curve.” In hindsight, we could have simplified it to just two C’s as Credit and Curve captured the board. Our fund shareholders were positioned to win, and they did as each of our full-credit fund strategies outperformed their respective benchmarks, net of fees, by a margin of between 38 – 195 bps for the year. The majority of the outperformance was driven just by those two decisions, Credit and Curve. Importantly, our other key portfolio decisions, such as Sector weightings and Security Selection, were also additive to performance.
Chess in 2022
2022 is a new game, same board. Although the path to outperformance in 2022 is likely more challenging, we continue to see opportunities to add value in a prudent, risk-controlled manner. The good news is that tax-exempt yields are higher than a year ago, offering investors more reward. Volatility may be higher this year than last, particularly if fund inflows slow from their record pace. But the aging boomers provide a favorable structural backdrop for the market given their growing need for post-retirement income.
The most obvious YoY change in valuations, however, is due to much narrower credit spreads. We expect the economy to slow from 2021’s 6% pandemic-recovery pace, but to remain above trend. Yet, both fiscal and monetary policy are in transition, moving from a tailwind for the markets since March 2020, to a headwind as policy positions normalize. Therefore, the easy money in municipal credit was made last year. From here, we expect individual credit selection and security structural analysis to play a more meaningful role.
There are some basic lessons from chess that we can apply to the municipal market this year. Here are three foundational principles we plan to keep in mind:
-
Appreciate the value of each piece – Like chess pieces, not all portfolio decisions are of equal value. Some have a greater influence on the game than others. For example, rogue movements of the king can end the chess game early, which is why it is highly protected. In bonds, ill-timed duration decisions can do the same. We maintain a neutral duration posture in all our funds (except for the unique risk-mitigation purpose in the Baird Strategic Municipal Bond Fund). We will instead analyze the value of each of our other key portfolio decisions, including Curve, Credit, Sector and Security Structure and Selection.
With fewer opportunities in Credit, the remaining decisions will take on a higher portfolio value in 2022. Good bond selection is important, and it has been our most consistent form of alpha over time. The structural complexities of individual securities create inefficiencies which can be analyzed to determine the risk/reward tradeoffs. Included in this are couponing and call feature nuances, as well as unique cash flow characteristics in Single-Family Housing bonds. In our view, this is not an environment for an aggressive strategy, but rather a period of prudence matched with experience.
-
Utilize as many pieces as possible – In chess, the pieces are analogous to an army sent into battle. Deploying as many pieces as possible, in a strategic manner, enhances the probability of victory. Successful chess players know their pieces are more powerful when they work and move together. Several pieces working together can often be stronger than one powerful piece. We too want to engage as many key decisions as possible in our portfolio construction process, rather than be overly reliant on one strategy. This involves not only analyzing the value of each decision, but also coordinating the deployment of each through a risk-management lens. This may lead to an over-, under-, or neutral-weighting relative to the benchmark across various decisions in a dynamic and holistic manner. To win consistently, a balanced attack is best, with all key decisions working together, like a bishop pair, or connected rooks.
Curve optimization and sector weighting decisions will certainly be deployed in 2022. Both the 1 – 5yr and 1 – 10yr segments of the municipal curve are steeper than at the start of 2021. Currently, the 7yr
maturity is the optimal position on the curve from a risk/reward perspective. We will look to capture as many opportunities along the curve as possible to enhance our returns. Among the sector allocations, we will remain overweight Revenue bonds but the valuation advantage relative to GOs is narrowing.
State and local governments are in the best fiscal shape they have been in since at least before the
financial crisis of 2008. Also, GO borrowings are likely to pick up to fund infrastructure needs and will be encouraged by the recent passage of the Infrastructure Investment and Jobs Act. We will also look for relative value opportunities among Revenue bonds, particularly in Healthcare, Education and Housing.
-
Be careful and stay humble – Chess players move cautiously thinking several moves ahead, evaluating the risk and reward of each move. Portfolio managers should do the same, asking with each decision, “What can go wrong?” “What is my next move?” Having an experienced team with diverse skills and talents is critical for this. At the same time, experience also proves that not all portfolio decisions will work as planned, just as not every chess move is a winner. Portfolio management and chess are humbling endeavors as any experienced player would admit – and humility is a virtue in both!
2022 looks to us like a year of measured moves, in which careful analysis and small, risk-controlled decisions will win the game. That’s a game we excel at – attempting to pick up incremental basis points of performance along the way. We look forward to the challenge. Start the clock!

Disclosures
Performance data quoted represents past performance. Past performance does not guarantee future results. Investment return and principal value of an investment in the fund will fluctuate so that an investor's shares when redeemed may be worth more or less than their original cost. The funds' current performance may be lower or higher than the performance data quoted. For performance current to the most recent month-end, please visit www.bairdfunds.com. Investors should consider the investment objectives, risks, charges and expenses of each fund carefully before investing. This and other information is found in the prospectus and summary prospectus. For a prospectus or summary prospectus, contact Baird directly at 866-442-2473. Please read the prospectus or summary prospectus carefully before investing.
Expense Ratio for the Institutional Share Classes is 0.30%; for the Investor Share Classes is 0.55%. Returns shown include the reinvestment of all dividends and capital gains. The Baird Quality Intermediate Municipal Bond Fund Since Inception net return is based on performance from March 31, 2001, through December 31, 2021.
The Baird Core Intermediate and Short-Term Municipal Bond Fund Since Inception net return is based on performance from August 31, 2015, through December 31, 2021. The Baird Municipal and Strategic Municipal Bond Fund Since Inception net return is based on performance from November 15, 2019, through December 31, 2021.
This is not a complete analysis of every material fact regarding any company, industry or security. The information has been obtained from sources we consider to be reliable, but we cannot guarantee the accuracy. Fixed income is generally considered to be a more conservative investment than stocks, but bonds and other fixed income investments still carry a variety of risks such as interest rate risk, credit risk, inflation risk and liquidity risk. In a rising interest rate environment, the value of fixed income securities generally declines and conversely, in a falling interest rate environment, the value of fixed income securities generally increases. High-yield securities may be subject to heightened market, interest rate or credit risk and should not be purchased solely because of the stated yield. Municipal securities may or may not be appropriate for all investors, especially for those in lower tax brackets. Because the Fund may invest more than 25% of its total assets in municipal obligations issued by entities located in the same state or the interest on which is paid solely from revenues of similar projects, changes in economic, business, or political conditions relating to a particular state or types of projects may have a disproportionate impact on the Fund. All investments carry risk, including loss of principal. In a rising interest rate environment, the value of fixed-income securities generally decline and conversely, in a falling interest rate environment, the value of fixed income securities generally increase.
© 2022 Robert W. Baird & Co. Incorporated. Member SIPC.
Robert W. Baird & Co. Incorporated. 777 East Wisconsin Avenue, Milwaukee, Wisconsin 53202. 800-79-BAIRD. rwbaird.com. First Use:1/2022.
© Baird
Read more commentaries by Baird