Contemplating a new year ahead, you may be wondering…what is going to happen? An old story serves as an analogy: Years ago, some men were on a leaky old ship in the middle of a rough and stormy sea. One of them asked the captain, "Are we safe?" The captain replied, "Well, the boilers are weak and may explode at any moment. The ship is taking on water. To be very honest with you, we may go up, or we may go down, but at any rate, we are going on." And "going on" is the way we face this new year.
We made it through 2021 without taking on water. But are we safe? This question is difficult to answer as we begin 2022 on a foggy day. At the beginning of this new year, we still face significant challenges, but there are also strong reasons for hope. Yes, there are challenges to overcome, such as a pandemic, geopolitical threats and inflation. But there are also potential opportunities within the economy and the equity markets. Let us probe through the mist together and explore what may be on the other side of the horizon by analyzing the charts.

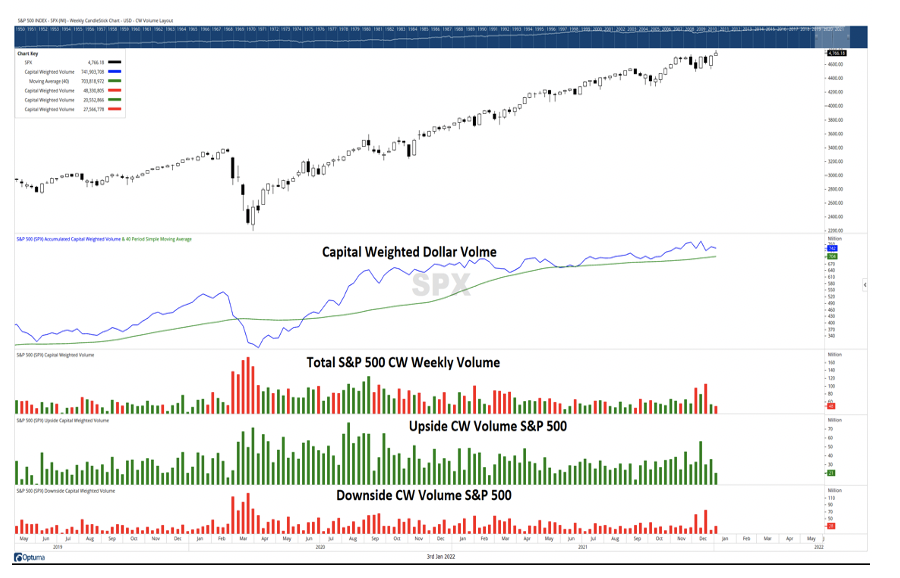
Source: OPTUMA www.optuma.com/volumeanalysis
Let's begin with the top panel showing the S&P 500. You need not be a market technician to discern that this index is in a clear uptrend. After consolidating in December, the S&P 500 hit new all-time highs last week, starting the new year off in bullish fashion. Notice the chart below the S&P is Capital Weighted Dollar Volume. It shows us how much money is flowing in and out of the S&P 500. Notice it is in an uptrend as well, confirming the S&P 500. Yet unlike the S&P 500, CW Volume is not at all-time highs, and its rate of ascent has significantly trailed the price index since March of last year. Overall, the trend is your friend…and the intermediate trend of the price index is very friendly right now.
Source: StockFinder, Worden Brothers
Moving on to the next chart, we have the S&P 500 again on the top panel. The blackline below the S&P price bar is the long-term trend going back well over a decade. In April of 2021, the S&P broke above this long-standing resistance represented by the blackline. Since then, we have tested this former resistance line, which is now acting as support. That support line is presently 4410, corresponding to its moving average support at 4315. A weekly closing violation of these levels would cause significant damage to my long-term technical outlook.
Why would I mention this? Let’s move on to the next panel below the S&P 500 price chart showing the % of stocks making new highs in green. Notice this leading indicator peaked in February of last year and has been trending down ever since. We can therefore garner that although the S&P 500 is near all-time highs, a high percentage of stocks may have resistance ahead.
Moving down one panel to the advance decline line, we see our market breadth charts' most significant leading indicator. The AD line was the first breadth indicator, along with capital weighted volume, to signal a bull market back in May of 2020. It was leading the charge before topping out in July 2021. Most importantly, its long-term uptrend was violated less than two months ago, in late November. This suggests that the liquidity that was fueling the market may now be dissipating.
Finally, the bottom panel, labeled % of stocks above trend, shows that this indicator is also in a firm down trend. This signifies that although the S&P 500 is trending higher, most US common stocks are actually below trend . Taking all three breadth indicators into account, overall market breadth is trending down and below trend, putting us on yellow alert. The generals are leading, but the majority of the troops do not appear to be following. This information gives us pause when contemplating putting new capital to work. Next, let's look at the chart below to discern what the volume flows may be telling us.
Price is the market testimony. Volume is our polygraph to validate price's testament. The first panel shows us capital weighted dollar volume, or how much money is flowing into and out of the S&P 500. Notice capital weighted dollar volume is above trend confirming price's testimony. Moving down to the middle panel, capital-weighted volume tells us if the number of shares traded supports the market's testimony. Capital weighted volume is also trending up at new highs. This volume indicator currently supports the price trend on an intermediate term basis. However, this leading volume indicator is just barely above trend. A break below capital weighted volume trend would trigger the enforcement of our risk management discipline, a volume analysis bear market. Thus, we are bullish but recognize we have weakened significantly since our bullish volume stance beginning April 2020.
Now, let's finish by looking at the next and final chart showing us the charts on a shorter-term basis.
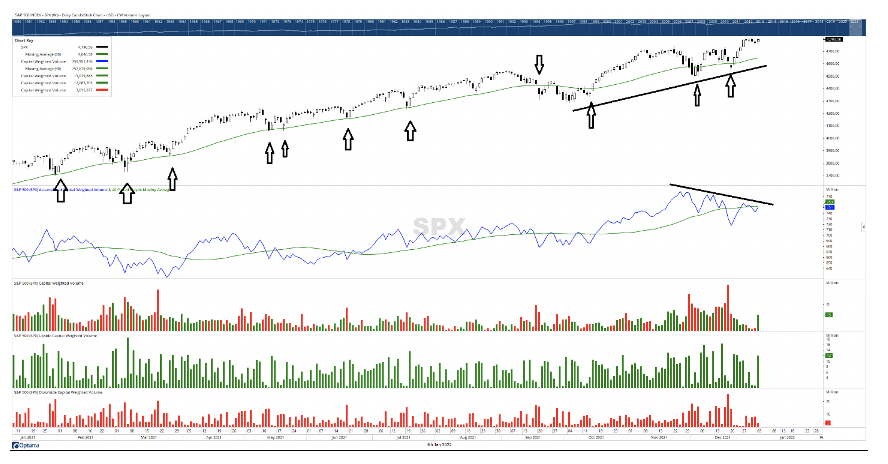
Source: OPTUMA www.optuma.com/volumeanalysis
The top panel is again the S&P 500, but this time on a daily basis, as opposed to a weekly basis. Focus your attention on the green line, which is the market's trend defined by its 50-day moving average. Note how last year, each time the S&P 500 touched its 50-day average (noted by the arrows), it was generally a good time to buy. The exception to this narrative was in September, when the market traded below trend for a month and a half before resolving to the upside. Notice how during that stretch, capital weighted daily dollar volume flows were also trading below trend, confirming the short-term weakness.
Similarly, pay attention to the black trend lines on the two charts. The price chart's trend line is moving higher; higher highs and higher lows. However, recent daily capital flows lows are lower, and the highs are also lower. This demonstrates classical divergence on a daily basis. Last year, with the exception of September, I suggested buying the dips at the 50-day moving average pullback. But now, like September, capital flow divergence again suggests a pause on pullback buying.
Overall, the market trend is up. Major Support is at 4410 and 4315 on the S&P 500.
However, market breadth appears to be weak and weakening. Capital flows are positive but weakening. In the aggregate, the charts are suggesting to stay long the market for now, while being cautious in buying dips with uninvested capital.
Wishing you all the best my friends!
Buff Dormeier, CMT®
© Kingsview
Read more commentaries by Kingsview