Fixed income markets are different from equity markets.
Let’s say that again.
Fixed income markets are different from equity markets.
This statement is absurdly self-evident when put into writing. But it’s not as obvious when put into the context of today’s market dynamics. A systemic shift toward index investing has conditioned investors to think of every asset class as an exchange-traded security and to think of every exposure as a directional call on an entire asset class. For many, the annual rebalancing going on right now is at least in part an exercise to decide if they think equities and/or fixed income will go up again in 2020. But what does “go up” really mean? The index revolution has eroded the distinctions between asset classes. It’s easy to forget that exchange-traded funds (ETFs) aren’t stocks; as with any fund, there are underlying securities whose prices are ultimately driven by their own unique math and subject to their own asymmetries.
For example, unlike equities, bonds do have quantitative upper bounds. For a bond, there is a calculable highest price. A bond won’t reasonably trade higher than the tightest yield investors are willing to earn. Even if that is zero (or in the case of some sovereign debt, negative1), the yield determines the maximum possible price. In that way, bond portfolios don’t have the same luxury as equity portfolios, blindly expecting a repeat of a prior year’s total return. Sure, the equity market might go up 31.5% again. We don’t think it’s likely, but it could happen. But the Bloomberg Barclays US Aggregate Bond Index (the “Agg”) was up 8.7% in 2019, and for investors to expect a repeat of this in 2020 is to ignore the fundamental, unassailable math that governs bond prices. We are not saying 2020 can’t be a positive year for fixed income. But we are saying that investors should probably trust the numbers.
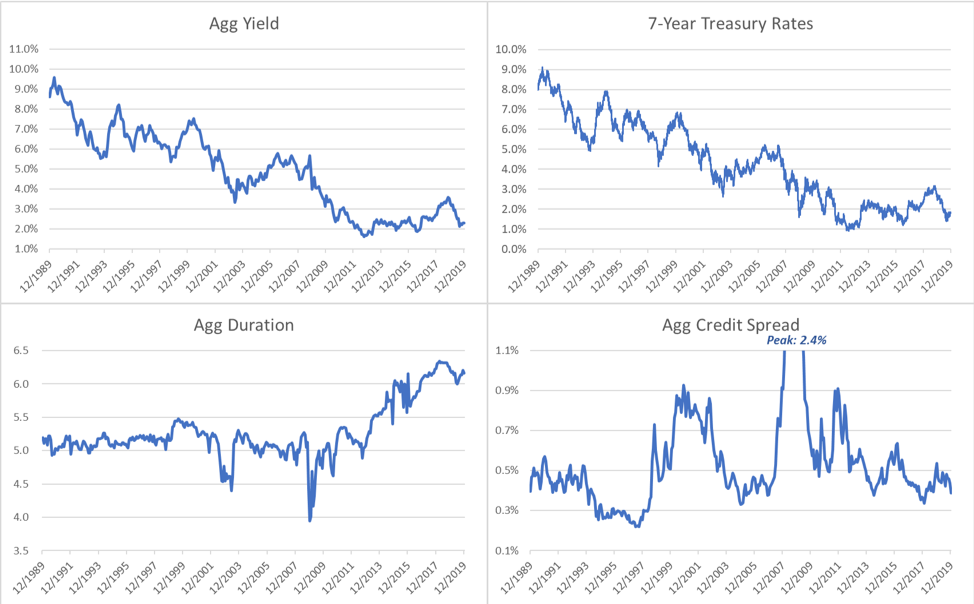
For the purposes of this discussion, we will focus on the Agg as the most common benchmark for broad market fixed income. At the start of 2020, the Agg had a duration of 6.16 years, an average credit spread of 0.39% 2 and an average yield-to-worst3 of 2.31%. To give readers a sense of how these values compare to the past, Figure 1 shows three charts, one for each datapoint, over the last 30 years, along with interest rates for the 7-year Treasury note,4 which finished 2019 at 1.83%.

Figure 1: 30-year history of 7-year Treasury bond interest rates and the yield-to-worst, duration and option-adjusted spread for the Bloomberg Barclays US Aggregate Bond index. (Sources: US Treasury, Bloomberg Finance LP)
From here, the bond math takes over. The Agg’s performance, for the most part, is driven by the yield and changes in interest rates and credit spreads. The magnitude of the impact of those changes is determined by the duration.5 Of course, if nothing changes, the index should be expected to return the start-of-year 2.31% yield as a base case.
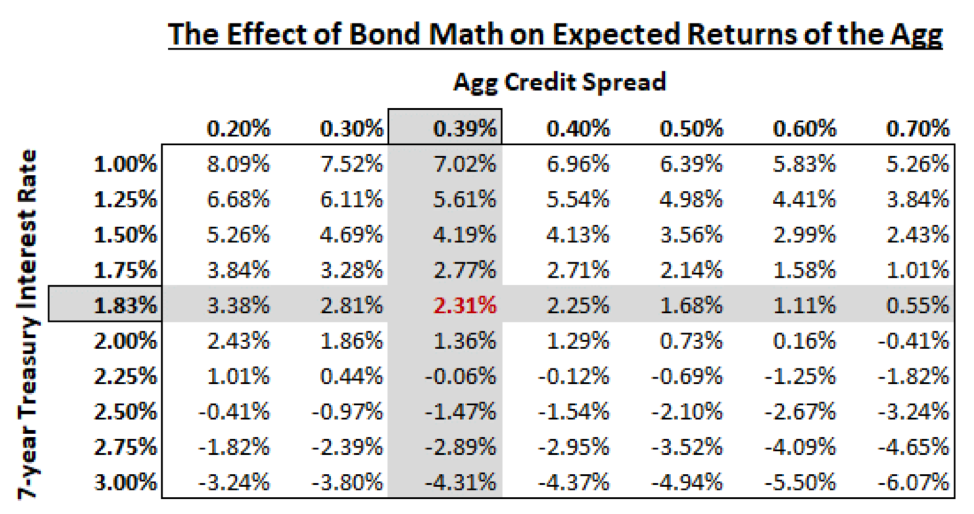
We suspect that most investors are expecting something else from their fixed income allocations, so the more interesting outcomes to our readers derive from various spread and interest rate scenarios. A matrix of such scenarios can be found in Figure 2. We’ll start with the unintuitive scenario that we believe would probably be required for the Agg to repeat an 8%+ total return. In this case, if credit spreads compress to their tightest levels ever (approximately 0.20%, last seen in 1997), interest rates would need to decline to around 1%, a level not seen in the 7-year Treasury since 2012 (see Figure 1). In our view, this is highly implausible; we can’t devise a realistic narrative around such an extreme move. The negative economic fundamentals needed to justify such dramatic quantitative easing are incompatible, in our view, with a decline in credit spreads by nearly 50%. A more realistic upside scenario might be one in which interest rates and credit spreads drift slightly lower. In our opinion, a best-case scenario for the Agg might be closer to a mid 4% total return if the markets were to see a 0.30% OAS and a 1.5% 7-year Treasury rate. That’s not bad, but it’s also far from certain and only one of many possible outcomes.
Figure 2: As of 12/31/2019, the yield-to-worst for the Agg was 2.31%, the option-adjusted spread for the Agg was 0.39% and the 7-year Treasury rate was 1.83%. The bond math formula we use for this illustration is: Expected Return = Current Yield + (1/2 * (Change in Spread + Change in Interest Rate)) + (Duration * (Change in Spread + Change in Interest Rate)). The first component of the equation assumes we earn the yield for a year. The second component adjusts the yield earned for changes in spreads and interest rates, assuming the change happens all at once midway through the year. The third component adjusts the total return for the mark-to-market impact of the credit spread and interest rate change, using the Agg’s 12/31/2019 duration of 6.16 years. Note that these calculations are provided to illustrate bond math and do not constitute a prediction of what will happen in 2020. Return expectations are presented gross of any management fees and are not intended to be indicative of any fund’s or strategy’s performance. The Agg is unmanaged and used for illustrative purposes only. It is not possible to invest directly in an index. (Sources: Zeo Capital Advisors, Bloomberg Finance LP)
We could see an equally (if not more) likely scenario in which the interest rate curve steepens so that the 7-year rate is slightly higher (say, 2%), with credit spreads widening to around 0.50% as leverage in the financial system begins to unwind in anticipation of a post-election reality, whether that reality is rooted in narratives of economic strength or policy shifts. In fact, we’ve seen a more pronounced version of these circumstances several times in the last few years with less-defined catalysts. In this case and many like it, our math would expect the Agg to deliver under 1% (or even go negative). We are not making the case for a pronounced down market here, but in this simple illustration, we hope readers can see the disproportionate risk of disappointment and middling performance that exists in the fixed income markets to start 2020. Every day that passes with spreads tightening or rates declining loads the spring even further, reducing the room to the upside while increasing the distance investors have to fall if things go the other way.
In reality, we would not be surprised to see some combination of the scenarios we’ve laid out. But that’s just the point. The task investors are given is not one of predicting what will happen but being prepared for whatever does happen. To lazily assume the upside and downside of any asset class is symmetric may be ill-advised in some cases (e.g. equities), but it is potentially very dangerous in fixed income. First, it’s objectively wrong; bond math governs an inherent asymmetry in fixed income which doesn’t disappear simply because it is ignored or misunderstood. Second, fixed income does not historically exhibit the correlation with equities to the extent we saw in 2019.
We fear that, rather than acknowledging their good fortune, investors are doubling down on it happening again. But the last time the market has seen two consecutive years in which the Agg has delivered over 5% total return was 2010/2011. The current economy is a very different level of risk than the one we saw just after the financial crisis. Rather than cheer the 2019 gain in fixed income and pat themselves on the back for a job well done, investors should realize that some of what should have been 2020’s performance was pulled back into 2019 in most duration-unconstrained strategies. This has reduced the already small cushion investors have if things don’t go as they expect… and maybe even if they do.
That said, a good investor still needs their fixed income allocation to serve its purpose. In our view, this is the time to put on a risk manager’s hat and look for those strategies which aim to earn their keep without counting on a decline in interest rates or credit spreads. In doing so, one can more confidently try to avoid compromising the expected return in a core fixed income portfolio while diversifying risks away from duration. Provided one finds managers seeking to manage risk rather than just to outperform beta, the result is an overall portfolio that can more effectively target both performance and consistency, an elusive combination in today’s fixed income markets.
DISCLOSURE: ZEO CAPITAL ADVISORS
Please remember that past performance may not be indicative of future results. Different types of investments involve varying degrees of risk, and there can be no assurance that the future performance of any specific investment, investment strategy, or product (including the investments and/or investment strategies recommended or undertaken by Zeo Capital Advisors, LLC (“Zeo”), or any non-investment related content, made reference to directly or indirectly in this commentary will be profitable, equal any corresponding indicated historical performance level(s), be suitable for your portfolio or individual situation, or prove successful. Due to various factors, including changing market conditions and/or applicable laws, the content may no longer be reflective of current opinions or positions. Moreover, you should not assume that any discussion or information contained in this commentary serves as the receipt of, or as a substitute for, personalized investment advice from Zeo. Please remember to contact Zeo, in writing, if there are any changes in your personal/financial situation or investment objectives for the purpose of reviewing/evaluating/revising our previous recommendations and/or services, or if you would like to impose, add, or to modify any reasonable restrictions to our investment advisory services. Zeo is neither a law firm, nor a certified public accounting firm, and no portion of the commentary content should be construed as legal or accounting advice. A copy of the Zeo’s current written disclosure Brochure discussing our advisory services and fees continues to remain available upon request.
1 We encourage readers to listen to our webinar where we discuss our views on negative interest rates. The webinar can be found at https://www.zeo.com/content/#investor-calls.
2 Specifically, this was the average option-adjusted spread (OAS) of the Agg on 12/31/2019. The option-adjusted spread is the credit spread of a bond after taking into account the issuer’s option to redeem the bonds earlier. Since an issuer would only use that option in certain circumstances, the likelihood of those circumstances is taken into account in the bond’s pricing model to allow for better comparison of credit spreads across bonds and issuers.
3 Yield-to-worst (YTW) is the worst non-default yield an investor would receive if they purchased a bond at the current price. This may differ from the yield-to-maturity (YTM) if, for example, an early redemption by the issuer resulted in a lower yield to the date of redemption than one might earn if the issuer left the bond outstanding.
4 We use the 7-year Treasury bond because its duration (approximately 6.5 years) most closely matches the duration of the Agg at the time of this writing.
5 The yield changes when interest rates and credit spreads change as well. This second order effect introduces an element of timing: When the rates and spreads change during a given year they will impact the average yield for that year. For our calculations in this letter, we assume any rate and spread changes take place all at once exactly midway through the year. Of course, this is a simplification of how rates and spreads move, but these assumptions are sufficient to show the impact on the Agg’s expected return.
© Zeo Capital Advisors
More ETF Topics >