After experiencing uncharacteristically low volatility in equity markets for a number of years, investors have felt the uptick in volatility more recently. The CBOE Volatility Index (VIX) is an indicator of the market’s expectation of the S&P 500’s near-term volatility. Typically, higher values are associated with increased levels of market volatility. Since 2012, the closing daily values of VIX have ranged from 9 to 40. In fact, the VIX has closed at a value of 35 or higher twice since 2018. That’s the same amount of times it broke 35 during the six years spanning 2012 to 2017.1 Volatility can act as a drag on performance, but selling stocks to hide from volatility can lock in losses and remove growth potential from an investor’s portfolio. So what’s an equity investor to do?
At Invesco, we believe low volatility stock strategies can help.
What’s a low volatility strategy?
As the name implies, low volatility strategies focus on stocks with a history of lower volatility than their peers. For example, the S&P 500 Low Volatility Index invests in the 100 stocks out of the S&P 500 Index that had the lowest realized volatility over the past 12 months.
We see two main benefits to this approach:
• Upside participation. Because they invest in stocks, low volatility strategies have the potential to rise along with the equity markets (though they tend not to gain as much as higher volatility stocks). For example, between April 30, 2011, and Aug. 31, 2019, the S&P 500 Low Volatility Index captured 76% of the upside of the S&P 500 Index.2
• Downside risk mitigation. At the same time, low volatility strategies have tended to lose less when equity markets fall. From April 30, 2011, to Aug. 31, 2019, the S&P 500 Low Volatility Index captured just 42% of the downside of the S&P 500 Index.2
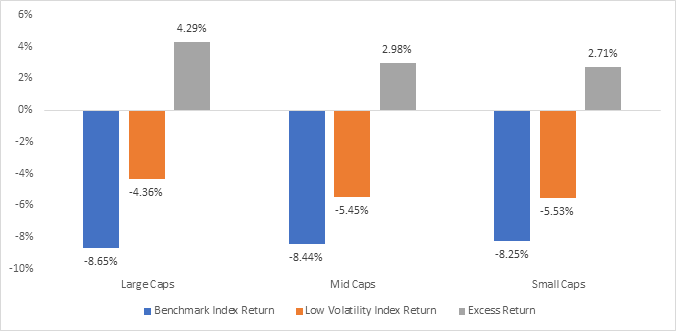
It’s this second feature that may be particularly attractive after the type of volatility we’ve seen this year. Below, we illustrate how a low volatility approach has outperformed during significant downturns in the large-cap, mid-cap, and small-cap markets. During particularly weak equity markets (as defined by a 5% drop or greater in the benchmark indexes for each cap size), the low volatility indexes have averaged excess returns of 4.29%, 2.98%, and 2.71% over the large-cap, mid-cap, and small-cap benchmarks, respectively.
Low volatility indexes have outperformed their benchmark indexes during market downturns
Source: Bloomberg, L.P. as of Aug. 31, 2019, analyzing the period between Jan. 31, 2013, and Aug. 31, 2019. Market downturns are defined as a 5% drop in the benchmark indexes, which are the S&P 500 Index (large caps), S&P MidCap 400 Index (mid caps) and S&P SmallCap 600 Index (small caps) The low volatility indexes are: S&P 500® Low Volatility Index (large caps), S&P MidCap 400 Low Volatility Index (mid caps), and S&P SmallCap 600® Low Volatility Index (small caps).
Explore more
For investors concerned with increases in volatility going forward, implementing strategies that limit potential downside could be an intriguing route to explore.
1 Source: Bloomberg, L.P. Between Jan. 1, 2012, and Aug. 31, 2019, the VIX Index closed higher than 35 on Aug. 24, 2015; Aug. 25, 2015; Feb. 5, 2018; and Dec. 24, 2018. 2 Source: Bloomberg, L.P.
Important Information
Blog header image: Raphael Biscaldi / Unsplash
The CBOE Volatility Index® (VIX®) is a key measure of market expectations of near-term volatility conveyed by S&P 500 stock index option prices. VIX is the ticker symbol for the Chicago Board Options Exchange (CBOE) Volatility Index, which shows the market’s expectation of 30-day volatility.
The S&P 500® Low Volatility Index consists of the 100 stocks from the S&P 500® Index with the lowest realized volatility over the past 12 months.
The S&P 500®Index is an unmanaged index considered representative of the US stock market.
The S&P MidCap 400® Low Volatility Index consists of 80 out of 400 medium-capitalization range companies from the S&P MidCap 400® Index with the lowest realized volatility over the past 12 months.
The S&P MidCap 400® Index is an unmanaged index considered representative of mid-sized US companies.
The S&P SmallCap 600® Low Volatility Index consists of 120 out of 600 small-capitalization range securities from the S&P SmallCap 600® Index with the lowest realized volatility over the past 12 months.
The S&P SmallCap 600® Index is a market-value weighted index that consists of 600 small-cap US stocks chosen for market size, liquidity and industry group representation.
There is no guarantee that low-volatility stocks will provide low volatility.
John Frank is the Equity ETF Strategist representing Invesco’s exchange-traded funds (ETFs). In this role, Mr. Frank works on researching, developing product-specific strategies and creating thought leadership to position and promote Invesco’s equity exchange-traded funds (ETFs).
Prior to joining Invesco, Mr. Frank was an Assistant Portfolio Manager at RS Core Capital, a multi-asset class investment firm. In this role, his primary responsibilities included research, risk management and asset allocation with a focus on the equity and hedge portfolios. Before RS Core Capital, he spent six years at J.P. Morgan Asset Management advising institutional investors on asset/liability management, asset allocation and pension regulation and worked across the defined benefit, defined contribution, endowment and foundation segments. He began his career at General Electric in a leadership development program where he was placed within the GE Energy division.
Mr. Frank earned a BSE degree in industrial & operations engineering from the University of Michigan – Ann Arbor and an MBA with Honors from the University of Chicago Booth School of Business with concentrations in analytic finance, econometrics, and statistics. He is a CFA charterholder and a member of the CFA Society of Chicago as well as the Beta Gamma Sigma Society.