"There aren’t really any actual misconceptions, just dumb people versus good, honest people." -Ted Nugent
Why another paper on energy?
Only a couple of months ago, I wrote an Absolute Return Letter called Addicted to Oil?. The paper attracted lots of comments and questions; hence my decision to re-visit the topic, where I will address most of the issues you raised.
Some of the charts I used in the May letter will be used again this month, but I have deemed that necessary to make my points. Please forgive me for that.
The four misconceptions in brief
The first three misconceptions I discuss below are tactical in nature and will most likely lead to upward pressure on oil prices in the months to come. The fourth and final misconception is structural in nature and could lead to (a lot) more misallocated capital, thus further downward pressure on productivity growth and GDP growth in the years to come.
In no particular order, they are as follows:
1. Oil prices are to a large extent driven by manufacturing activity.
Fact: That is precisely what drove oil prices between 2014 and 2018, but it is no longer the case!
2. With WTI trading at almost $60, most U.S. shale producers are now cash flow positive.
Fact: This simply isn’t true, and the evidence is overwhelming!
3. The US may produce the most oil these days, but Saudi Arabia is still the key swing producer as their reserves are far bigger; hence their production capacity is much bigger.
Fact: The Saudis want everybody to believe that to be the case, but that doesn’t make it any truer!
4. As renewable energy forms gradually replace fossil fuels, many problems will be resolved.
Fact: Whilst it is indeed correct that some of the problems to do with global warming will most likely go away, other problems will only get worse!
Misconception #1 – the key driver of oil prices
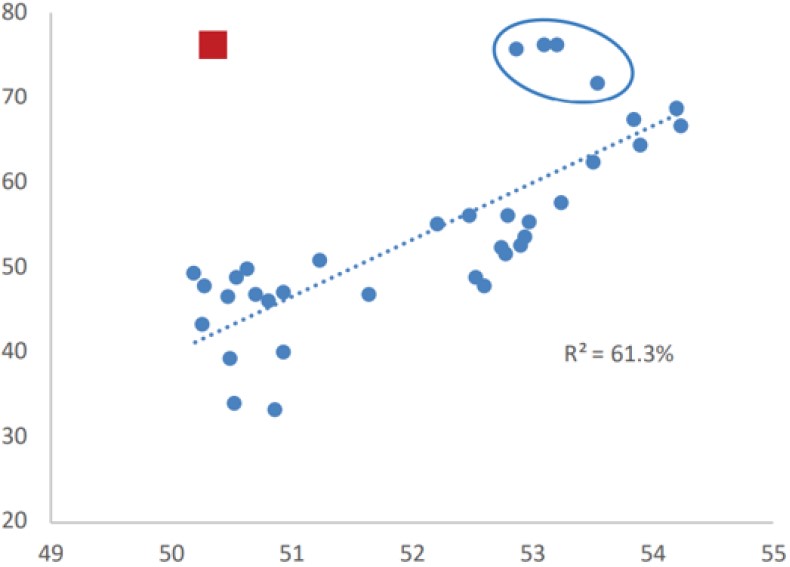
I often come across the view that industrial activity is the #1 driver of oil prices and, over time, that has indeed been the case but, these days, the link between industrial activity (as measured by the PMI index) and oil prices is oddly weak (the red square in Exhibit 1).
Exhibit 1: Brent oil price vs. global manufacturing PMI3-month average, 2014-18 Source: The Daily Shot (WSJ), FTN Financial
As you can see, oil prices have simply decoupled from global manufacturing activity more recently. Global PMI numbers have been quite weak; yet oil prices have been strong.
That implies that geopolitical risk plays a bigger role today than it did not so long ago. Although Donald Trump pulled back from attacking Iran at the very last moment only a couple of weeks ago, the political impact on oil prices has still been significant in the last few weeks. Hovering around $60 in early June, as the Iran crisis intensified, Brent rallied 10% in only a few days, and it is still in the mid-$60s.
Given the problems in Iran, Libya, Nigeria and Venezuela, combined with a rather unpredictable US president, I worry. Something could happen in the months to come which could push oil prices much higher and Trump, going into election year, may even want that to happen, given the average profile of his key financial sponsors.
Misconception #2 - shale
When shale first entered the frame almost ten years ago, no shale oil producers were cash flow positive unless WTI traded at $80 or higher. Although it did so on a fairly regular basis between 2011 and 2014, over that last ten years, it is estimated that the US shale industry has burned its way through $3 trillion of cash (Source: MacroStrategy Partnership LLP), which is a staggering amount of money.
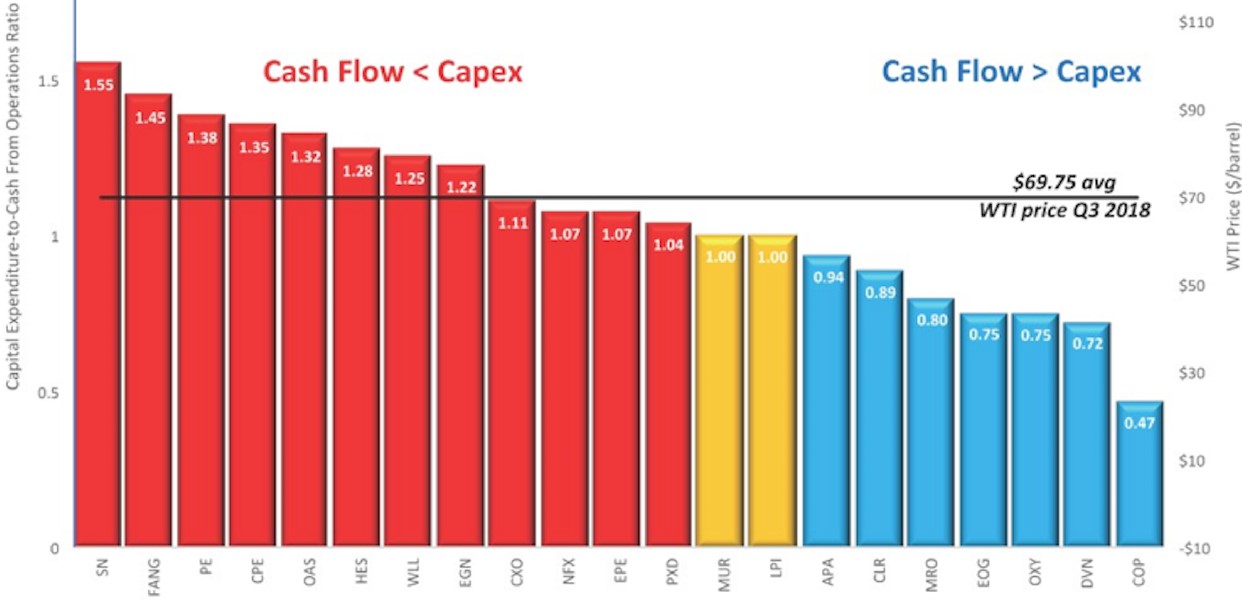
Now, in mid-2019, more and more investors seem to be of the opinion that, as long as WTI trades above $50, the average shale producer is cash flow positive, but that is simply not true. In 3Q18, the latest quarter on which I have detailed information, WTI averaged $69.75 (about $10 higher than today’s price). In that quarter, only one-third of all US shale oil producers were cash flow positive (Exhibit 2).
Exhibit 2: Capital expenditures vs. cash flow Source: Yahoo Finance & Labyrinth Consulting Services
Another misconception to do with shale has to do with the expected lifetime of a shale well. Shale investors appear to be convinced that the production profile of a shale well is not dissimilar to that of a conventional well. In other words, once the pump jacks get going, they will keep oil flowing for at least 30 years, but that is not true. Life expectancy of a typical shale well is much shorter. It appears to be less than ten years, although it is still early days. Once the penny drops on capital providers, their appetite for risk may decline.
The implications are severe, and that is particularly the case if you combine misconception #2 with what is about to come.
Misconception #3 – Saudi Arabia
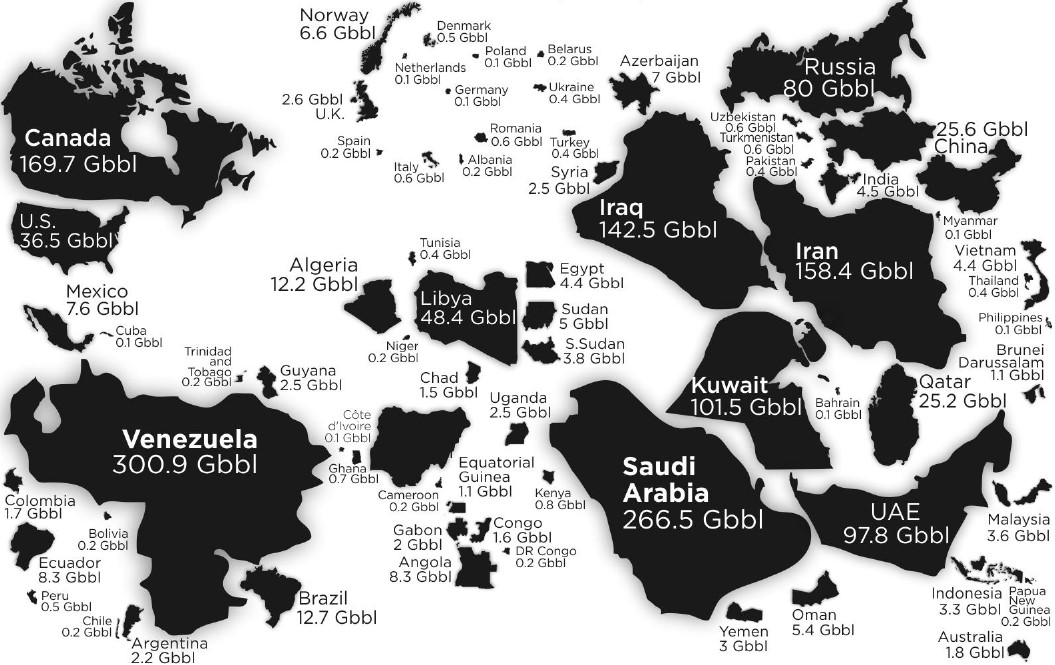
It is indeed correct that Saudi Arabia’s oil reserves are much bigger than those of the US (Exhibit 3), but that doesn’t imply that their spare production capacity is also far superior to what US producers are capable of delivering. Let me explain.
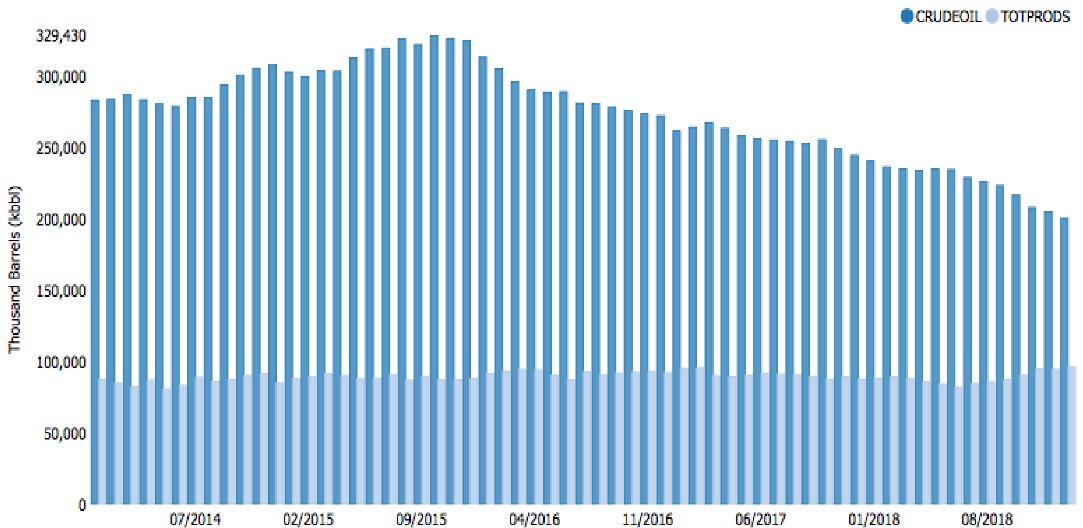
Over the last 3 years, total crude oil production in Saudi Arabia has averaged 10.3 mbpd (Source: MacroStrategy Partnership LLP). OPEC always includes inventory adjustments in its production data, and Saudi has depleted its stock piles by 130 million barrels since October 2015 (Exhibit 4).
The Saudis claim to have 2-2.5 mbpd of spare production capacity (with all of OPEC claiming spare production capacity of 4 mbpd). My question is the following: If spare production capacity is that high, why do the Saudis keep drawing on their inventories to produce 10 mbpd?
Exhibit 3: Crude oil reserves by country (billion barrels) Source: howmuch.net
There is no logic to that, unless the Saudis are extraordinarily bearish on oil. A switched-on colleague of mine suggested that it could somehow be linked to the Aramco IPO, and maybe he is right. The jury is still out on this one.
Exhibit 4: Saudi crude oil inventories, 2014-18 Source: JODIData.org
However, in recent years, whenever Saudi Arabia has produced much more than 10 mbpd, it has always happened through a draw on inventories. Why would you do that if your spare production capacity is in excess of 2 mbpd?
I believe the answer is to be found in how OPEC works. In short, everybody lies as everybody is incentivised to lie. Production cuts, when announced, are based on production capacity and not on actual production; i.e. they all want to pretend that production capacity is higher than it actually is. In other words, when an OPEC member runs into production problems, it will do whatever it can to keep the news away from the public eye.
Misconception #4 – clean energy
That clean energy is not always as environmentally friendly as generally perceived is not new news but still widely ignored. The massive Chinese hydroelectricity project, the Three Gorges Dam, changed the Earth’s rotation slightly, increasing the length of the day marginally. Likewise, wind farms are known to distort jet streams which affect weather patterns.
Governments all over the world have chosen to ignore those simple facts, though, and continue their drive towards a total elimination of fossil fuels when it comes to heating and transportation.
I won’t go into a deeper discussion as to the environmental impact of renewables vs. fossil fuels, as that is not the objective of this paper. That said, in terms of the economic impact, a very troublesome story is unfolding.
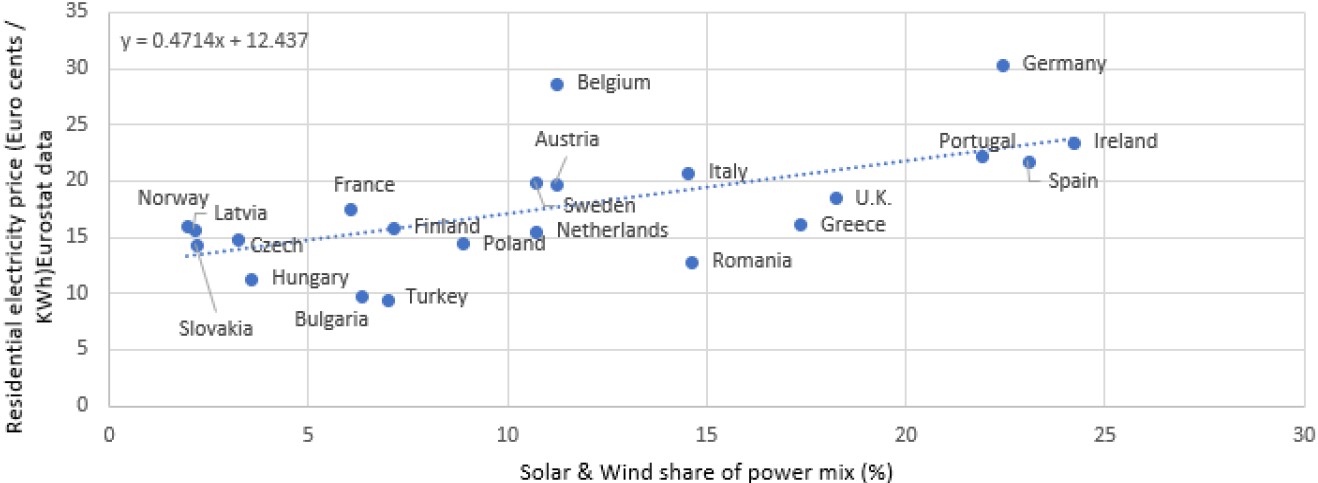
In Europe (I do not have corresponding numbers from the US), every 1% increase of wind and solar in the energy mix has raised electricity prices by more than 3% (Exhibit 5).
Exhibit 5: Residential electricity prices (cents/KWh in 2017) Source: BP World Energy Statistics
This is (in economic terms) an absurd misallocation of capital and is one of the key reasons why GDP growth continues to decelerate. According to BP World Energy Statistics, between 2000 and 2016, about $3 trillion was invested in renewables and a further $1 trillion in network upgrades to support the switch to renewables.
Furthermore, according to Bloomberg, between now and 2040, no less than $7.4 trillion will be invested in renewables worldwide. In other words, the vast investments over the last couple of decades is only the beginning.
In the highly leveraged world we all live in, we need GDP to grow robustly. Otherwise, we won’t be able to service the debt we are saddled with. Allocating that much capital to renewables will likely have precisely the opposite effect on GDP growth. It will continue to decelerate and will eventually turn negative. – at least until the cost of renewable energy comes down.
If I want to give our political leadership the benefit of doubt (which is hard in these Brexit times), I could argue that they are caught between a rock and a hard place. As we Danes like to say, it is effectively a choice between cholera and the plague. If we stay with fossil fuels, the environmental problems will almost certainly worsen. If we switch to renewables, economic growth will eventually turn negative with the environmental benefits still being circumspect to say the least.
If I put my more cynical glasses on, I could argue that (most) politicians have entirely misunderstood the concept of clean energy. To make my point, allow me to share the conclusion from a recent study – a study that emphasizes this point better than I could ever do.
A Tesla Model 3 emits 156-180 grams of CO2 per kilometre driven if you take everything into consideration, and that would include the CO2 emitted to produce the electricity. The corresponding number for a comparable diesel car is lower! (Source: Technocracy News & Trends)
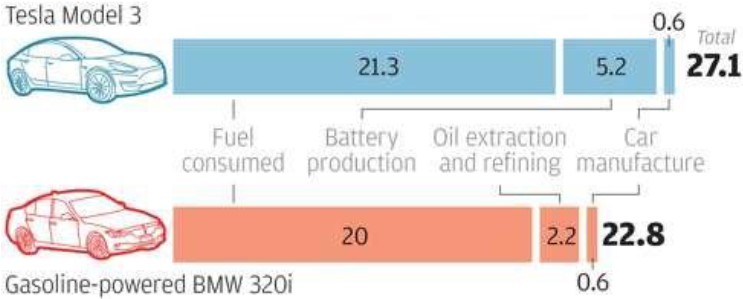
In a similar study from 2016, Bernstein reached the same conclusion (Exhibit 6). In recent years, the car tax systems in Hong Kong and Norway have both favoured electric over conventional cars, and car sales have reacted correspondingly, but it is all a fallacy, Bernstein said back in 2016. However, these days, nobody cares to listen to rational arguments any longer. Social media have turned our society in to one big kangaroo court.
Exhibit 6: Car lifetime CO2 emissions (tonnes) Source: Bernstein
Switching to electric vehicles (EVs), which is on the agenda in a rising number of countries around the world, only makes sense if the electricity used is produced cleanly and cost-effectively. In Hong Kong, for example, virtually all electricity is generated in coal fired power plants.
By classifying EVs as clean (even if they are not), and by setting emission standards for petrol and diesel cars at levels that are virtually impossible to meet, governments have effectively forced the hand of the car industry. If car manufacturers want their business to survive, even if it means many billions of pounds of misallocated capital, they have no choice.
To the best of my knowledge, there is only one solution to this problem, but more about that in my concluding remarks below.
Concluding remarks
The first three misconceptions just listed are all part of the reason why I think oil prices may soon re-visit the lofty levels of 2011-14, when both WTI and Brent traded above $100 a barrel fairly regularly. If you haven’t read the May 2019 Absolute Return Letter yet, I suggest you do so now.
Misconception #4 is far more serious in nature. In Denmark, the saying goes that you get the politicians you deserve and, in these times of rampant populism, it is truer than ever. It would quite frankly take something special for a politician to stand up and argue that the world is not yet ready for EVs. It is nevertheless true.
Two criteria must be fulfilled for electrification to make sense:
(a) The environmental damage must be lower when compared to fossil fuels.
(b) The electricity used must be cheaper to generate than the cost of fossil fuels.
As it happens, neither of those two criteria is met in many countries today, which is why we desperately need to introduce fusion energy but, before we can do that, the funding must improve, and most politicians are too busy catering for the green to even think about fusion energy.
As you may recall, I have written about fusion energy a number of times. For example, I did so in November 2018 in a letter I called Will Lithium Sink OPEC?. Fusion energy is both the cleanest and (by far) the cheapest energy form on the horizon today. Even better, it is much safer than conventional nuclear energy (fission energy).
Researchers have made great progress in the last couple of years, and the concept has now been proven in research laboratories with “energy out” exceeding “energy in”. It is now ‘simply’ an engineering job to scale it up to make it commercially viable, but that may still take at least ten years.
Access to energy that is both clean and cheap will change everything. In the interim, the global economy will limp along – literally from one crisis to the next. Ordinary people will get more and more agitated, as low GDP growth will hold back wage growth. Thus, the gap between rich and poor will only get bigger.
The rising gap between rich and poor will lead to even more fruitful times for the growing army of populists in the political arena, so expect things to get worse before they get better, which is why fusion energy cannot arrive quickly enough.