How would the market interpret a Fed rate cut?
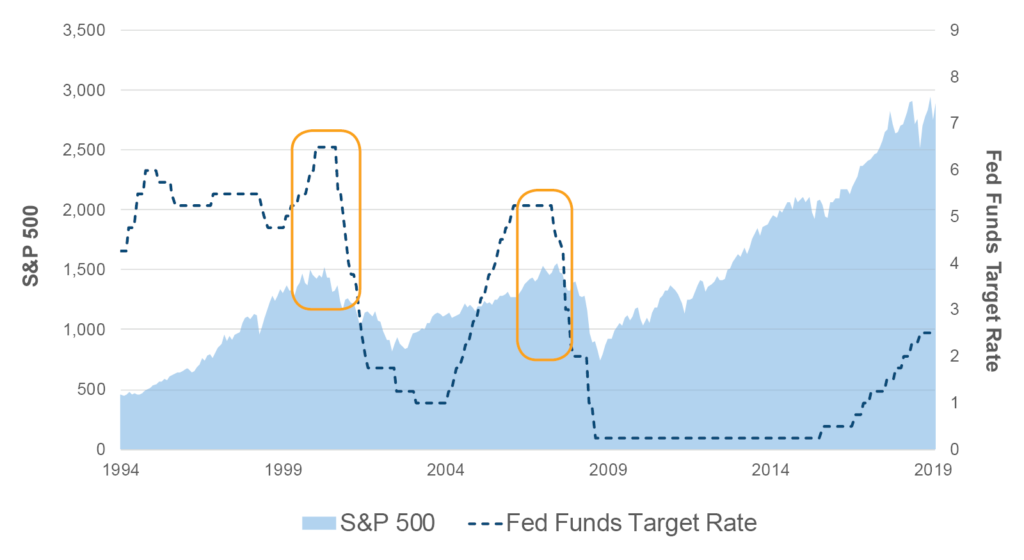
The last time the Fed embarked on a reduction of its fed funds target rate was in September 2007. The time prior to that was in January 2001. Both instances coincided with the beginning of large declines in the stock market.
Coming out of the Fed’s June meeting, it is now widely expected that the Fed will cut its rate target before the end of 2019. Investors might reasonably ask whether or not this potential rate cut should be viewed as similar to the cuts in 2001 and 2007.
In both of those cases, the Fed cut its rate in response to deteriorating financial conditions. In 2001, the equity market tech bubble was bursting; in 2007 the housing bubble was bursting and its effects were spilling over into the equity market.
In the post-crisis environment, the direction of the financial markets has hinged largely on the stance of Fed policy. Prior to the financial crisis, the release of data that pointed to a healthy economy was generally viewed as good news by investors.
In the wake of the crisis, however, such data has generally been treated as bad news, for fear of its implications for tighter Fed policy. So long as the Fed has been easing, or at the very least not tightening, investors have generally been happy, even in the face of subpar economic data.
Today, though some indicators point to a general slowing, the economy does not yet show signs of an imminent recession. If the Fed cuts its rate this year, it seems more likely to be out of a recognition that it increased the rate a little too far, a little too fast, a message the bond market has been sending loud and clear for a few months now.
Assuming that the “bad economic news = good policy news” paradigm still holds, and that the economy’s relatively good health is not merely optical, the market seems likely to respond positively to any cut(s) the Fed might make.
Unless otherwise noted, data is sourced from Bloomberg.
Recipients must make their own independent decisions regarding any strategies or securities or financial instruments mentioned herein.
The products or services described or referenced herein may not be suitable or appropriate for the recipient. Many of the products and services described or referenced herein involve significant risks, and the recipient should not make any decision or enter into any transaction unless the recipient has fully understood all such risks and has independently determined that such decisions or transactions are appropriate for the recipient.
The results shown are historical, for informational purposes only, and do not guarantee future results.
Any discussion of risks contained herein with respect to any product or service should not be considered a disclosure of all risks or a complete discussion of the risks involved.
The recipient should not construe any of the material contained herein as investment, hedging, trading, legal, regulatory, tax, accounting or other advice. The recipient should not act on any information in this document without consulting its investment, hedging, trading, legal, regulatory, tax, accounting and other advisors.
The materials in this document represent the opinion of the authors and are not representative of the views of Milliman, Inc. Milliman does not certify the information, nor does it guarantee the accuracy and completeness of such information. Use of such information is voluntary and should not be relied upon unless an independent review of its accuracy and completeness has been performed. Materials may not be reproduced without the express consent of Milliman.
Data included in this document has been sourced from providers that Milliman FRM believes to be reliable from information available publicly or with consent of the provider of the source material. To the fullest extent permitted by law, no representation or warranty, express or implied is made by Milliman FRM as to the accuracy or completeness of the source data or any other information in this document.