Weekly Market Summary
Membership required
Membership is now required to use this feature. To learn more:
View Membership BenefitsSummary: US equities rose four months in a row and ended the month of April at new all-time highs (ATH). They then fell 4 weeks in a row during May, losing more than 6%.
So far, this is not that unusual. Almost every year has a drawdown greater than 5%, and most have at least 3 of these. What was unusual was the calm and steady rise from January through April, not the fall in May.
For the remainder of 2019, the evidence leans bullish. That's not a guarantee or a sure thing. But sentiment and breadth are close to a washout (they could be more so) and the usual set up is a seasonal low in June leading to a rally into July.
Could this time be different? Yes. For one, the US is engaged in a seemingly unending escalating trade war with two major trading partners. No one knows how this will end and that uncertainty could well cause equities to plunge much further. All the market technicals, sentiment and fundamental data available cannot predict what happens next.
US equities started May at new ATHs but ended the month more than 6% lower (table from alphatrends.net). Enlarge any chart by clicking on it.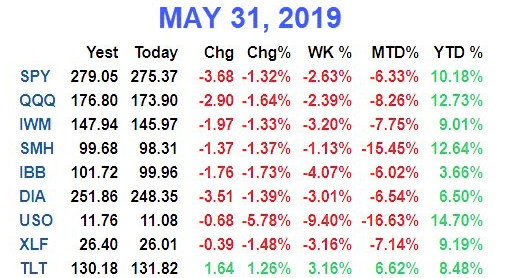
As May began, our perspective was the following:
The strong start to the year strongly suggests further gains in the months ahead.
A recession starting in 2019 is unlikely, also supporting continued equity gains.
2019 has had one of the least volatile starts to a year in the past 90 years. A drawdown of at least 5% is odds on in the weeks and months ahead.
Is that it? Maybe not. The average drawdown in the past 40 years has been 14%. SPX could drop another 9% in the next few months and 2019 would still be nothing more than a typical year. The average gain by year end has been more than 8%, so a rise from that slump would also be likely (from JPM).
Drawdowns of 5% or more during the course of the year are common; the typical year has seen at least 3 separate drawdowns of this size. Even excluding bear markets, the average bull market experiences 2.7 drawdowns of 5% or more per year. Each feels like the end of the bull market but most are not. This is the market's way of never letting investors feel comfortable, or of shaking them out of their complacency whenever they do (from Ryan Detrick).
At the end of April, the trend in US equities looked strong. The trend was up. Stocks were at ATHs. Breadth was supportive. But sentiment (by some measures) was starting to get frothy, a potential warning.
The situation a month later is now the reverse. The trend looks weak, with SPX and NDX now below their respective 200-dmas. All the gains during March and April have been given back. Breadth is weak. But sentiment is now looking overly bearish.
This pattern - of strong trend and breadth but too many bulls leading to poor trend and breath and too many bears - happens perpetually in the stock market. This is literally how every undulation up and down during the course of every bull market has unfolded. In hindsight, it all looks simple; in real time, it can be a confusing mess.
Take the nearly 50% total return during 2013-14 as an example. In hindsight, this appears to be period where stocks simple ground higher. But in real time, SPX fell 3-7% more than 10 times, about every other month. Vix spiked from 12-13 to 20 or more each time. Each fall felt like the end of the bull market, but that's not the way that period is now remembered.
None of this is to say that 2019 is going to be equivalent to 2013-14. In fact, it probably won't be. The calamity in May was primary the result of an escalating trade war, first with China and then with Mexico. This might persist, it might even broaden to other countries. If it does, expect the stock market to continue to fall by a lot more than 5%. Investors hate uncertainty and no one honestly knows where this is headed. Market technicals, sentiment and lagging fundamental data are not going to predict the future.
Whether the stock market has over reacted to the threat of the trade war is virtually impossible to say. If the trade war leads to an economic recession because firms stop investing, causing employment to fall, then the answer is no. A recession would lead to a stock market fall of at least 20% and probably a lot more.
The China tariffs themselves are estimated to reduce GDP in the US by less than 1% in 2021, equal to about $220b (from the OECD).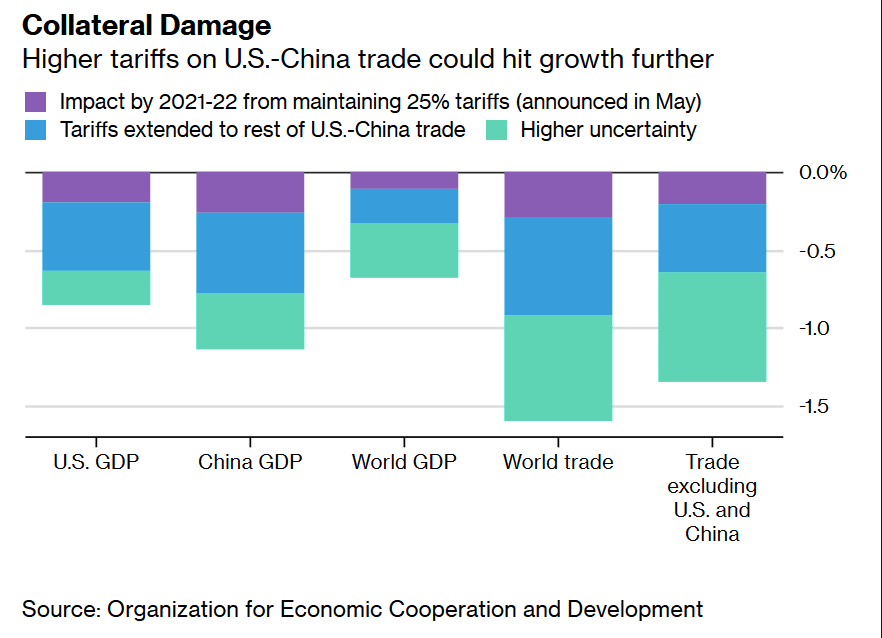
In response to this threat, US equities lost $1.95 trillion in market cap in May, a sum nearly 9 times greater. On first blush, the sell off looks overdone. That's not surprising: equity prices are a function of fundamentals and emotions and the latter is what drives short term stock market movements (from S&P).
Of course, the stock market discounts future value but even if we adjust the numbers above to account for this, the overreaction is about 5 times too great. In the US, market cap is about 1.3 times greater than GDP; adjusting for this, the overreaction is still about 3.6 times too great. The balance then is the uncertainty discount that this trade war devolves into something much worse than tit for tat tariffs.
For it's part, Goldman Sachs estimates that US firms could offset the full extent of the Chinese tariffs by raising prices by just 1%. If they do not, EPS might fall by 6% this year (from the FT). Again, estimating whether the stock market has overreacted is virtually impossible to pinpoint.
A trade war that expands to Mexico would be much more consequential. The US and Mexico engage in a half trillion dollar in annual trade. 5 million US jobs depend on this trade; to put that in perspective, total job growth in the US last year was 2.6 million (from Liz Sonders).
In the absence of a trade war, the US macro picture is fine.
On the downside, retail sales are growing just 1% yoy, which is pretty weak. Industrial production is likewise growing at just 1% yoy; worse, just 30% of industrial production groups are expanding, with a drop below 40% having historically implied the widespread weakness that typically precedes a recession. This is not good (from Tim Duy).
But the positives in the economy outweigh these negatives. Employment is the most important economic indicator and it has not been this strong in 50 years. New home sales grew 7% last month and reached a cycle high in March. Trucks, which carry 70% of US freight, increased their tonnage by nearly 8% yoy in April from Isabelnet). 
Most of these indicators roll over to weakness well ahead of a recession and even ahead of a peak in equities. It would be very unusual for the US to slide into a recession this year under these circumstances (read more here).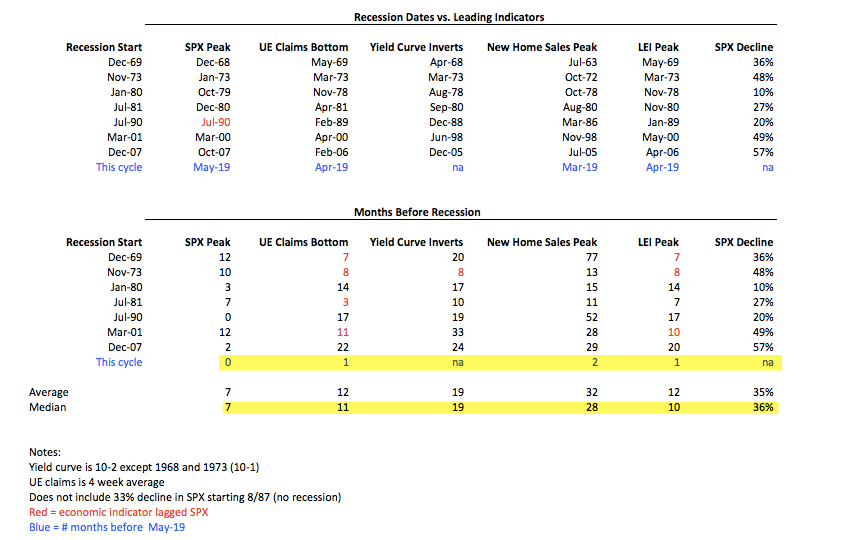
The yield curve is also not indicating an imminent recession. The point of watching out for an inverted yield curve is that future growth is expected to be weaker than today’s; hence lower yields further out in time. A textbook example was in early 2000.
Technically, the curve inverted in 2007 as well, but it was essentially just flat. Still, future growth was deemed at risk relative to the present, and a recession soon followed.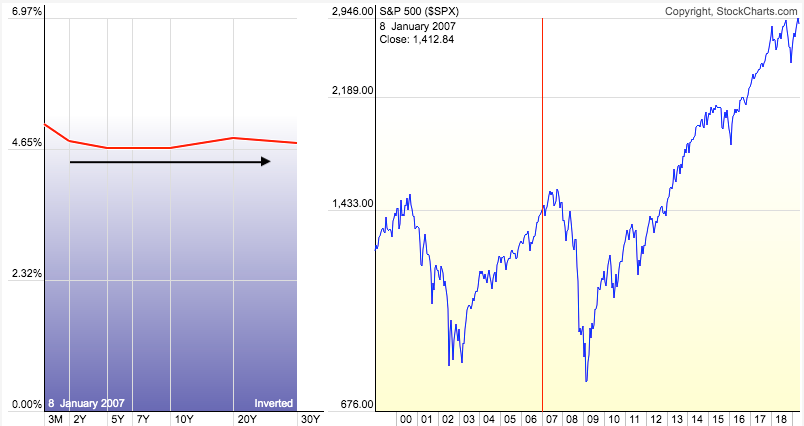
In contract to both 2000 and 2007, today’s curve clearly has a positive slope; future growth is still expected to be stronger than today’s. Only the very very short end has inverted due to the uncertainty over federal funds rates, which are expected to be cut at least once during 2019.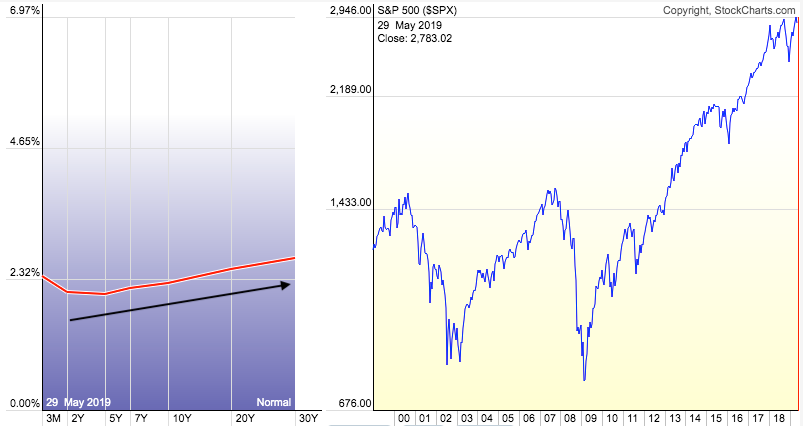
Likewise, the fall in Treasury yields in 2019 does not preordain a recession. Are there economic worries now causing rates to fall? Of course; there is always a reason when rates are falling and in real time, the reasons always feel dire. In hindsight, when we know the outcome, they seem benign. The chart below shows the causes for rates to fall in the past 10 years (upper panel); after an initial reaction, equities continued to rise (lower panel), with the main exception being late 2015 and early 2016.
After making a new ATH at the end of April, SPX fell 4 weeks in a row in May. The worst part is that SPX is now back in the 'hot mess' from October to early December (yellow shading). There's an apparent 'head and shoulders' pattern that targets a fall to 2650, which is the bottom of the hot mess. This would equal another 5% downside. A more immediate target is about 0.5% lower at 2730, the ledge formed in February and early March (blue line).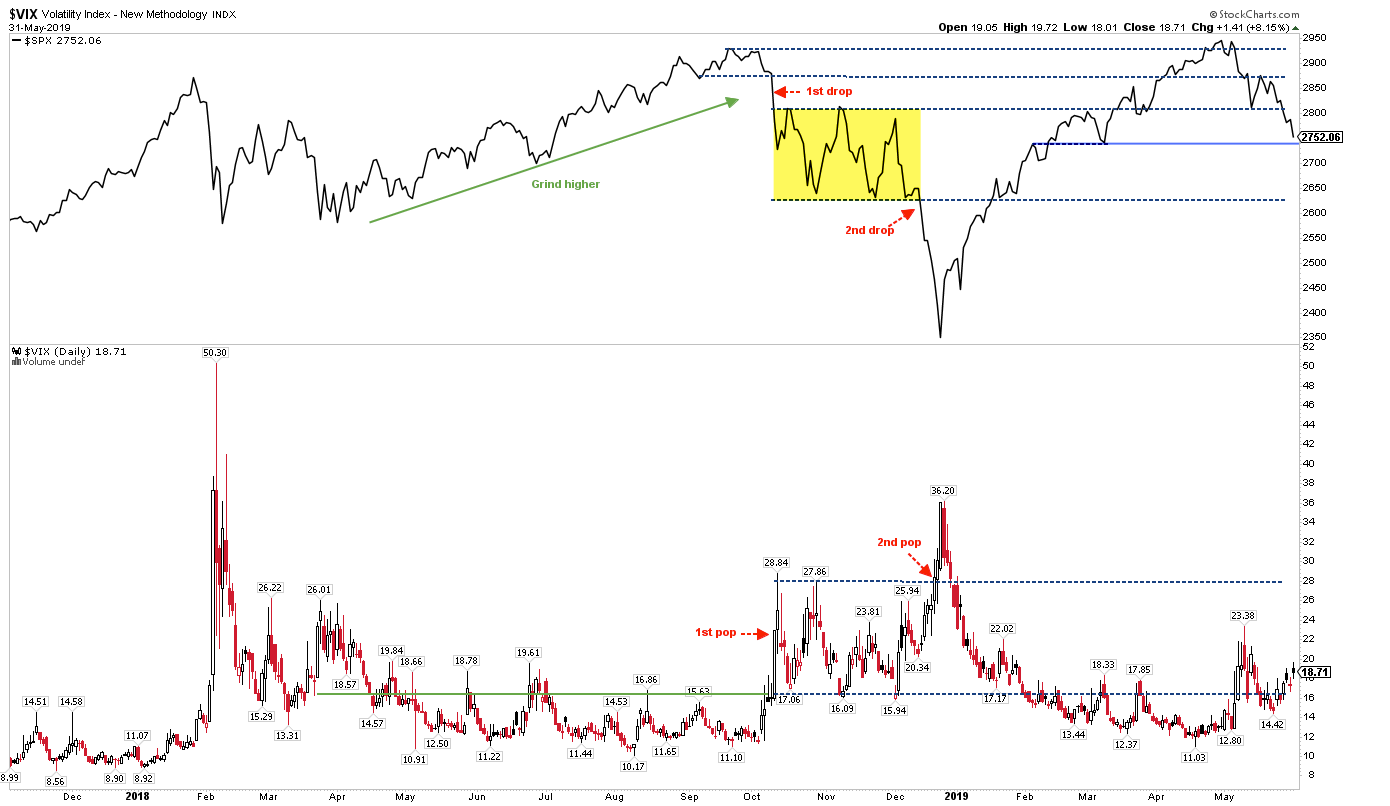
If the markets bounce this week, 2810 is 2% higher and the top of the hot mess as well as the mid-May low. That is likely to be strong resistance. The 50-d is at 2870, equal to the mid-May high, and its the next level of important resistance. A prudent investor would not be wrong to wait until at least one of these resistance levels was regained. At this point, there is not even a low to trade long against.
Breadth is weak, with just 30% of the SPX trading above their 50-dma. That has often been close to a washout low (green lines), but not always (blue lines). A drop to 20% would a truer washout.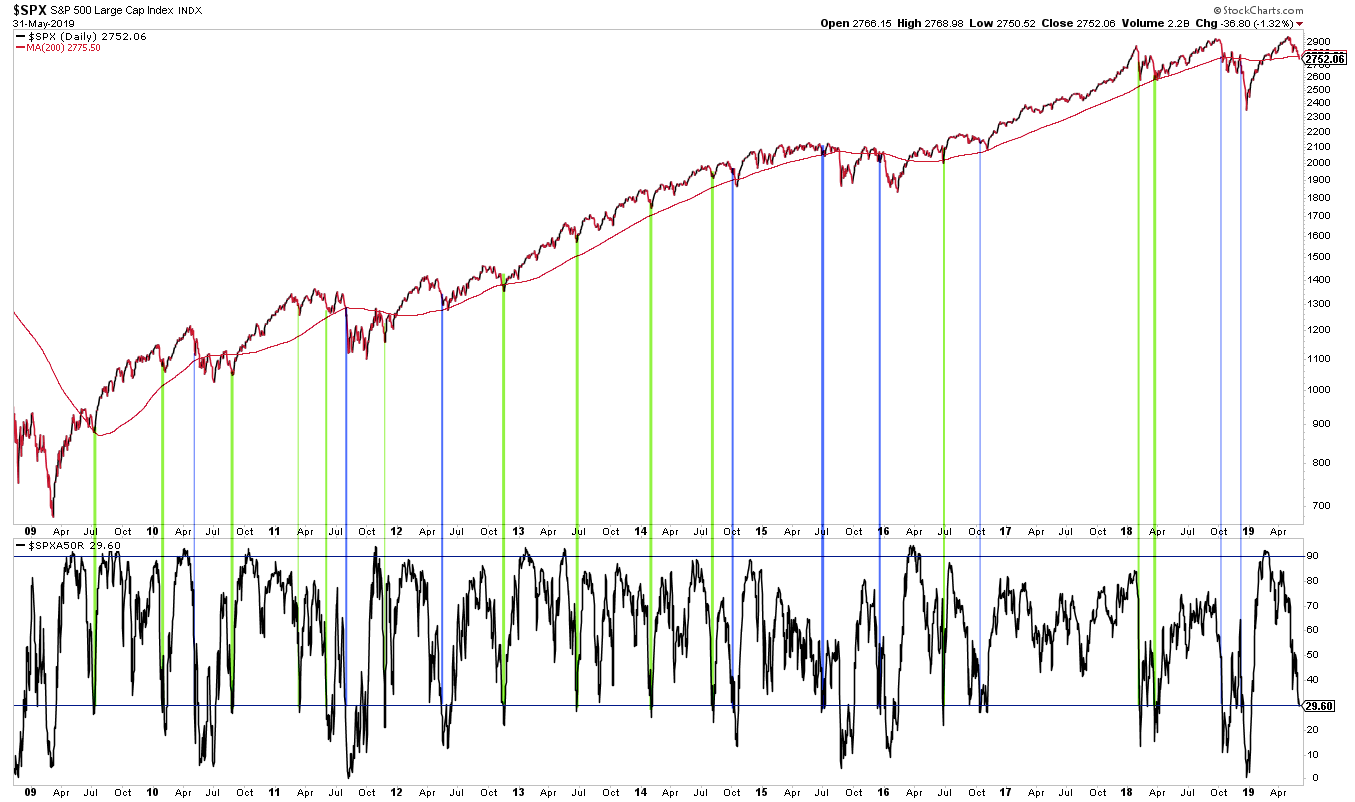
Sentiment, by at least a few measures, has turned overly bearish.
Most prominently, $22b was withdrawn from equity ETF and mutual funds last week. Outflows greater than $15b have had a very high propensity to occur near tradable lows, with SPX rising 4% or more in the subsequent weeks, except in October 2018 (red arrow). That doesn't mean equities won't again roll over after a pop, as they did in 2010, 2011, 2014, 2015 and 2018.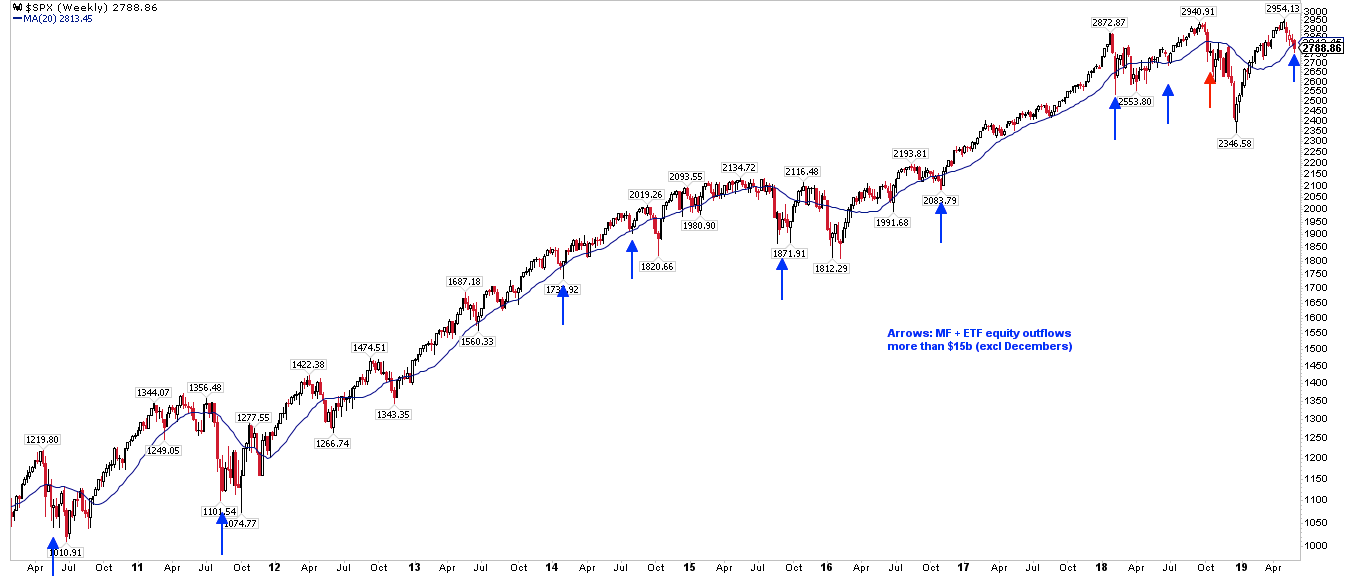
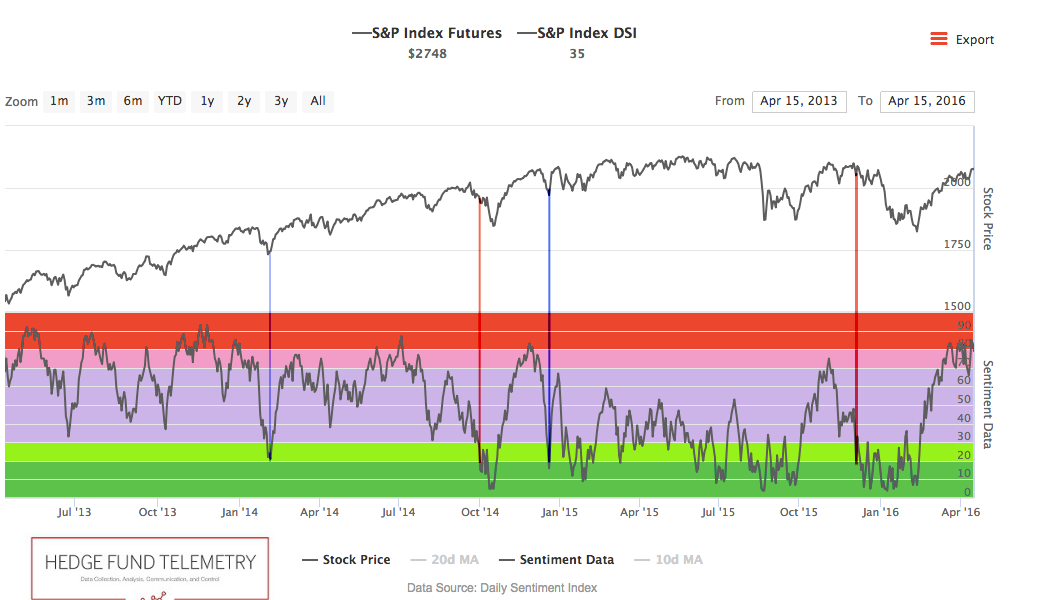
The daily sentiment index (DSI) for SPX dropped to just 12 on Friday. When sentiment has been very bullish and then falls to this level, equities have often (but not always) been near a tradable low, even if equities rolled over again later (from Thomas Thorton).
Retail investors polled by AAII are mostly bearish (40%). When this has occurred when SPX is near a 1-year high, SPX has gained an average of 3-5% over the next 6 months. The only failure was in 2015, an historical win rate of 95% (from Troy Bombardia).
The money pulled from equities has gone to the safety of treasuries and money markets, the latter of which has seen inflows of $100bn (that's very high). The DSI for US bonds is now 91 (from DB).
With the trade war driving the sell off, all the losses in the US have occurred overnight. SPX lost 6.3% in May but fell 7.5% overnight. Cash hours actually rose. That is highly unusual, the only precedents being near the lows of the two prior major bear markets (from Sentimentrader; to become a subscriber and support the Fat Pitch, click here).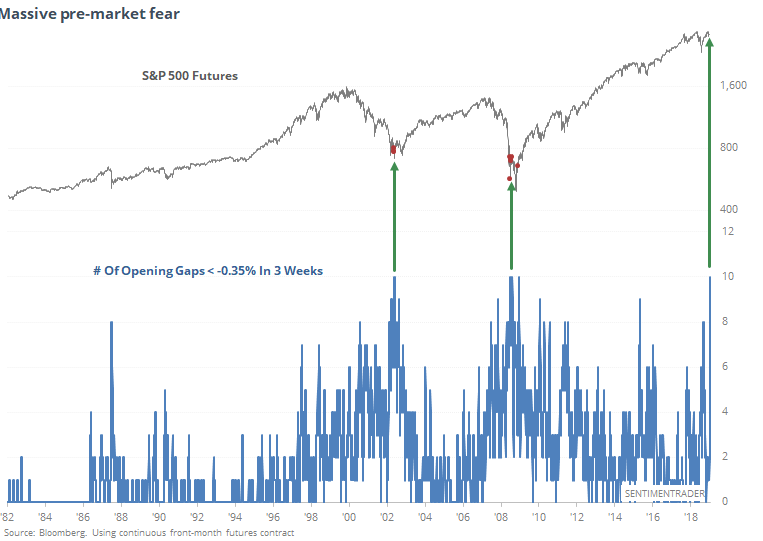
May and June are historically weak months for US equities. The usual trade set up is a low sometime in June followed by a rally into July before late summer weakness (next two charts from Jeff Hirsch).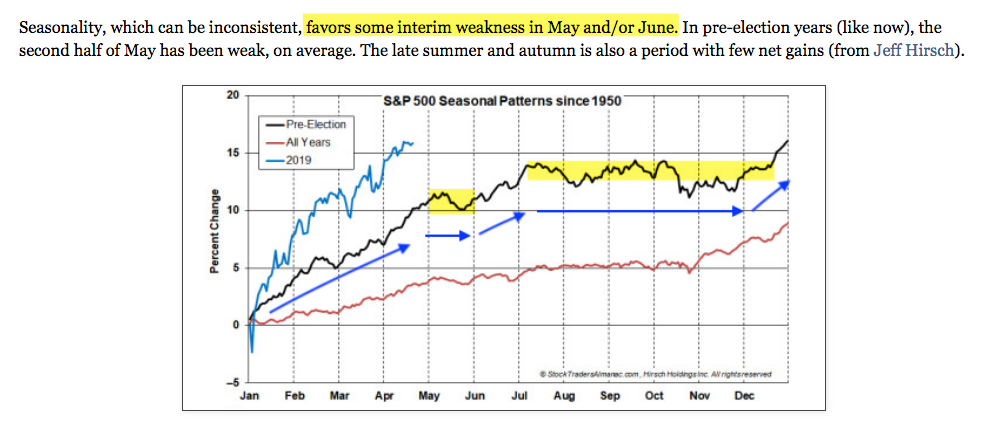
When the year has started strong (like 2019), the May-December period has risen another 7% and been positive 85% of the time. When May fell, June was higher in 7 of 9 (78%) instances, as was the May-December period.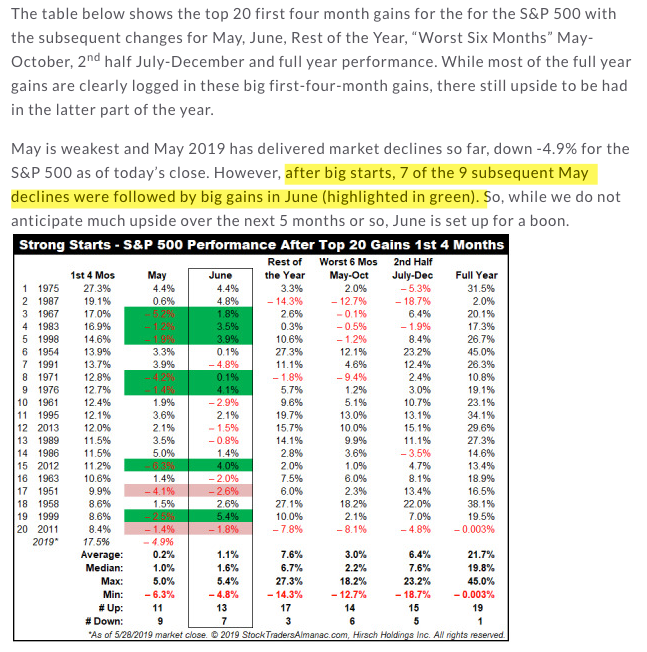
Finally, it is worth recalling a few of the positives from the strong momentum that started the year:
SPX made a new ATH in April after having not done so for at least a half year. In the past 100 years, the index has made a higher ATH at some point between 2 weeks and 6 months later in 96% of cases (n=28).
SPX rose every month to start the year. In the past 65 years, the index closed higher at the end of the year in all but one (93%) by a median of 10% (n=14).
SPX rose more than 15% in the prior 4 months. In the past 50 years, the index has closed higher between 1 and 8 months later in all but one instance (95%) and by a median of 9% after 8 months (n=21).
SPX closed below its 10-dma on only 10 days through the first 75 days of the year. In the past 65 years, the index closed the year higher in all but one (88%) by a median of 9%. SPX has not fallen into a bear market during the year since Great Depression (n=8).
To add one more, when SPX has risen 4 months in a row and then fallen the next month (like 2019), it has added sizable gains over the next several months in all cases except 3, an historical win rate of 93% (n=42). The last failure was in 1987 (from Troy Bombardia).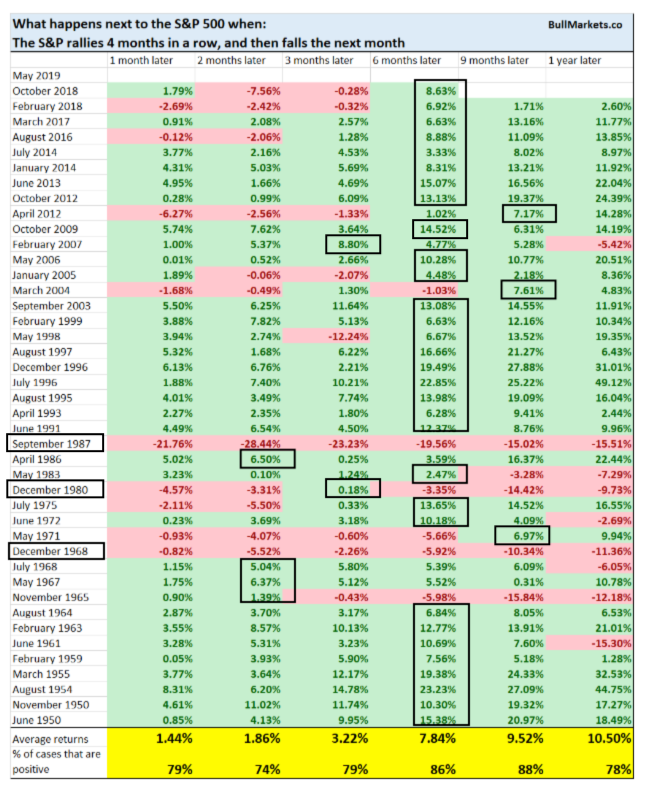
On the calendar this week is the employment report on Friday. The FOMC has its next policy meeting on June 19 (from IBD Investors).
Membership required
Membership is now required to use this feature. To learn more:
View Membership BenefitsSponsored Content
Upcoming Virtual Events View All


