Assuming we don’t fall into recession during the next four months, July 2019 will mark a new record for the longest US economic expansion since the National Bureau of Economic Research started tracking economic cycles way back in the 1850s. Throughout this expansion, holding assets other than stocks has come at a steeper cost in terms of underperformance. But while investors may be feeling frustrated by the results of their diversification strategies, I believe it’s important to examine what can happen in the years following an expansion. History tells us that this is when the benefits of diversification have been most apparent.
What did we learn from the last longest expansion?
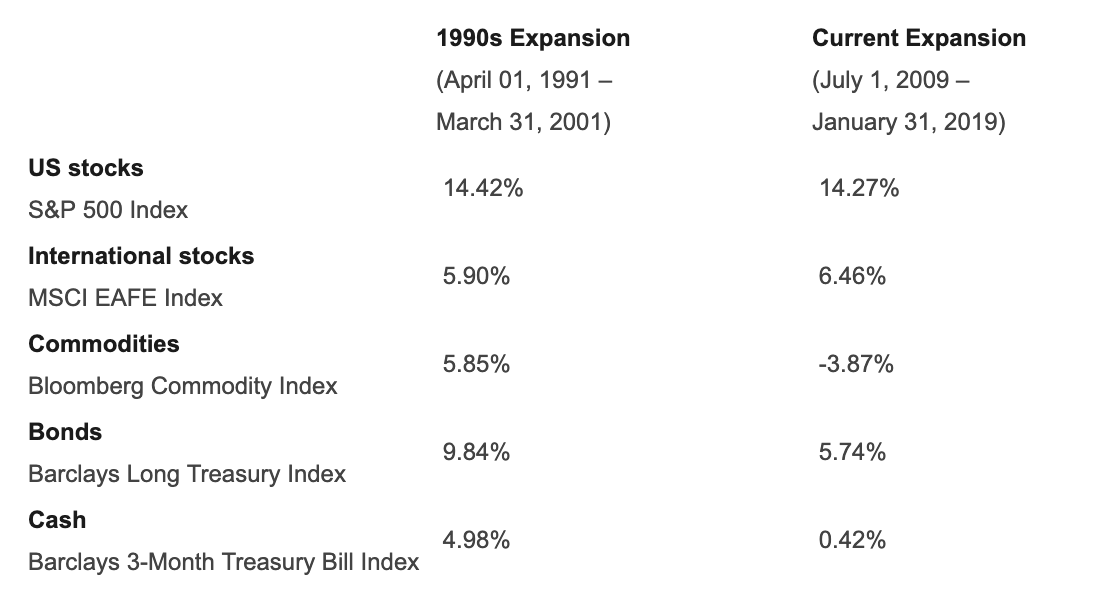
The current record for the longest expansion belongs to the 10-year period that began in April 1991 and ended March 31, 2001. When looking at this “1990s expansion” compared to today’s, we see that the penalty for owning assets outside the S&P 500 Index has been more severe this cycle as compared to the last.
The table below provides a comparison of major asset classes during both expansions. It is interesting to note that US and international stocks (the S&P 500 and MSCI EAFE indexes) have provided similar absolute and relative returns. What is even more interesting is the difference in commodity returns as the Bloomberg Commodity Index has delivered negative returns during this expansion. Bond results have also been notably lower, and the penalty for holding cash has been made more severe by the Federal Reserve’s zero interest rate policy.

Source: Datstream as of Feb. 28, 2019
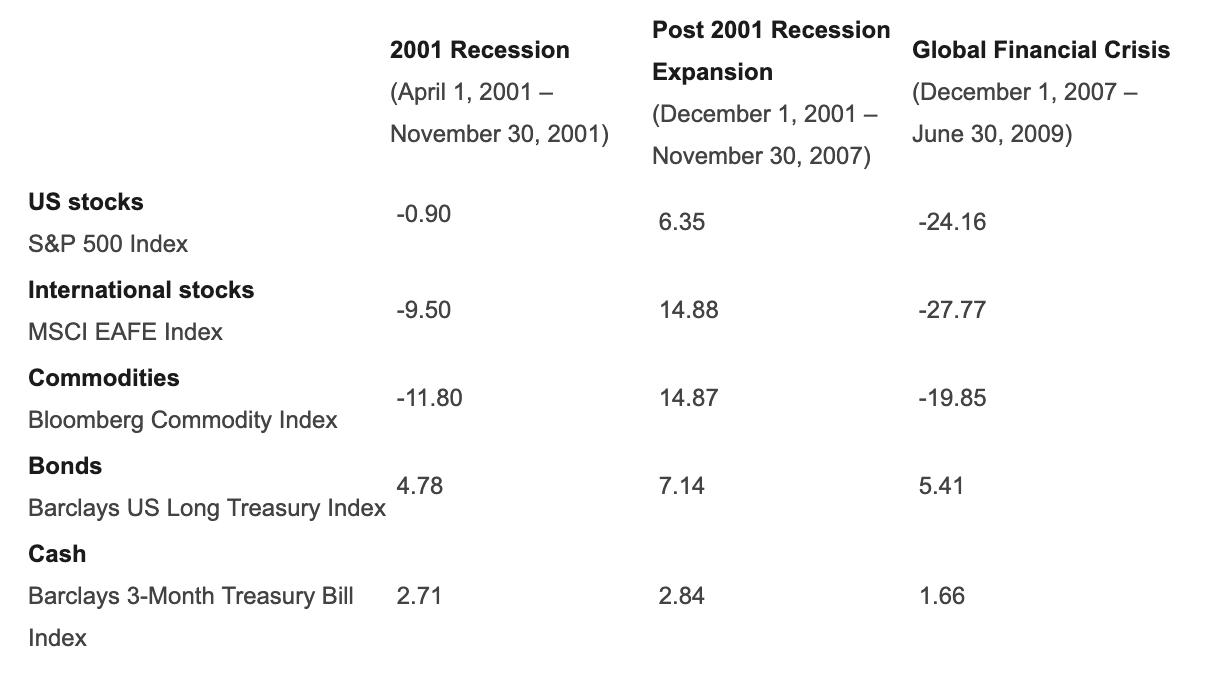
For investors feeling frustrated with diversification, the major point to emphasize is that we have been here before. I recall that by the end of the 1990s, many pundits were declaring the death of diversification, and the mantra around bonds was that they were only good for getting out of jail. But the next decade witnessed a reversal in these trends as bonds and commodities outperformed US stocks during the first decade of the 2000s, as shown below.
Source: Datstream as of Feb. 28, 2019
The long and short-term benefits of diversification
No one knows when the current expansion might end, and we are not making a forecast, but it’s important to realize that diversification isn’t important only in times of recession. The expansion that followed the 2001 recession provided leadership from asset exposures that trailed US stocks during the 1990s expansion which included international stocks and commodities. More recently, the third and fourth quarters of 2018 — while still part of a broader expansionary period — saw the S&P 500 Index fall 19% peak-to-trough, while bonds and gold provided gains that helped cushion stock’s decline.1 We’re following the economic cycles as measured by the National Bureau of Economic Research, not the market cycles, but nevertheless the story holds.
A strategy for economic diversification
Just as we’re coming up on the 10-year anniversary of the current economic expansion, we’re also coming up on the 10-year anniversary of Invesco Balanced-Risk Allocation Fund. This fund provides exposure to stocks, bonds and commodities, which could help investors prepare for multiple economic environments —expansion, recession or inflation. We believe a broad diversification strategy can help investors prepare for longer-term shifts in the economic environment, as well as short-term stock losses as we saw at the end of last year.
Be wary of any declarations that diversification is dead. Diversification has been hibernating, but it may be starting to come out of its long slumber.
1 Peak to trough dates: Sept. 20, 2018, to Dec. 24, 2018. Bonds measured by the Bloomberg Barclays US Long Treasury Index and gold measured by the GSCI Gold subindex.
Important information
Blog header image: WHYFRAME/shutterstock.com
The S&P 500® Index is an unmanaged index considered representative of the US stock market.
The MSCI EAFE Index is an unmanaged index designed to represent the performance of large and mid-cap securities across 21 developed markets, including countries in Europe, Australasia and the Far East, excluding the US and Canada.
The Bloomberg Commodity Index is a broadly diversified commodity price index.
The Bloomberg Barclays US Long Treasury Index includes all publicly issued, US Treasury securities that have a remaining maturity of 10 or more years, an investment grade rating and $250m or more in outstanding face value.
The Barclays 3-Month T-Bill Index is an unmanaged index considered representative of US Treasury bills with maturities of three months.
Diversification does not guarantee a profit or eliminate the risk of loss.
Dave Gluch
Client Portfolio Manager, Invesco Global Asset Allocation team
David Gluch has served as a Client Portfolio Manager for the Invesco Global Asset Allocation team since 2012. He works with clients across global institutional and global retail channels, and he is a frequent speaker at industry conferences discussing the topics of asset allocation, commodities and risk management.
Mr. Gluch joined the firm in 1995. From 2005 to 2012, he served as head of US Product Management, where he oversaw product positioning, strategy and servicing for the retail and institutional channels. While in this role, he co-authored Invesco’s educational and value-add program, Rethinking Risk.
Mr. Gluch received his BBA in finance from the University of Texas. He is a Chartered Financial Analyst® (CFA) charterholder.
Read more commentaries by Invesco