“Before, You Are Wise; After, You Are Wise. In Between, You Are Otherwise.” -David Zindell
Most of us are attracted to round numbers. Attentions peak around calendar years and familiar anniversaries that have meaning beyond the numbers themselves. Rarely do we celebrate someone being at a company for 28.14 years or ask about performance over the last 3,147 days, but we do celebrate 20-year reunions and the beginning of a new century. So, for a society fond of round numbers, the opportunity arrived in early March to count and reflect. Ten. In my experience ten is the number kids get most excited about when they learn how to count. For soccer fans, it’s often the number adorned by the team’s top player. It is the base number of our most cherished birthdays, anniversaries, the metric system, indo-arabic numerals, and for some, investment horizons.
It has been ten years since the worst of the Global Economic Crisis and the Great Recession pushed risk assets to the oft-discussed 666 devil’s intra-day low of the S&P 500 on March 9, 2009. During the worst of it, many serious and bright people pondered whether this would be a recession similar to the Great Depression in scope and scale, resulting in prolonged impairment of the economy and capital markets. Luckily, things didn’t get that bad. For economic context, the Great Recession saw unemployment reach 10%, the Great Depression 25%. GDP contracted more than 5% in 2007-2009 compared to falling 25% in the 1930s. Lastly, the stock market fell in excess of 85% in the 1930s, a lot more than 2007-2009.
A quick reminder of where we were:
- Bear Sterns and Lehman Brothers went bankrupt; US Agencies Fannie and Freddie went under conservatorship (so, they went bankrupt too); automakers and AIG had to be bailed out; liquidity dried up and lending was effectively frozen.
- With no liquidity, unusual things started to happen. As an example, from August through mid-December of 2008, high yield bonds sold off more than stocks.
- The S&P 500 fell more than 55% from a high reached in October 2007.
- International and emerging market stocks were down nearly 60% from the peak.
- Housing prices fell more than 30%.
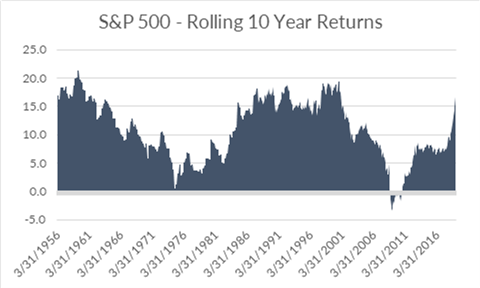
Investors solely exposed to the S&P 500 (which we do not advocate, see diversification letter here) would have looked down on their statement on March 9, 2009 to see a 10-year annualized return of negative 4.5% and a cumulative return of negative 37%. To repeat, that’s a loss of more than 1/3 of one’s money over a 10-year period. Starting on March 9, 2009, however, the next 10 years would have generated more than 17% per year, with a cumulative return of near 400%. These are not magic start dates for peaks and troughs by the way. The prior two decades were up 363% and 466%, respectively. This is where price matters. In March 1999, US stocks traded at almost 30x price/earnings. In March 2009, it was near 11x. Today, at 19x, they are right around the average of the last 30 years. And although prices were low at the time, risk-seeking was not popular in 2009. Even as things improved, many never truly got back into the market given the constant bombardment of worrying developments. Below are just a couple of the headlines that may have kept investors away over the past decade that probably should have been ignored.
-
2009 – GM filed for bankruptcy midway through the year; corporate defaults hit modern era-highs; there were 140 bank failures in the US (more than there were in 2008); inflation concerns awakened due to more than $1 trillion in government stimulus
-
2010 – BP oil spill; market flash crash; Obamacare; insider selling jumps to record in second half of the year; Greece nears bankruptcy; Arab Spring begins
-
2011 – S&P downgrades US Government Debt; US stocks fall nearly 20%; Europe goes through a sovereign debt crisis; Occupy Wall Street
-
2012 – Fiscal cliff; LIBOR probe; Hurricane Sandy; North Korea sends rockets into orbit
-
2013 – Government shutdown; taper tantrum sends yields higher and stocks lower; Boston Marathon Bombing
-
2014 – Ebola; Russia enters Ukraine; ISIS
-
2015 – Chinese stocks halve in just a few months; crude oil tumble continues; Federal Reserve raises rates for the first time since 2006
-
2016 – First two weeks are the worst ever for US stocks; Brexit; US Election
-
2017 – Mueller investigation; multiple terrorist attacks across the globe; Hurricane Harvey, Irma and Maria
-
2018 – Trade wars begin; wildfires, stocks selloff more than 10% three times; most global equities hit bear market territory (i.e. down more than 20% from peak)
Unfortunately, we do not live in a world of perfect hindsight. Even if we did there are questions whether investors would stick with a plan. Several years ago a paper titled, “Even God Would Get Fired as an Active Investor,” showed that clairvoyance was not a guarantee of success. A portfolio long the 5 best stocks and short the 5 worst stocks over a 5-year period handily outperformed the market portfolio. Within that period, however, there were times when the clairvoyant portfolio trailed the S&P 500 by more than 40%. This is why the maxim of “Time in the Market vs. Timing the Market” is so key to our day-to-day conversations with clients.

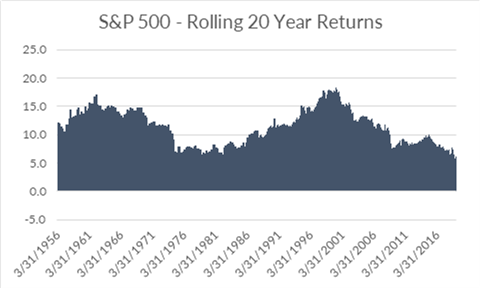
The issue with looking at a static round number of a specific 10-year period is that it doesn’t tell the whole story. Many of our clients have investment horizons much longer and much shorter than 10 years, but that round number still comes into play. The first chart shows rolling 10-year numbers for the S&P 500. As you can see, there is a fair amount of variability depending on the start date. There is also, although not often discussed, a little bit of luck. Those that started investing in the early 1980s had a much better go of it than those that started in the 1950s and at the turn of the century. The longer one’s investment horizon, however, the less that comes into play. The last 20 years provide a very good example. Despite there being both a massive tech bubble and a Great Recession in the beginning and middle of this period, the 20-year return from March 1999 to March 2019 is roughly 6% per year. That is not as exciting as what equities have provided investors over longer periods or other 20-year periods, but still much more than one would have earned sitting in cash. It is not exactly data mining either. Even if one bought stocks at the peak of the market in October 2007, and held on through the storm, they would have finished well into positive territory. To summarize, markets often ignore the headlines. Theoretical hindsight may be 20/20, but investor action, even with clairvoyance, is normally not. The longer one’s investment horizon, the less relevant any random 5- or 10-year period become.
Markets – The Grinch Returns a few Presents
Source: Morningstar, Bloomberg
We wrote a note to clients in late December titled “The Market Grinch,” highlighting volatility and the prevailing geopolitical headlines of the day. It seems that (at least in Q1) the Grinch’s heart grew a couple sizes larger, returning a portion of the loss experienced in the fourth quarter. Trade rhetoric has since softened, Brexit delayed, and the Mueller report finalized. Central Banks that were tightening the belt untightened, while those still yet to tighten delayed or started to ease. In all, risk-taking was again rewarded.
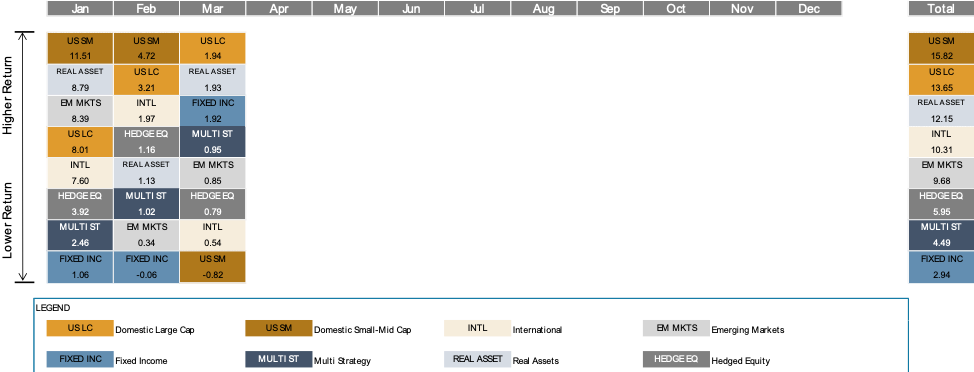
US large cap stocks rose 13.7% in Q1 to finish the best quarter of performance since 2009. Some of the same growth stocks that sold off the most in Q4 are now back in the lead. Small-mid cap stocks (Russell 2500) rose nearly 16%, after plunging 18.5% in Q4. Foreign markets topped 10%, with help from Europe offsetting relative weakness in Japan and India. Chinese stocks staged a robust rebound in Q1, rising between 20%-35% across different exchanges.
In fixed income, the old maxim of “Don’t Fight the Fed” may need to be reworded as “Fed, Don’t Fight the Market.” The biggest news for the quarter was the FOMC’s unexpected reversal regarding Quantitative Tightening and interest rate guidelines. In short, there are no expected hikes this year (the market is actually pricing in one cut in 2019). This supported additional declines in bond yields with the 10-year Treasury falling from 2.7% to 2.5%, and AAA 10-year munis falling from 2.3% to 1.9%. This, alongside spread-narrowing in corporate bonds, helped the Barclays Aggregate Bond Index finish the quarter nearly 3% higher. We also had a very temporary yield curve inversion during the quarter. We will post a note discussing this in more detail in the coming weeks.
Real assets were not left behind in Q1, with Global Infrastructure, MLPs and REITs topping 10% for the quarter. Commodities rose more than 6% thanks to a 25% rebound in crude oil, offsetting weakness in other areas. Hedged equity funds (represented by the HFRX Equity Hedge Index) held their own in Q1, but a bias toward shorting growth stocks in favor of value continued to be a headwind. Broader diversified alternative strategies performed in line with core bonds in Q1.
Final Thoughts
As I thought about our predilection to round numbers and how we learn to count, I came back to an old Mother Goose standby: This Little Piggy. For what could only be deemed geeky fun, I looked back to 2009 in that context and found a curious but fun Freakonomics-type relationship, so if you will indulge me:
· 2009: This little piggy went to market: And boy did it. After one of the worst sell-offs in recent memory, almost every market was welcoming.
· 2010: This little piggy stayed home: After a strong rebound in 2009 where international stocks topped domestic, US equity markets took over the lead in 2010.
· 2011: This little piggy had roast beef: 2011 was not a good year for most risk assets (global stocks fell more than 7%). One of the few exceptions was beef cattle, which rose 14%. Mother Goose does it again.
· 2012: This little piggy had none: Maybe this relates to dispersion. In 2012, almost all equity markets rose by about the same amount. No dispersion for the diversified. Or it could have been that lean hog futures were almost flat for the year.
· 2013: This little piggy cried wee, wee, wee all the way home: Well, this was the strongest one-year during the entire period. US large cap equities rose more than 30%, topping the 2009 rebound.
Bronfman E.L. Rothschild, LP is a registered investment advisor (dba Bronfman Rothschild and Bronfman Rothschild Plan Consulting). Securities, when offered, are offered through an affiliate, Bronfman E.L. Rothschild Capital, LLC (dba BELR Capital, LLC), member FINRA/SIPC.
This information should not be construed as a recommendation, offer to sell, or solicitation of an offer to buy a particular security or investment strategy. The commentary provided is for informational purposes only and should not be relied upon for accounting, legal, or tax advice. While the information is deemed reliable, Bronfman Rothschild cannot guarantee its accuracy, completeness, or suitability for any purpose, and makes no warranties with regard to the results to be obtained from its use. Past performance does not guarantee future results.
© 2019 Bronfman Rothschild
Read more commentaries by Bronfman E.L. Rothschild