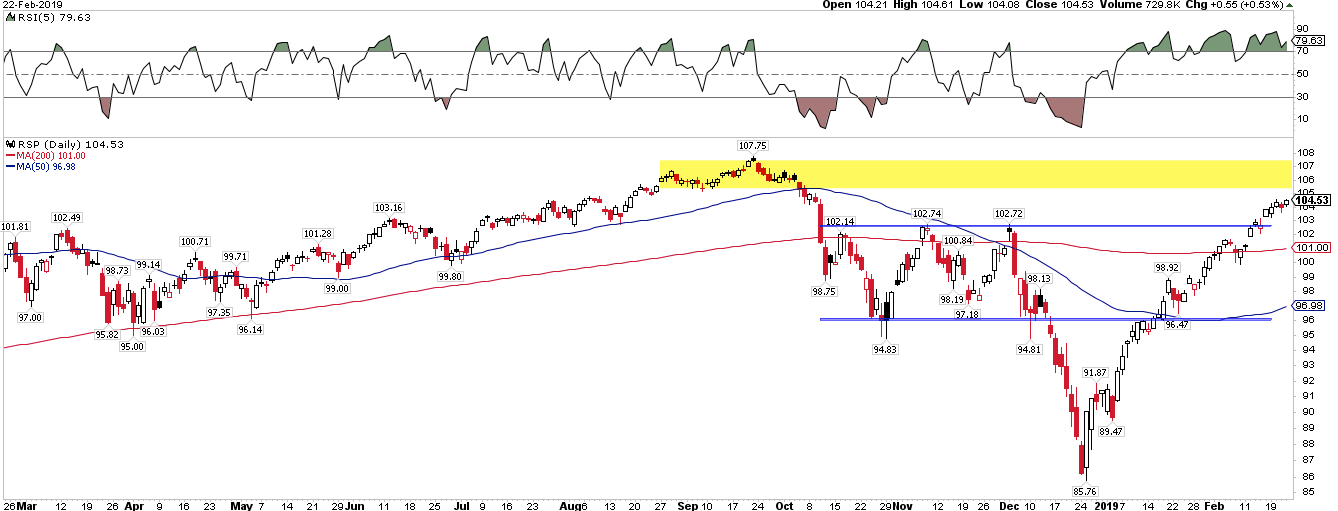
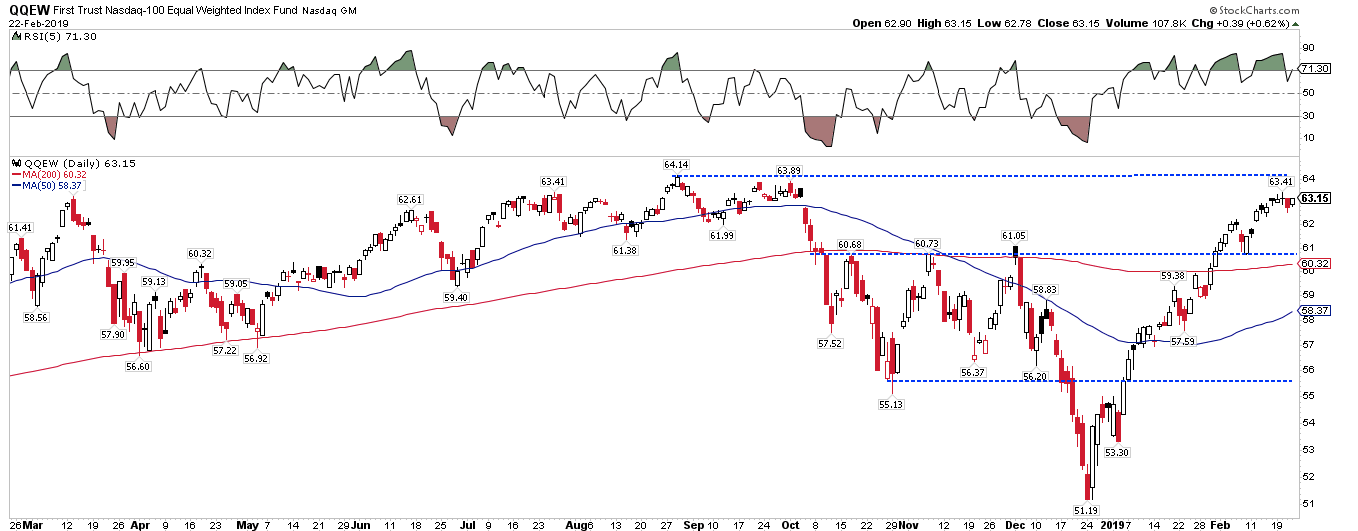
The same is true for the equal-weight NDX, which is less than 1.5% from its ATH. Put another way, FAANG stocks are holding the indices back; given their heavy weighting, if they kick into gear, the traditional market capitalization-based indices will likewise move back to their ATHs.
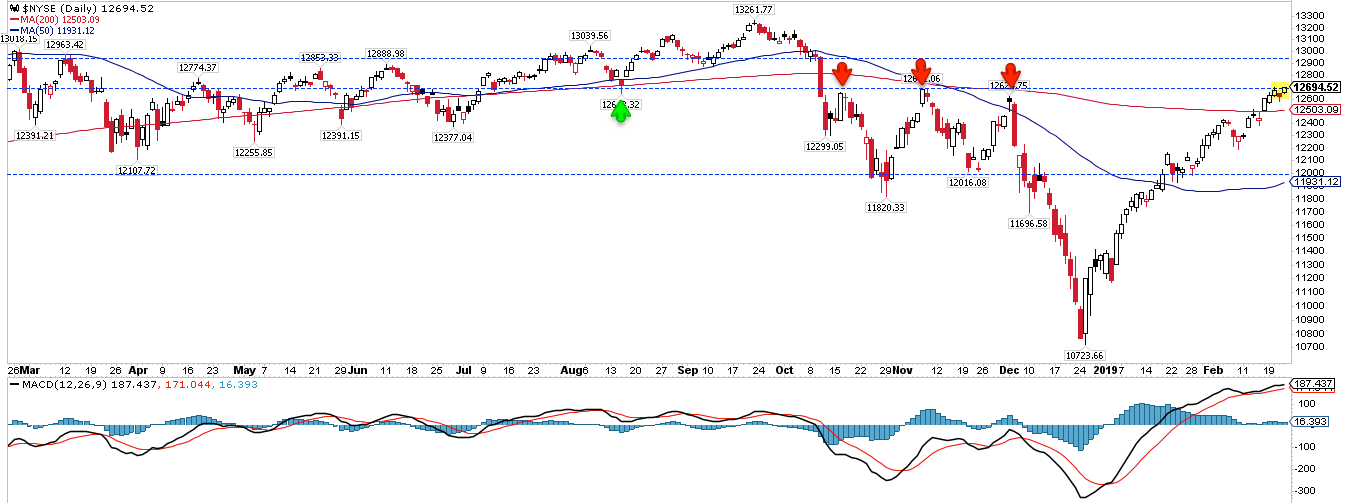
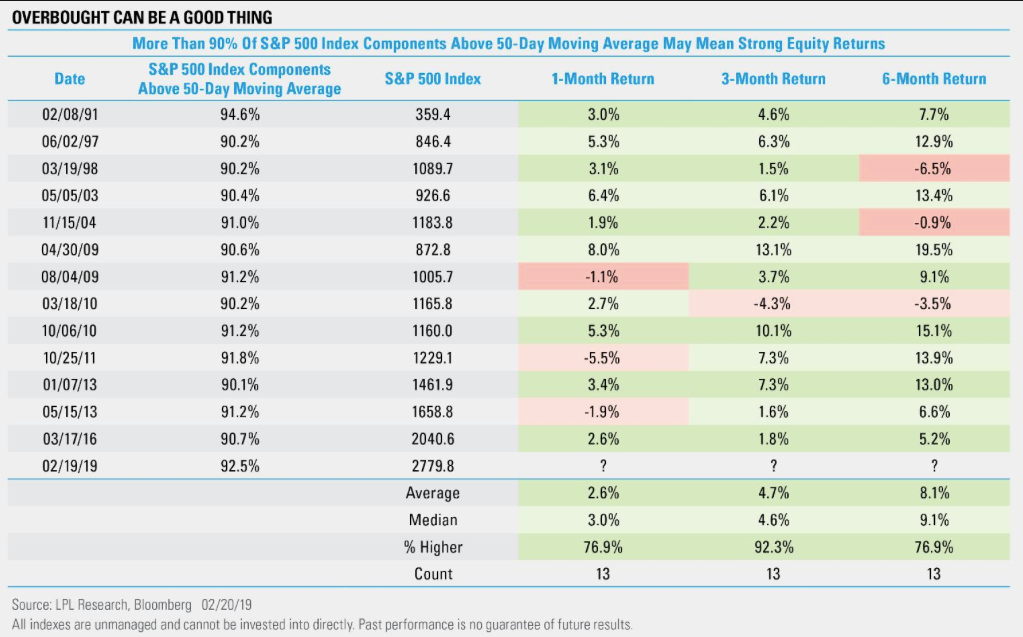
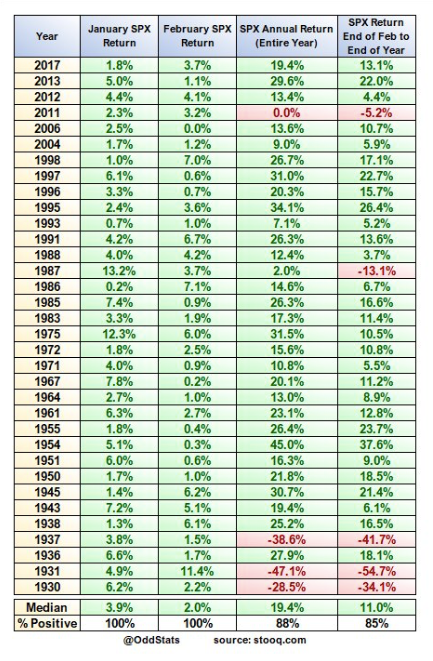
That NYSE and the equal-weight indices are leading says that breadth has been strong. This is a net positive. More than 90% of the SPX is now back above their respective 50-dma. In the past 30 years, SPX has closed the month higher within the next 3 months every time. If returns 3 months from now meet the historical average (4.7%), SPX will essentially be back at its September ATH (the next two charts are from Ryan Detrick).
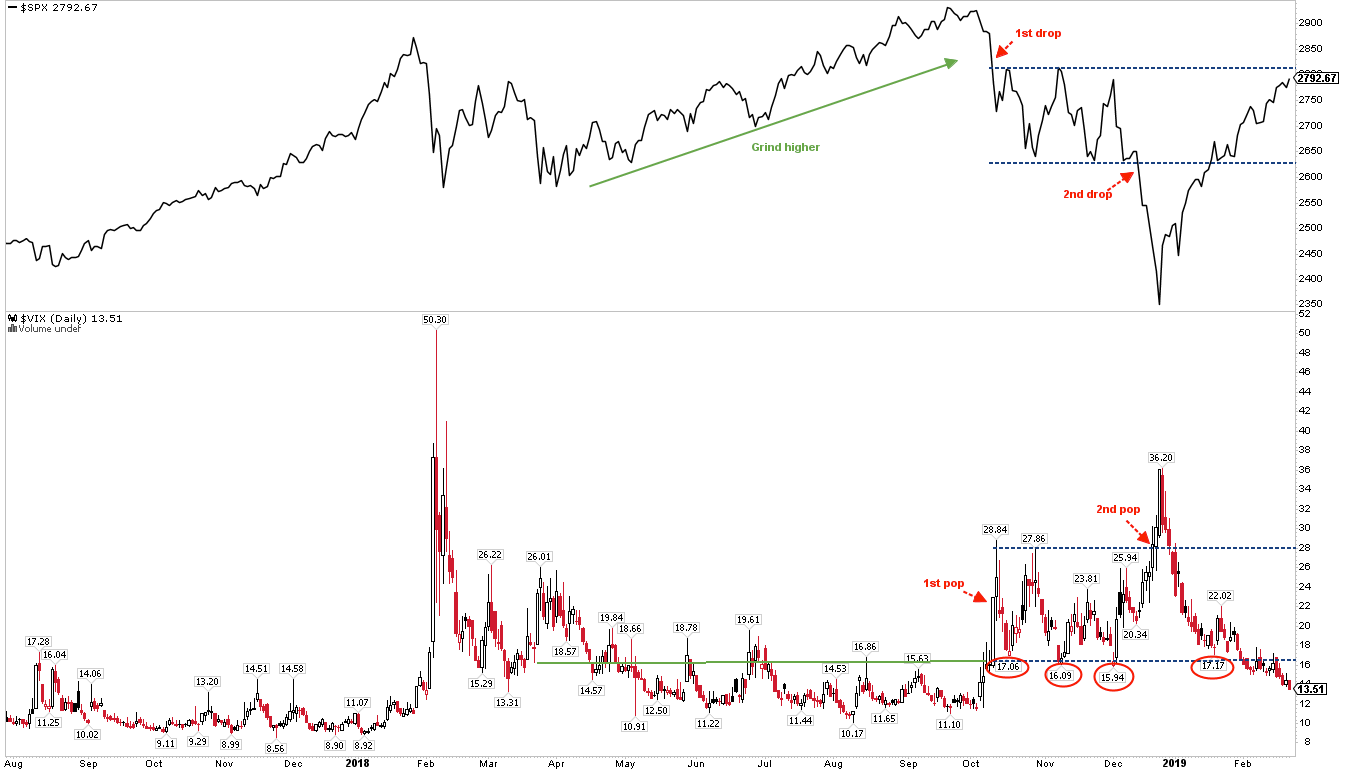
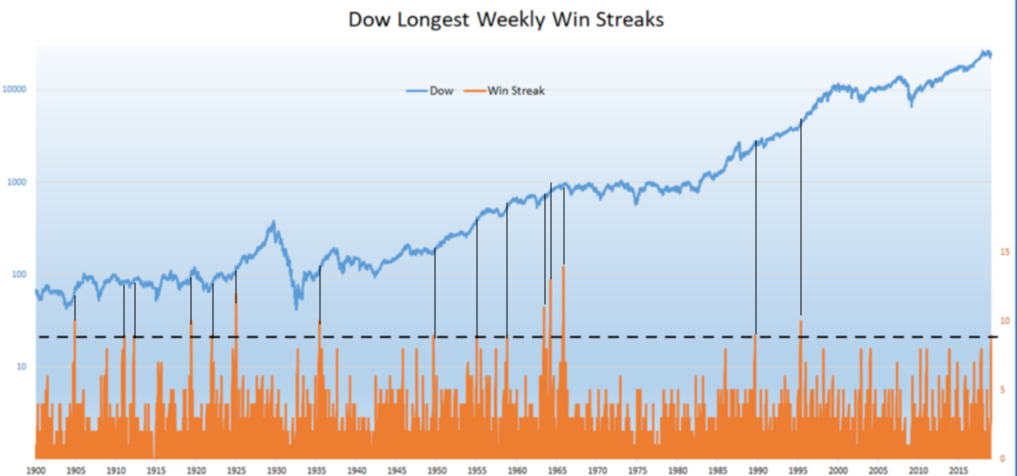
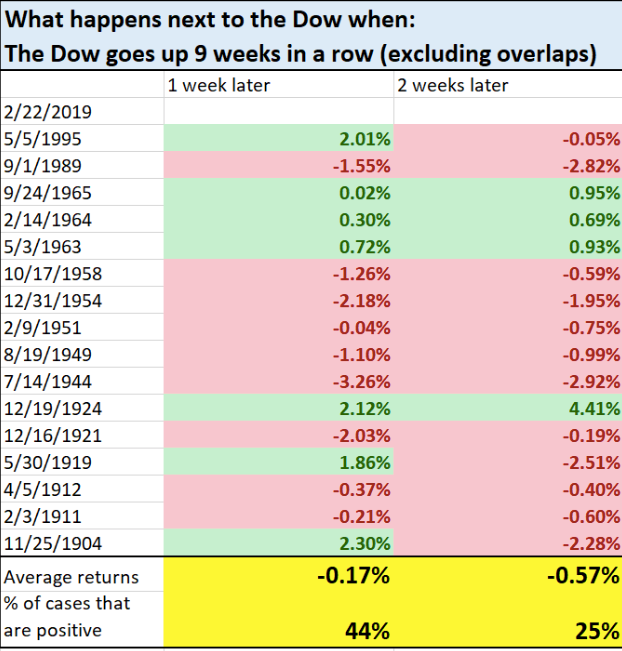
That the DJIA, NDX and RUT have all closed higher the past 9 weeks in a row is also an intermediate-term positive. For the DJIA, this has happened at least 15 times in the past 120 years, and none marked a major top. The instance from 1965 looks close but the reality is the DJIA closed higher 14 weeks in a row and then rose another 4% after that.
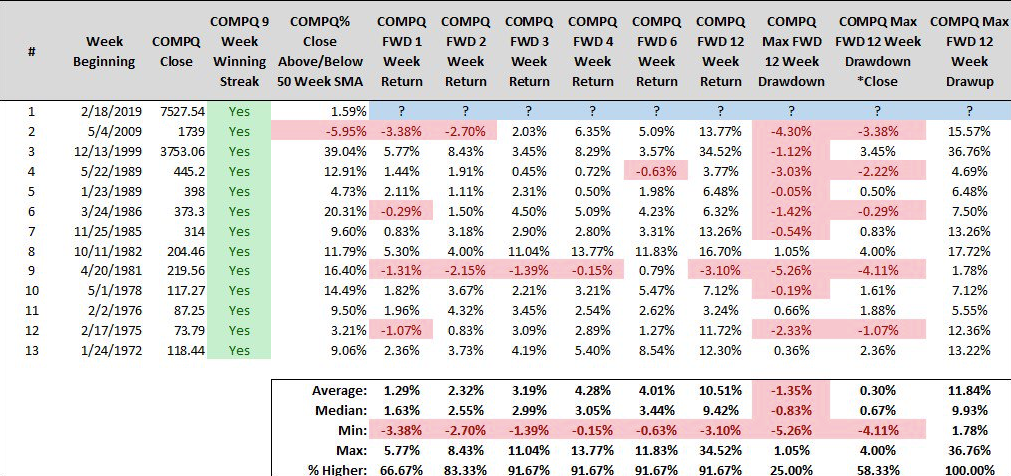
Likewise, when COMPQ has gained 9 weeks in a row, it has continued higher: all instances closed higher after either 6 or 12 weeks. Risk/reward was extremely biased positive during the next 3 months. If returns 3 months from now meet the historical average (10.5%), COMPQ will be well above its September ATH (7.5% above Friday's close; table from Steve Deppe).
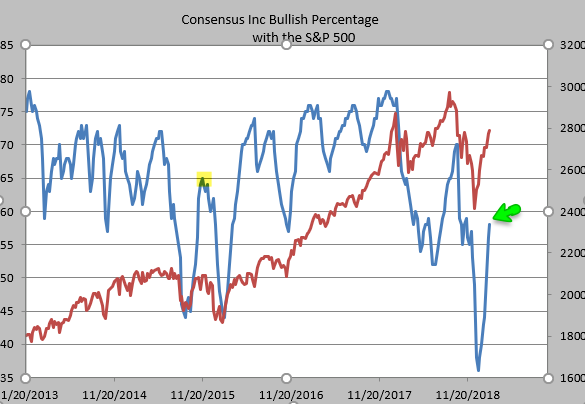
Despite a strong 9-week rally, sentiment amongst analysts has not rebounded very strongly, yet (blue line). Bulls climbed back to just 58% this week; rallies in the past 8 years have not fizzled out until bulls were at least 65% (like late-2015 before the second swoon in early 2016). It would be unusual for there to be much downside until sentiment improves further (from Helene Meisler).
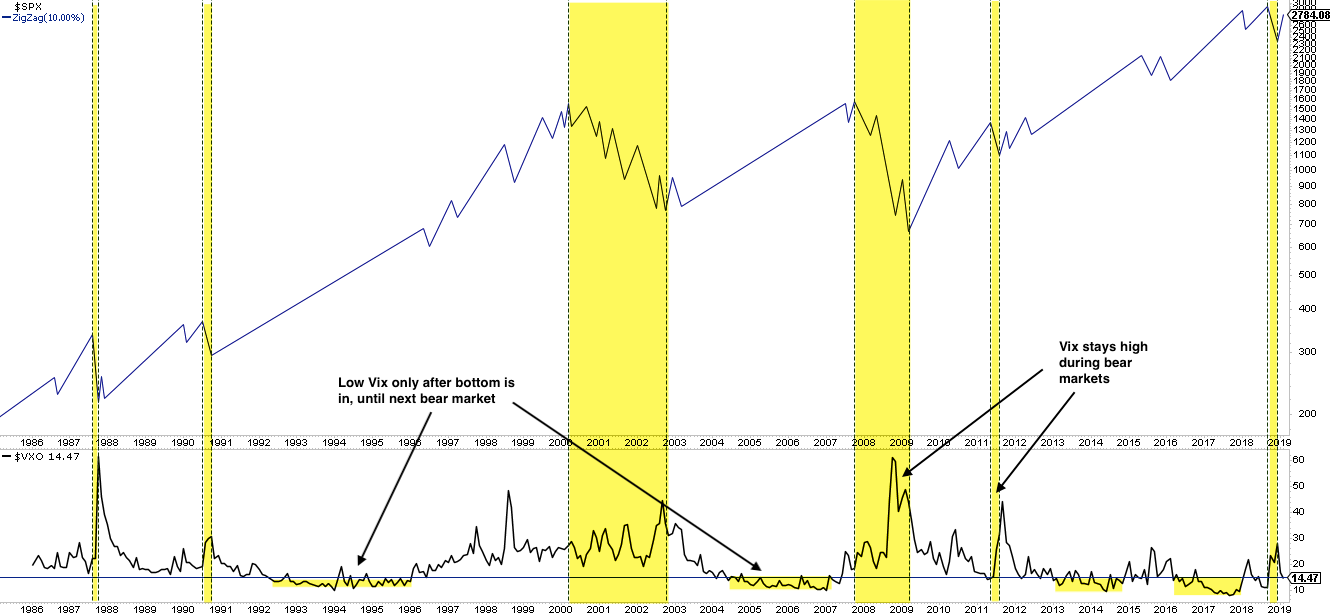
It's true that sentiment among newsletter writers (Investors Intelligence) has rebounded more strongly (to 31% net bulls) but this has not been a very useful indicator on its own: SPX has topped, or chopped sideways or just continued higher in the past (yellow shading in the first chart). A rise to 40% net bulls, on the other hand, would be a notable extreme (second chart; from VixSquared).
As stated at the top of this post, it would be very surprising if SPX did not encounter some resistance near 2810. Even strong rallies like this one usually consolidate and retrace gains before moving higher. Two bits of evidence support that conclusion.
First, 6 of the last 8 times that Investors Intelligence net bulls exceeded 31%, SPX was lower 2 weeks later (75% loss rate; data since 1981, from Sentimentrader; to become a subscriber and support the Fat Pitch, click here).
Second, while the 9-week win streak in DJIA is a longer term positive, it has historically been most often followed by near-term weakness: the index was lower 2 weeks later 75% of the time, although the losses were minor (table from Troy Bombardia).
The case from 1989 is worth highlighting. DJIA rose 9 weeks in a row and then went into a 10% trading range lasting the next 8 months. It eventually broke out of this range and made a new ATH another 8% higher. The lesson: a set up for a longer term continuation higher can sometimes take a frustrating long time to unfold.
Looking ahead for the year, the fundamental picture for US equities is less positive.
In the corporate results released for the fourth quarter, profit margins fell by the most since the "profit recession" in 2015.
Expectations for 10% earnings growth in 2019 have already been revised down to 5% but this still looks too optimistic: if margins in 2019 remain at the same level as in 4Q18, then earnings growth will be 0%.
Valuations are not cheap, but the excesses from early 2018 have been worked off: if investors once again become ebullient, there is room for valuations to expand. However, with earnings growth likely to negligible, the key for share price appreciation in 2019 is likely to hinge entirely on valuations expanding.
A new post on this is here.
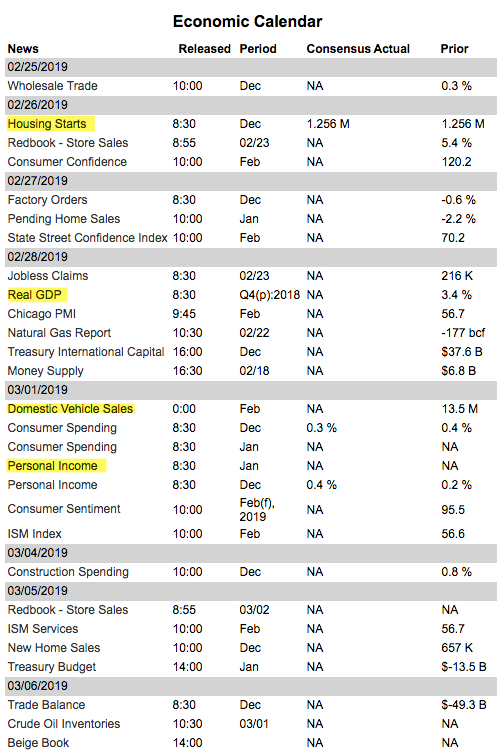
On the calendar this week: housing starts on Tuesday, GDP on Thursday and PCE on Friday. Due to the government shutdown, delayed data will be released over the coming weeks (from IBD Investors; for a trial subscription, please use this link).
© The Fat Pitch
Read more commentaries by The Fat Pitch