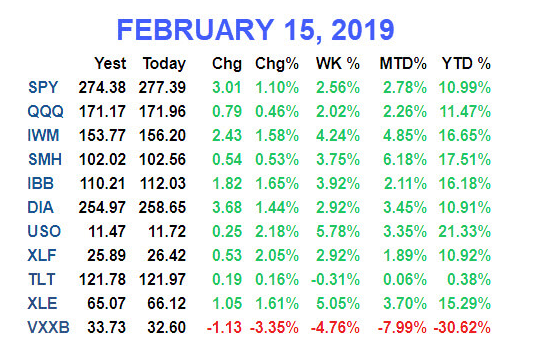
Summary: SPX has now gained 19% since Christmas Eve, while the Nasdaq is up 20% and RUT is up 23%. NDX, RUT and DJIA have all risen 8 weeks in a row.
SPX is now back to within 1% of the top of its trading range from October to early December. It would be very surprising if SPX did not encounter some resistance as it nears 2790-2810. That is made more likely by the fact that consecutive weeks of gains, while bullish longer term, have most often been followed by a period of consolidation and retracement.
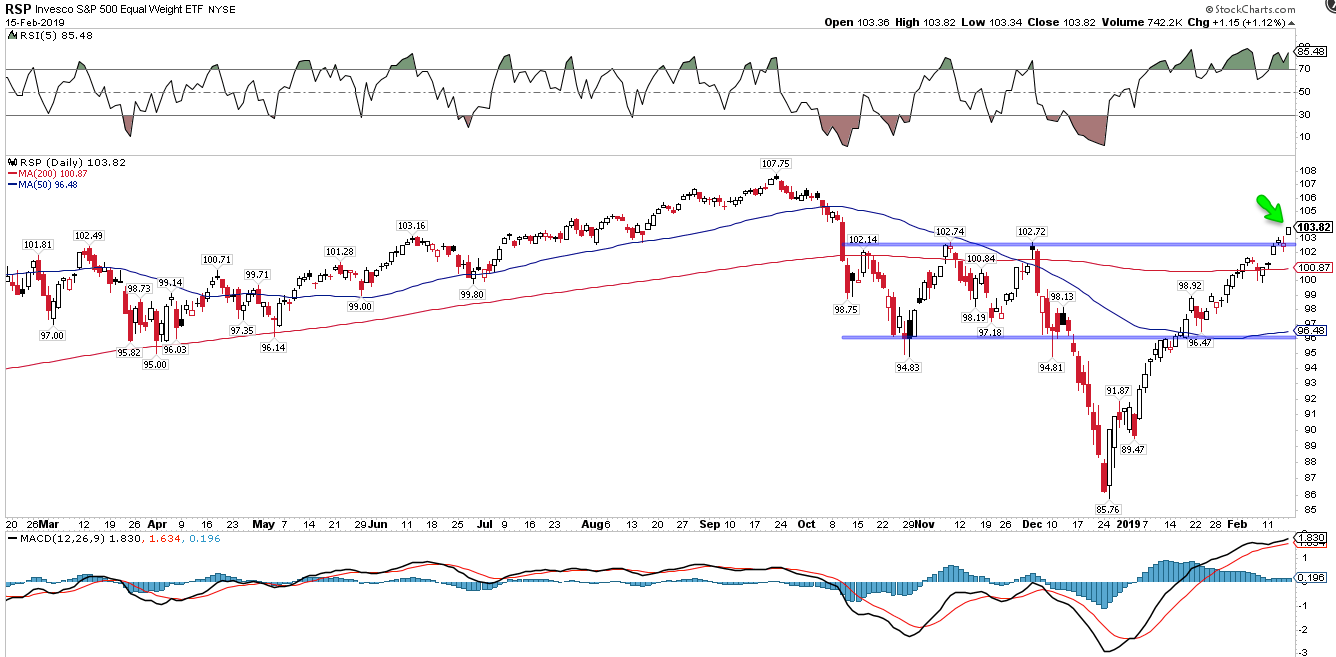
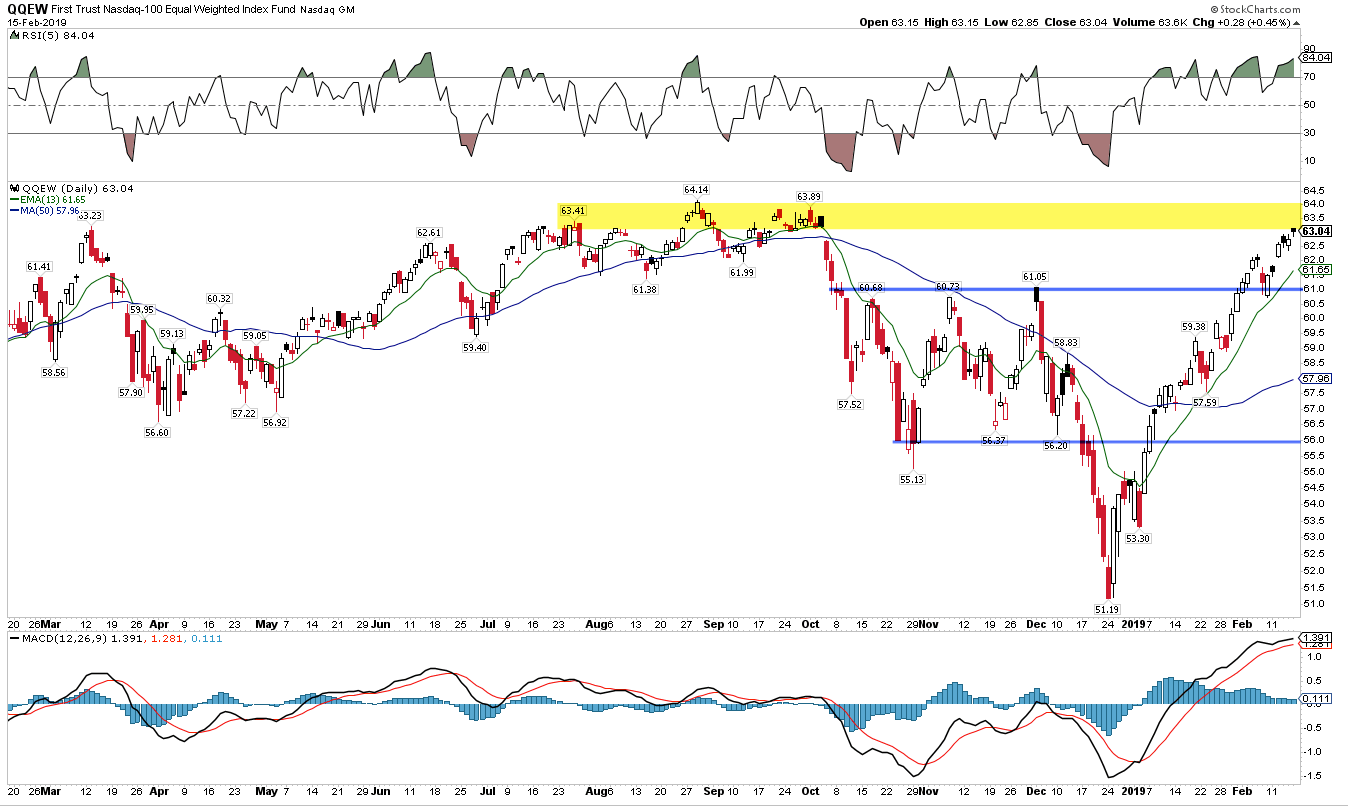
The longer term outlook continues improve. Equal weighted indices, which remove the influence of a few, large companies, are outperforming their traditional market capitalization weighted peers. The Nasdaq index, normalized to reduce the influence of FAANG, is just 1.5% from a new all time high (ATH). If those big companies kick into gear, the traditional indices will likewise move back to their ATHs.
The primary characteristic of this rally has been broad participation. This week, the cumulative advance/decline line for the very broad NYSE made a new ATH . This did not happen during any bear market rally over the past 40 years.
Since Christmas Eve, SPX is up 19%, NDX 20% and RUT 23%. NDX, RUT and DJIA have each risen the past 8 weeks in a row (table from alphatrends.net). Enlarge any chart by clicking on it.

SPX is now back to within 1% of the top of its trading range from October to early December (upper panel). The index is grinding higher as Vix sinks under 16 (lower panel). It would take a close under 2600 to trigger a bearish failure. There are a lot of eyes on this chart and it would be very surprising if SPX did not encounter some resistance as it nears 2790-2810.
In an early January post we wrote that this "does not look a bear market". Part of our rationale was that early momentum was unusually strong: in the past 70 years, this had never taken place within the context of a bear market. In fact, momentum like this has often been associated with the start of new bull markets. An example of the strong forward returns is presented below. A month after "breakaway momentum" had triggered, SPX was up almost 5%, a condition that has always lead to continued gains 3, 6 and 12 months later (from Walter Deemer and Coynefucius).
Likewise, the McClellan Summation index (another measure of breadth momentum) rose to +1000 this week. This did not occur during either the 2000-02 or 2007-09 bear markets. According to Sentimentrader, reaching +1000 has led to positive returns in SPX over the next year 27 out of 28 times (a 96% win rate; to become a Sentimentrader subscriber and support the Fat Pitch, click here).
In the past 20 years, there have been 12 instances in which NYSI has exceeded +1000. SPX closed higher at least once within the next 4 months every time. A year later, SPX was higher every time by a median of 13% and by a minimum of 5%. A 5% gain from Friday's close would put SPX back at its ATH from September (table from Steve Deppe).
First, there have been 10 other instances in which SPX fell 20% in 3 months. The current rally off that low is not only tracking above the median but at the top of the range for all 10. If past is prologue, SPX could chop sideways well into spring (yellow highlights) before resuming its upward recovery). This consolidation might coincide with SPX encountering some resistance at the top of its October to early December range (from Goldman Sachs).
Second, SPX has closed every week higher than it opened for 8 weeks in a row. In the past, the index was higher 6 weeks later in all but 1 instance (a 93% win rate). But in the interim 6 weeks, it has closed lower at least once in all but 3 instances (an 80% lose rate); in the past 50 years, only 1985 continued to sail higher (a 91% lose rate). In other words, a period of consolidation/retracement ahead is high odds (next two tables from Steve Deppe).
Likewise, NDX has closed higher 8 weeks in a row. In the past 50 years, it has closed higher again within the next 3 months in 86% of all instances. But during those next 3 months, a period of some consolidation/retracement occurred in 68% of instances (weekly closing basis).
On the calendar this week: the Presidents Day holiday on Monday; housing starts and FOMC minutes on Wednesday; durable goods on Thursday. Due to the government shutdown, delayed data will be released over the coming weeks.
© The Fat Pitch
Read more commentaries by The Fat Pitch