Weekly Market Summary
Membership required
Membership is now required to use this feature. To learn more:
View Membership BenefitsSummary: SPX has now gained 16% since Christmas Eve, while the Nasdaq is up 19%. NDX, RUT and DJIA have all risen 7 weeks in a row. Large, uncorrected gains like these are typically near the outer limit before a period of consolidation/retracement. That period may have started this week.
The persistence of trend like this is typically followed by higher highs ahead. Breadth reached another milestone this week, a condition which in the past 20 years has not occurred during a bear market and has not occurred until after the correction low was already in. This adds further evidence that Christmas probably marked the low for the recent swoon.
The pullback this week started from a backtest of the 200-day MA, the 4th attempt to regain the 200-d since early October. Importantly, the slope of the 200-d is flat, a condition which is unlike those during bear markets; this is typically when SPX is best able to break higher.
From Christmas Eve to its high this week, SPX gained more than 16% while NDX is up 19%. They have since given back about 2%. NDX, RUT and DJIA have each risen the past 7 weeks in a row. Enlarge any chart by clicking on it.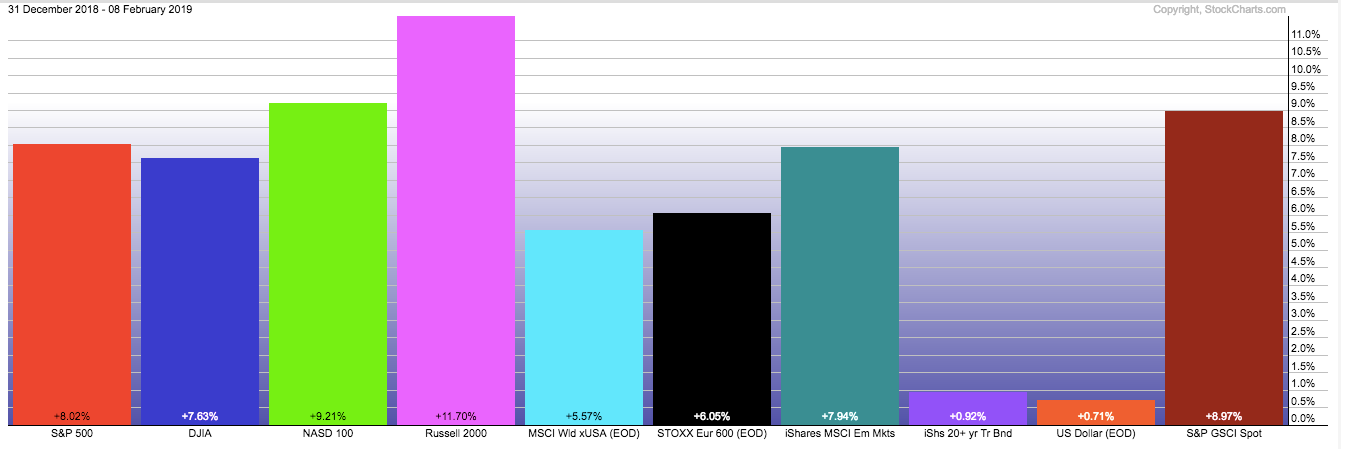
That the indices started giving back some of these gains is normal. An uncorrected 16% gain over 7 weeks has been at or close to the outer bounds over the past 10 years. In each case, a period of consolidation and retracement has followed.
SPX is well above the bottom of its trading range from October to early December (upper panel). It would take a close under 2600 to invalid the move back within this range. Vix dropped under 16 this week, before popping higher on the sell off that started Wednesday (lower panel). It still looks likely that if Vix sinks back lower that it will correspond with SPX grinding its way back to the top of this range, near the 2800 area.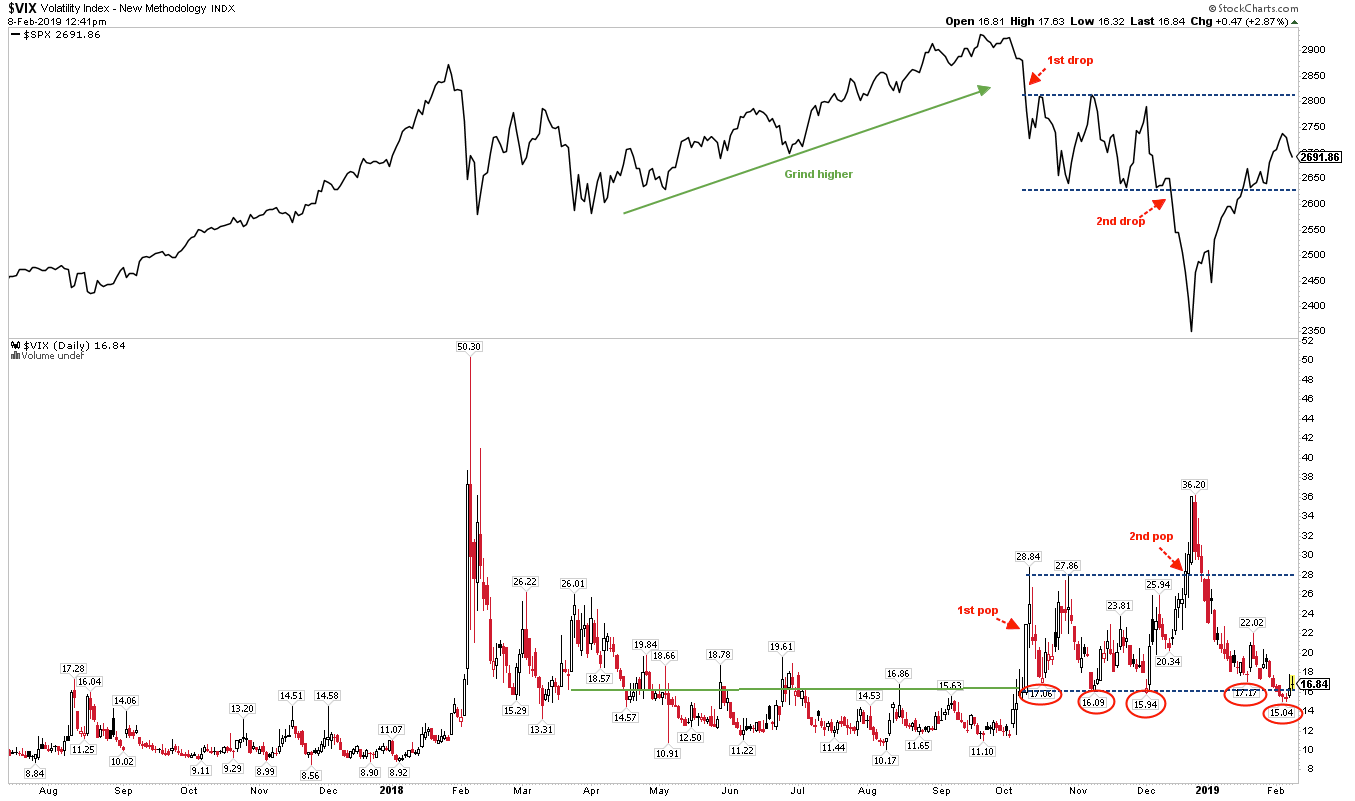
The rally has pushed SPX above its 20-week MA (blue line) for the first time since October 1. The weekly MACD (a momentum indicator) has crossed positive (lower panel). When these both happen, SPX has either already formed a bottom or at least higher highs are ahead. The only exception since 1980 was in 2011, where the indicated week directly preceded a 10% drop in the next month.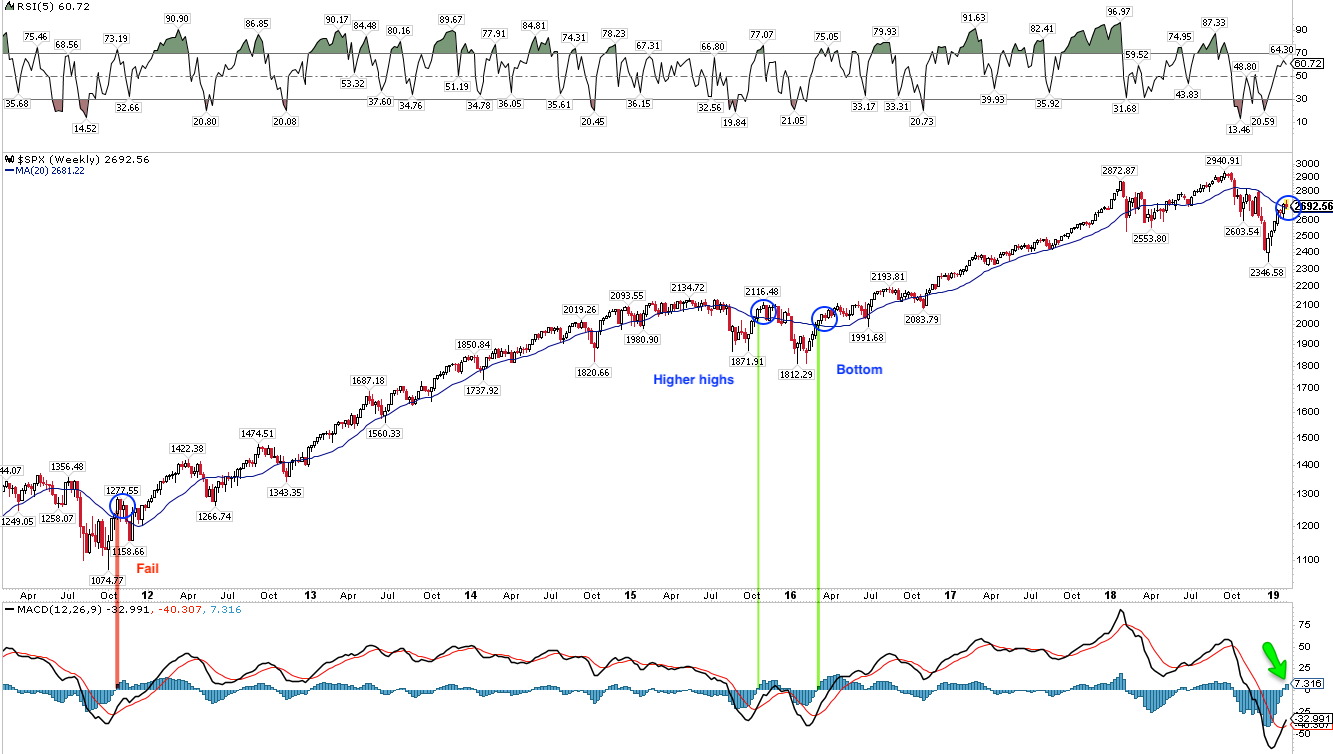


This suggests that SPX, after the current retracement, will move higher in the coming weeks. It also adds more evidence that Christmas probably marked the sell off low.
Further evidence of that being the low comes from breadth momentum, a topic discussed in recent posts (here and here). This week, the Summation index rose to +899 (NYSI, lower panel) . This did not occur during either the 2000-02 or 2007-09 bear markets; the markets had rolled over before then, lacking sufficient breadth. Moreover, when SPX has dropped more than 10% and NYSI subsequently reached +900, the low was, in all cases, already in (circles).
Again, this does not preclude an interim pullback. NYSI reaching +900 has sometimes marked a period when SPX was 'overbought' and pulled back 4% or more (arrows in the chart above). But the low should hold and higher highs should be ahead. The gains over the next several months have historically been outstanding (table from @twillo1).
The stall in SPX this week started from the backtest of the 200-day MA (red line). This was the 4th time SPX has tried to regain the 200-d since early October (arrows). Importantly, the slope of the 200-d is flat, a condition which is unlike those during bear markets. This is typically when SPX is best able to break higher.
Stalling at the 200-d is common behavior for SPX. Many eyes are on the 200-d and so the area around that moving average has become a self-fulfilling line of support and resistance.
Let's look at prior examples of SPX's behavior when approaching the 200-d over the past 40 years.
In 2015, the first rally off the low ultimately failed at the 200-d (red arrows). SPX traded in 4% range for two months before revisiting the low in early 2016. The next test of the 200-d passed (green arrow) but the index then went into a 3-month trading range before moving higher (yellow shading).
In both 2010 and 2011, SPX failed at its 200-d three times before breaking higher. In both cases, SPX hesitated at its 200-d for several days even on the final test before exploding upwards (green arrows).
The first strong bounce in the 2008 bear market failed right at the 200-d (red arrow). Even after closing above it in June 2009, SPX followed it lower for another month before rocketing higher. Unlike this period, the 200-d today is flat. In 2009, it was still sloped sharply downwards.
The 2002-03 bear market was similar: the rallies all failed right at the down sloping 200-d (red arrows). In March 2003, SPX failed again, dropping 5%, before moving higher just 3 weeks later (green arrow).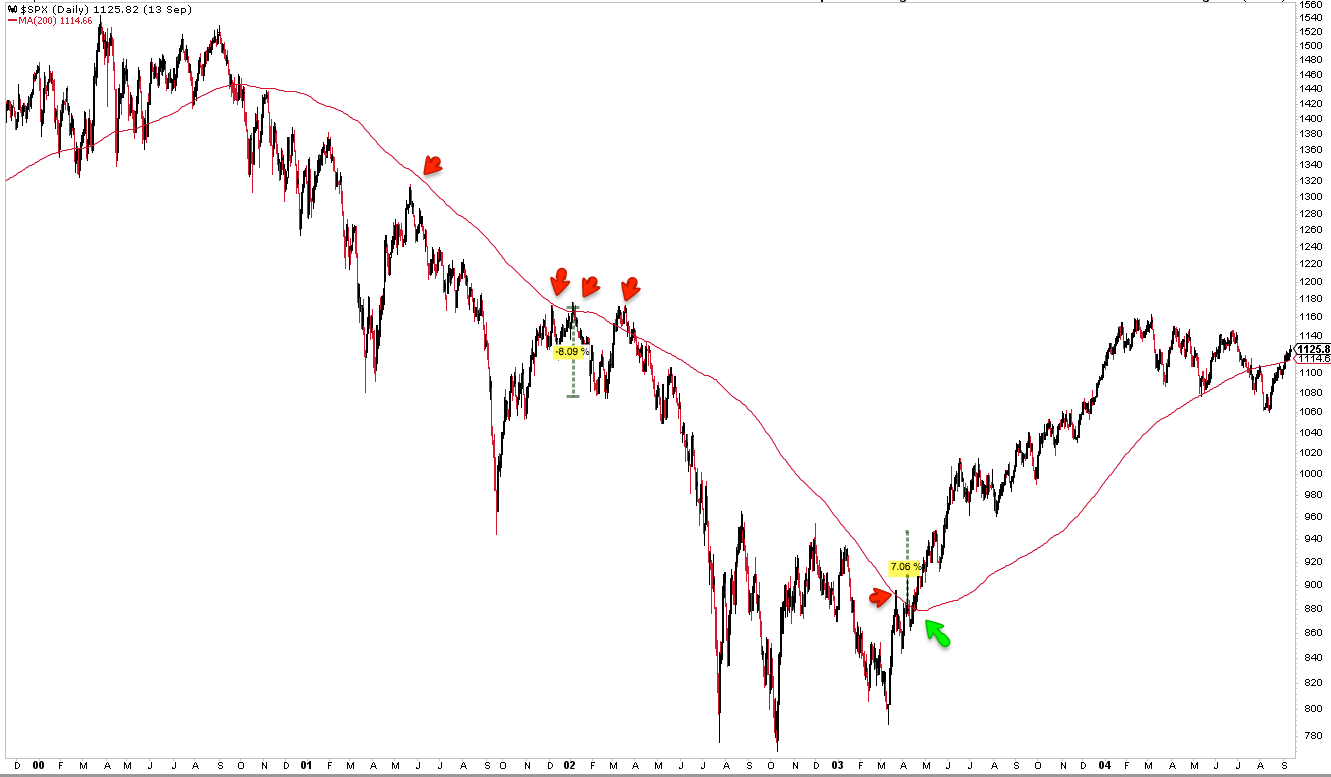
The initial rally in 1998 failed at the 200-d. After hesitating for several days at the 200-d a month later, SPX exploded higher.
1994 was different from the other periods. There was a mild correction early in the year and the index spent the next 12 months zig zagging back and forth around a flat 200-d before rocketing higher in early 1995. 1994 was a boring and frustrating year thankfully lost to history.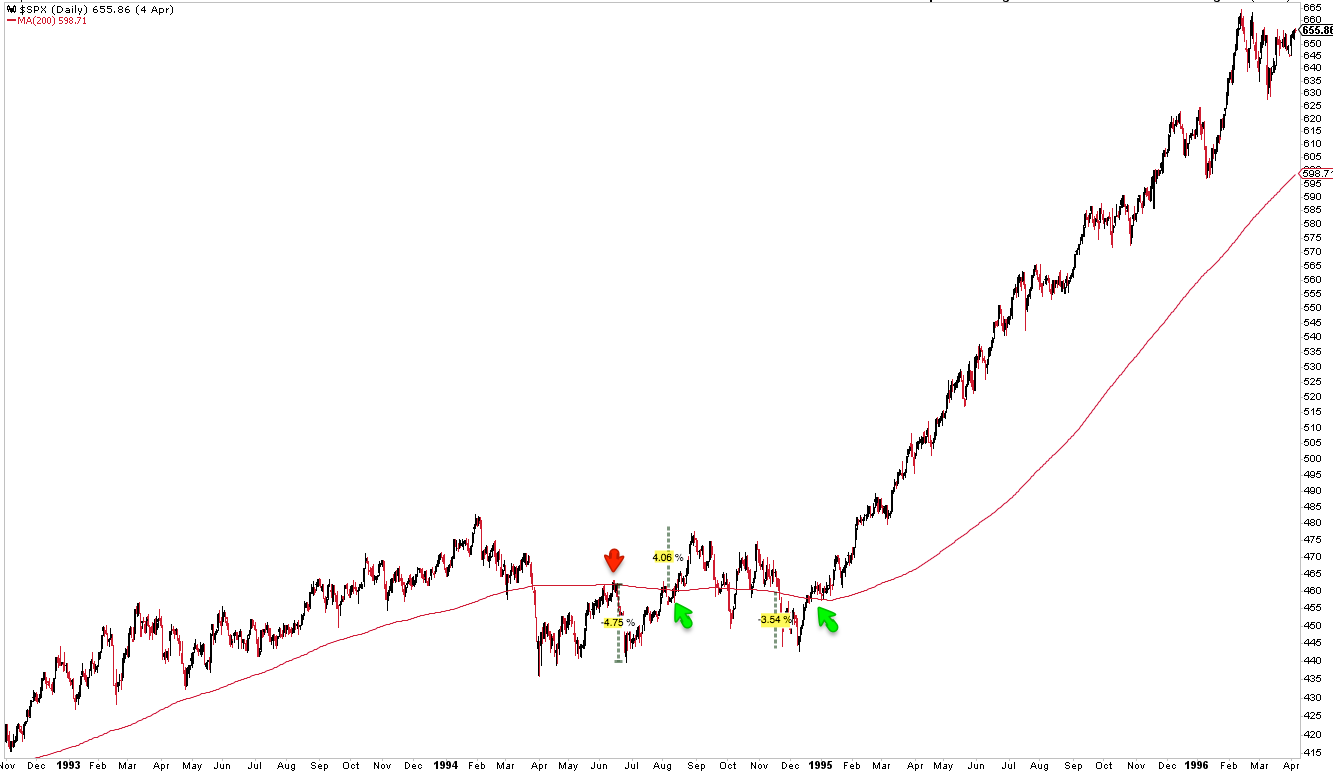
In comparison, 1990-91 fits the general pattern: the first rally failed at the 200-d, the index dropped 6%, and the second attempt, after a several day hesitation, preceded a strong shot upwards.
The 1987 bear market ended like the one in 2009: SPX regained the 200-d and then followed its downward slope the next two months before proceeding higher.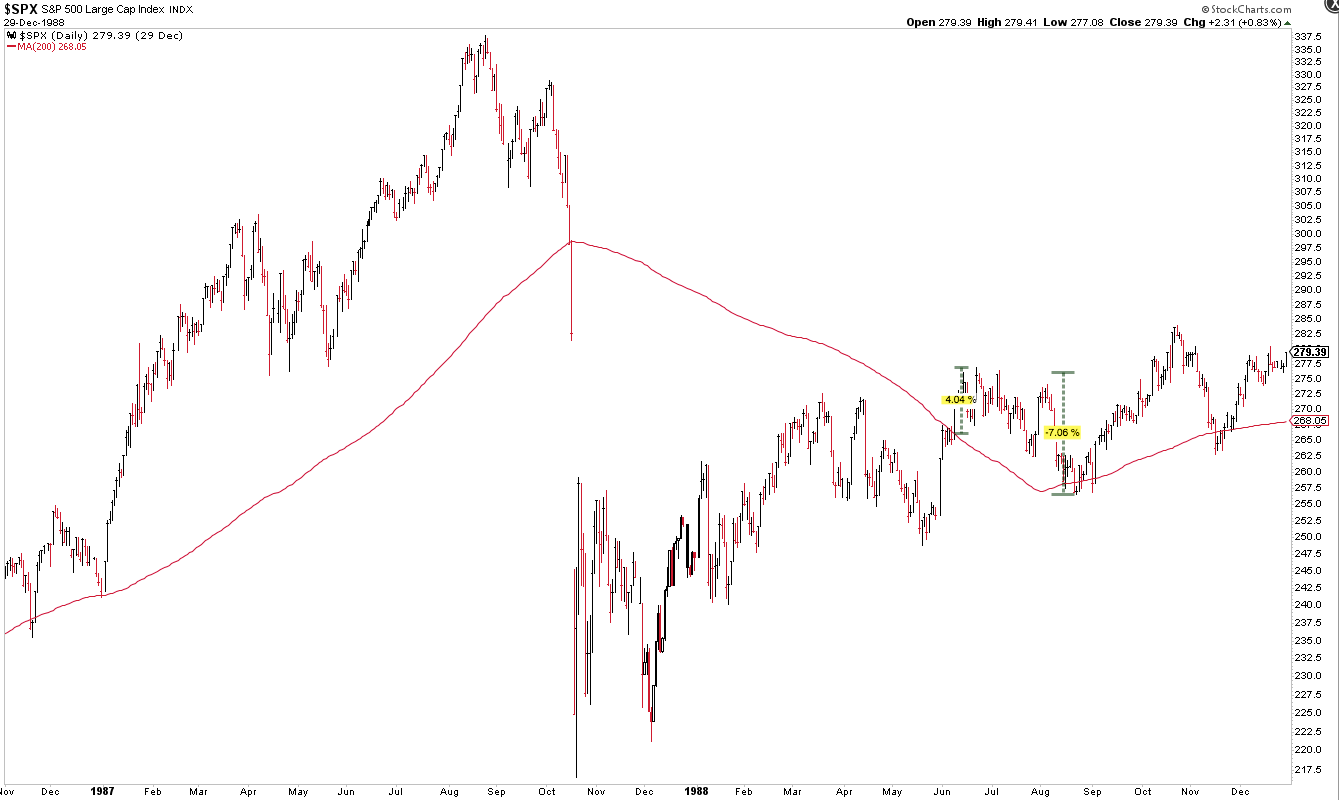
Like other bear markets, rallies during the one in 1981-82 failed right at the down sloping 200-d; the third attempt succeeded. The first rally during the 1983-84 correction failed at the 200-d; the second attempt succeeded, although SPX then fell into a 5% trading range lasting 4 months.
In summary, SPX has typically succeeded in breaking above its 200-d after several failed attempts (like now) and when the 200-d is flat (also like now).
Despite a strong 7 week rally, sentiment amongst analysts has not rebounded very strongly, yet (blue line). Bulls climbed back to just 50% this week; rallies in the past 8 years have not fizzled out until bulls were at least 65% (like late-2015 before the second swoon in early 2016). It would be unusual for there to be much downside until sentiment improves further (from Helene Meisler).
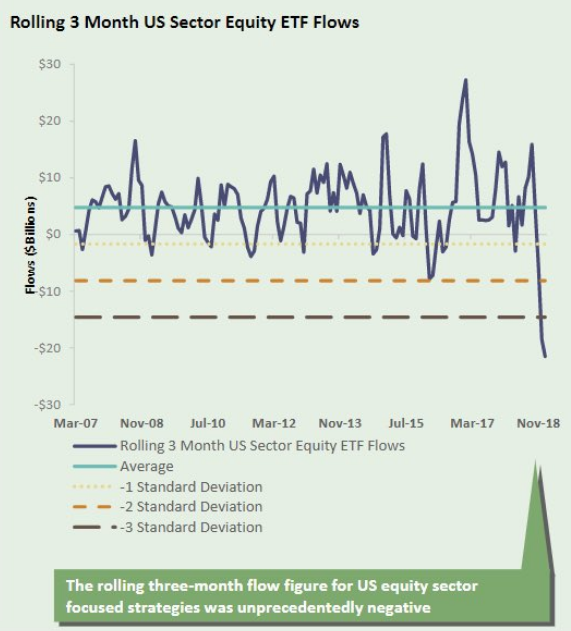
Context matters. Over the past 3 months, investors have moved their money into the safety of bonds and out of equities to an unprecedented degree. It will likely take time for extreme complacency to rebuild (from @SoberLook).
Cumulative US equity outflows have persisted since the peak in October (from DB).
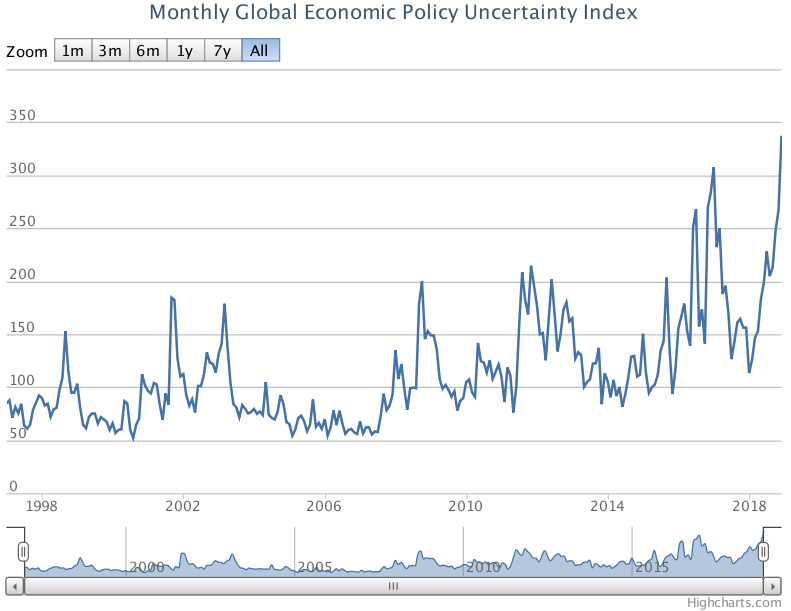
Investors are visibly concerned about economic growth, not just in the US but globally. Measures of policy uncertainty have never been higher. This is very unlike the period early in either the 2000-02 or 2007-09 bear markets, when market participants remained relatively complacent (from Andrew Thrasher).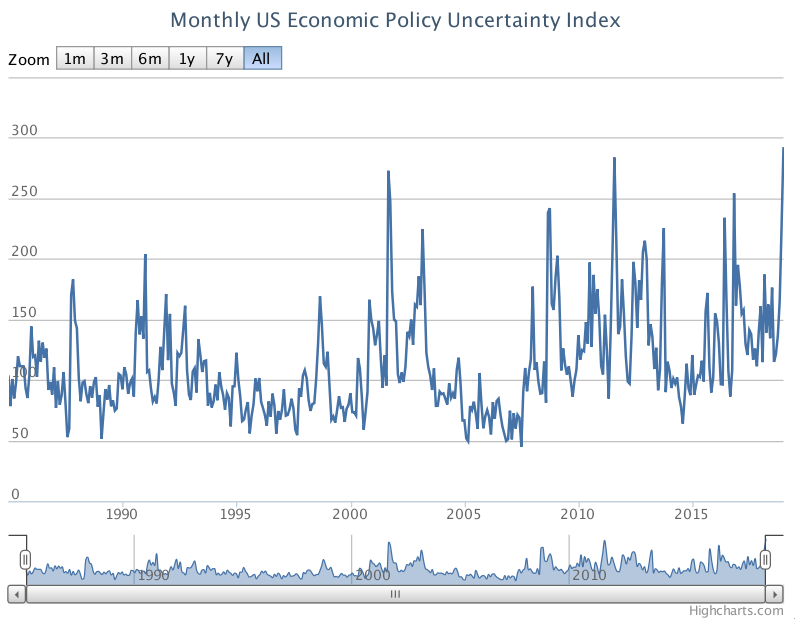
The threat of trade war hit emerging markets hardest; they peaked in January 2018, well before the US. It is therefore encouraging to see these markets rebound. EEM this week traded to a 5 month high; the down trend from January has been broken (top dashed line) and the region appears to have exited a 4 month base (yellow shading). Of note, the region also completed a low retest between October and December (bottom dashed line).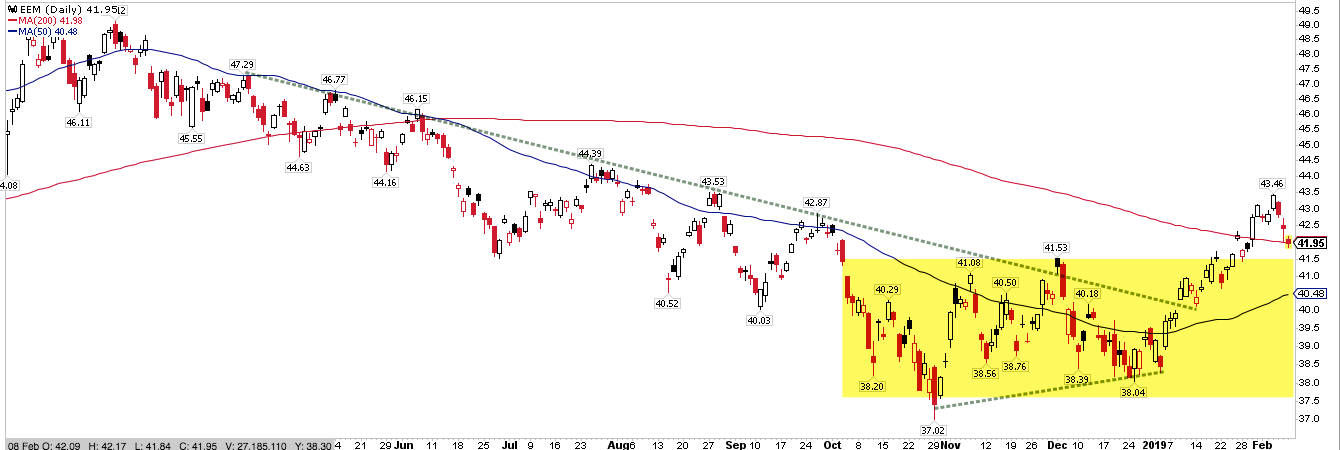
Likewise, South Korea is often considered a good proxy for global trade. The Kospi index ended the week above its 4 month range (yellow shading) and has also put in a double bottom (arrows).
The 'breakouts' for both EEM and Kospi will look doubtful if they trade back within their prior range for more than a day or two.
On the calendar this week: retail sales on Thursday and Friday; also industrial production and OpX on Friday. Due to the government shutdown, delayed data will be released over the coming weeks (from IBD Investors; for a trial subscription, please use this link).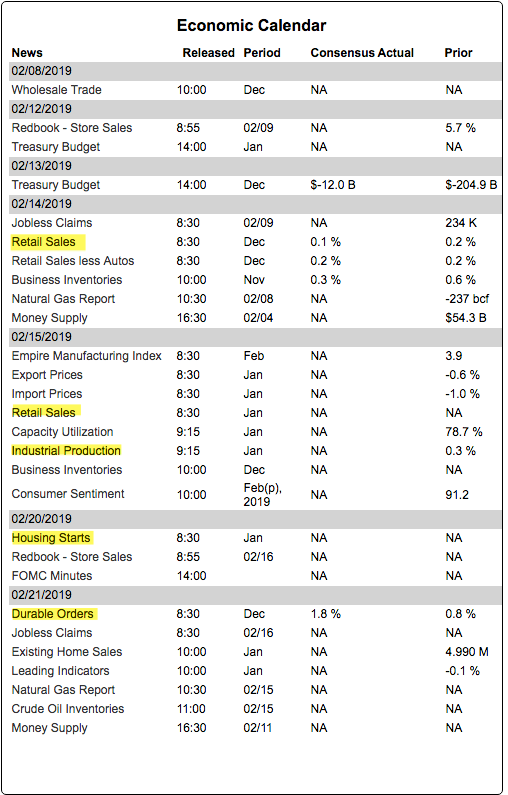
Membership required
Membership is now required to use this feature. To learn more:
View Membership BenefitsSponsored Content
Upcoming Virtual Events View All


