Wag the Dog
A 1997 dark comedy starring Dustin Hoffman and Robert DeNiro, “Wag the Dog” was a film in which a Hollywood director and a spin-doctor collude to fabricate a war in order to distract voters from a presidential sex-scandal. Hilarity ensues. Of course, the irony was that the movie was released just two months before an actual sex-scandal erupted.
The movie popularized the much older English idiom which essentially describes a disconnect between cause and effect. We spent the first two weeks of this New Year scrounging for a theme for this, our first Outlook of the year, given the market gyrations of the previous quarter. Settling on the Wag the Dog expression gives us at least some contextual basis to talk about a period of market schizophrenia. The expression itself, of course, refers to larger events being driven by seemingly smaller, less significant factors having outsized influence (the “tail wagging the dog”). We became familiar with many corny Wall Street sayings in the nascent stages of our career—often handed to us from grizzled veterans (or so we recall). One of these was the advice: “Don’t let the tax-tail wag the dog”. It seemed sensible enough. Do not allow tax considerations to be the primary driver of your investment decisions. But in the decades since we have unfortunately born witness to enormous wealth destruction in a (thankfully small) handful of clients who refused to realize capital gains because they did not want to pay taxes—only to see those gains evaporate and be left with a large capital loss (and a significant change in net worth as a result). Here’s another corny Wall Street saying; “Markets tend to take an escalator up but take the elevator down”. Funny how the corny sayings often ring true (some others include: “Buy the rumor, sell the news”, “Sell in May, go away”. I have more…).
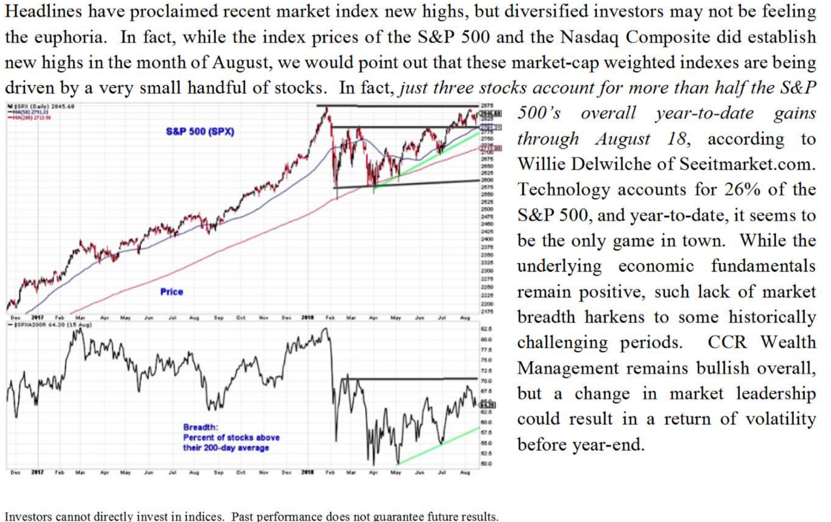
But this isn’t about taxes. This is about cause and effect—or effect and cause. Chicken and Egg stuff. Is the stock market predicting the economy? Does the economy justify the stock market moves? Can the immediate economic future be that drastically different from the recent past? Throughout 2018, we have tried to lay the cards out as we have seen them; discounting some themes which get the most press, and perhaps trying to emphasize little published factoids. Over the last 18 months, regular readers will recall our discussions of narrowing market activity. That is, more and more money being concentrated into fewer industries—and ultimately into a handful of stocks. FAANG anyone? We even compared and contrasted the late ‘90’s market structures to contemporary situations. Our late-August client-review synopsis expressed some reservations about the longevity of major index returns being driven by only a handful of stocks (excerpt below):

Having these misgivings justified by a sharp market correction is of NO solace as financial advisors. We are market participants as well as investors. We are not market timers and certainly not market cheerleaders. Objectivity is our trade, and frankly, how we earn our keep.
Objectivity itself seems to be a fleeting thing in the digital age. Just a couple weeks ago we marveled with a colleague over the stunning about-face done by a certain financial-news pundit who spent an entire four-hour segment interviewing “experts” about whether the recession would begin in February or March (not if a recession was imminent, but when). 24 hours and one Fed comment later, she asked, “none of this really matters anymore, does it?”. It may seem that the media’s job is to blow the wind harder in the direction it is already blowing. Beware the short-term shifts in the breezy narrative if you are taking your ques from this quarter.
Cum hoc ergo propter hoc: “With this, because of this”.
Let us consider two facets of cause and effect. The first is sterile, mathematical, and statistically significant. Behold the beauty of what many in the geekier, quant-oriented corners of the financial analyst community know as the “JP Morgan Formula”:
σ2t =Ѳσ2t-1 + (1-Ѳ)ε2t
This is a basic time-series regression used to forecast market volatility. It simply states that volatility tomorrow (σ2t) will be a weighted average of volatility today, plus a random error (or shrinkage factor). In short, volatility begets more volatility…until it burns itself out. The art of using this tool, of course, is correctly naming the weighting coefficient (Ѳ). Notice, there are no economic signals in the regression—so it does not answer the question of why, nor does it predict the severity. This is simple evidence that not every day’s move in the stock markets can be explained neatly with the daily narratives in the news.
Our last Outlook, released in October, observed that market volatility often rears its head in September and October. Indeed, we were as surprised as many of our clients by the November and December trading patterns given the relatively benign economic releases and the equally benign historical market returns in those months. Two of the most commonly cited worries were the Chinese trade impasse and the Federal Reserve’s future path of interest rate hikes (note: consensus throughout the fourth quarter included the December hike). Even the announcement of the 90-day trade “cease fire” with China on December 3rd resulted in only a short-lived reprieve. The S&P 500 lost close to 3% the very next day and went on to shed another 12.92% before bottoming out on Christmas Eve.
The second facet to explore in the cause and effect relationship is causation itself. The “why” of Q4 volatility is the real head-scratcher. Markets are generally leading indicators, yes? (hint: yes). This is the real chicken and egg stuff—which comes first? Did the market correctly foretell recessionary economic evidence throughout the fourth quarter or are structural issues to blame (program trading, algorithms, corporate actions)? We touched on the latter in our November webcast and we will revisit the issue in our February webcast. In short though, human beings (not machines) decide to sell.
The last two quarters have shown us how far markets can get ahead of the news—both to the upside and to the downside. We began talking about the age and possible winding down of the current market-cycle back in August and we know the theme has become more pervasive in the months since. While some leading economic data have been somewhat soft (mostly survey data), trailing data has remained firm—even for the months in which the markets were pummeled. Let’s briefly walk through some of this conflicting evidence:
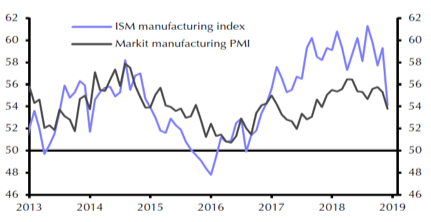
- The ISM (Institute of Supply Management) Purchasing Manager’s Survey for December was released early this month with a reading of 54.1. For context, a reading higher than 50 for this leading indicator strongly suggests an economy that is growing. Good news, yes? The problem is that the previous reading in November was 59.3—a drop of 5.3 (~9%) is the biggest monthly drop since October 2008. Conclusion: the economy continues to grow, but at the slowing pace.
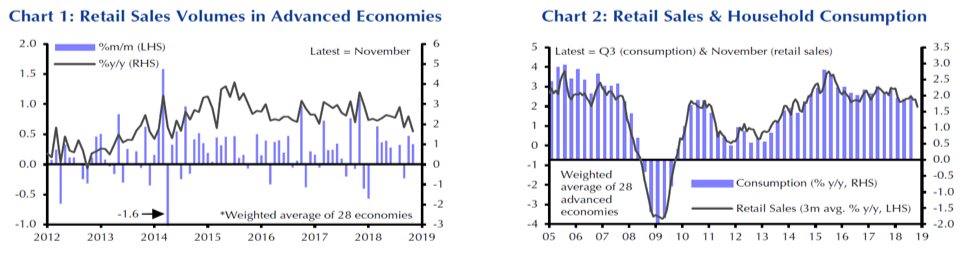
- All evidence indicates that household spending held up well in the fourth quarter—even as markets tanked. On the other hand, prior to being revised up slightly (to 98.3 from 97.5), December’s initial University of Michigan Consumer Confidence reading seemed to confirm a softening trend from September’s high of 100.1. Still, while somewhat softer, these readings indicate a healthy consumer outlook. Consumer Confidence in the US has averaged 86.45 from 1952 through 2018.
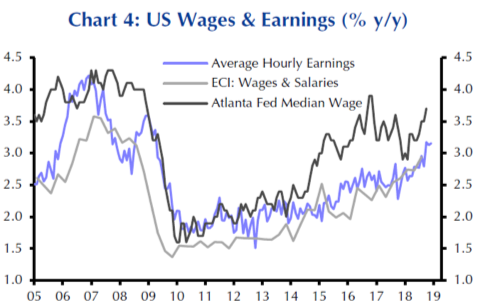
- Hourly earnings increased 3.2% last year. Unemployment remains near a 49-year low. “The far bigger than expected 319,000 jump in non-farm payrolls [for December] would seem to make a mockery of fears of an impending recession”, says Capital Economics. The consensus estimate was for 177,000 job gains in the month.
A significant piece of data that is missing from this analysis is just beginning to take shape now. We are talking about corporate earnings releases and their follow-on conference calls. The earnings themselves are expected to be generally good, but this is backward-looking data. It is the commentary from the CEOs and CFOs about their outlooks for the year which we think investors will be paying attention to more closely. Collectively, this commentary will be treated as survey data from the nation’s largest producers and employers.
Oh—and the 90 day hard-deadline on getting a trade agreement with China is March 1…so there’s that.
EQUITIES
CCR Wealth Management’s outlook for 2019 (and beyond) is cautiously optimistic—with an emphasis on caution. Since the Fed Chairman Jerome Powell has signaled a more dovish stance on the pace of future rate hikes, we are optimistic. Evidence of a slowing rate of economic growth has not been alarming—and importantly, stocks are once again very reasonably valued by historical standards. We are cautious because, as we have seen, a market cycle in its late stages is a jittery thing. In this light, the Chinese negotiations loom larger to us in the near-term than they have in the last twelve months. Investors are in no mood.
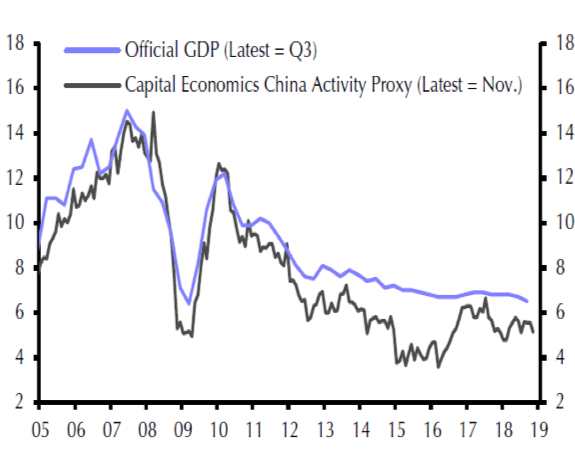
We are also cautious because the global economy is slowing as well. The second largest economy in the world, aside from being engaged in sometimes contentious trade negotiations with the US, continues to decelerate. China just reported the slowest economic growth rate in nearly 30 years for 2018, at 6.60% (down from initial estimates of 6.90% for 2017). Few Western economists and market watchers place much faith China’s official data releases. Most peg actual GDP growth in the Middle Kingdom to between 5.90% and 6.30%. Still, slowing growth is expected of an economy approaching China’s size—but things may also be exacerbated by the trade tensions with the US. Evidence of this is particularly apparent in the fourth quarter’s estimate of 6.40% growth, coupled with a sharp regional slow-down in the southern technology and export-driven cities of Shenzhen and Guangzhou. Given China’s lynch-pin status in economic Asia, ripple effects could be felt throughout the world’s developed and developing economies.
Further reasons for caution come from across the Atlantic. We can trace the most recent leg-up in US markets to the day after the surprise Brexit referendum in the UK (June 2016). Widely feared by most at the time as a major economic disruption, markets actually rallied sharply after the vote 2 ½ years ago on news that UK voters had opted-out of the European Economic Union (yet another example of narrative-failure to predict). Hopes for monetary stimulus and favorable negotiated exit terms to ease Britain’s transition muted fears of a potentially contentious “hard exit”, where no trade or customs agreements could prove potentially crippling to the UK economy—and the European Union to a lesser extent.
These fears came roaring back last week as the expected defeat in Parliament of Theresa May’s negotiated settlement with the EU became a rout, being rejected by 432 votes to 202. A milder rebuke would have held out the possibility of tweaking the agreement slightly to gain ultimate approval. The actual vote, however—a historic defeat—holds out little possibility of reconciliation with the EU’s positions. Additionally, it raises the veil on the messy parliamentary politics in the UK which has revealed very little common ground not only between Conservatives and Labour, but also within each faction (it seems political disfunction is not unique to the US).
In the mean-time, the hard deadline for Britain to leave the EU is March 29, (11:00pm, GMT). After 2 ½ years, the lack of progress is distressing, and a hard-exit looks likely. A recent Wall Street Journal article highlighted some of the nightmarish scenarios of a hard exit—including insulin and other medicine shortages in Britain due to heavy reliance on producers in Europe.
We will be attending a dinner at the Boston CFA Society in a few weeks which hosts the Hon. David Cameron, retired UK Prime Minister, as speaker. Mr. Cameron resigned office shortly after the 2016 Brexit vote (having opposed Brexit, he called for the referendum, which allowed it to pass). We are eager to hear his comments.
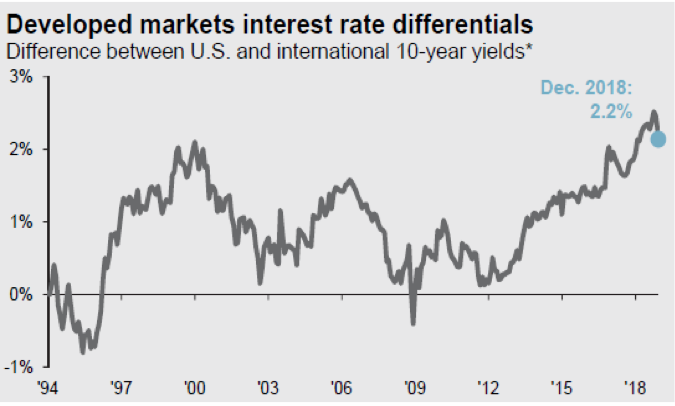
Our last concern is one that we have not read much about but think it could become part of the public conversation eventually. While a slowing rate of growth globally is not necessarily a bearish signal, and while a Federal Reserve’s willingness to provide “flexibility” in its pace of interest rate increases is welcome news, global central banks do not appear well-positioned to help engineer “soft landings”, should the need arise. US interest rates, both short and long-term, stand well-above those of our major trading partners. The ten-year treasury spreads are the highest in nearly 20 years. Slowing growth (and Brexit complications) could, for example, interfere with the European Central Bank’s efforts to normalize monetary policy eventually, the way the Fed has.
And even though the Fed has been steadily raising rates for over two years, the current Fed Funds rate of 2.25%-2.50% hardly presents itself as potent ammunition in the event of an economic stall here in the US (which, we hasten to reiterate, is not our base-case scenario).
So where do we go from here? More than a few times last year we pulled out the so-called “periodic table” to illustrate to clients that a diversified portfolio struggled in a market where a single index is powered by just a handful of stocks. As we pointed out in our first illustration, these types of markets tend not to last. The benefits of diversification were felt in the fourth quarter, though it may not have felt like it at the time. All stocks got pummeled when the irrational selling truly began. These types of markets also tend not to last. We remain diversified investors, with broad equity exposures consistent with our “cautiously optimistic” outlook. We believe it is likely that the high-flyers of recent years (FAANG) may struggle to regain their old high’s—and some likely have already seen their highs within this market cycle. It is also likely that many sectors which irrationally lagged the broader markets recently (financial stocks, for example) could see a resurgence of interest from investors, at least on a relative basis. Reversion to the mean seems to be occurring even as we write.
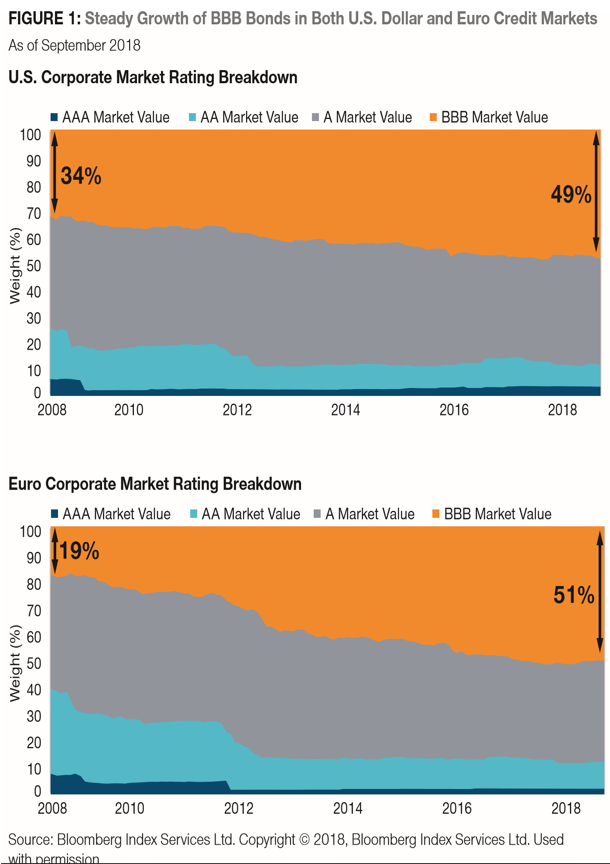
If we must make a prediction now (‘tis the season for predictions), it is that Wall Street will begin to pay more attention to the “quality” of publicly traded stocks. That is, balance sheets, income, and cash flow statements will be more thoroughly examined for sustainability of earnings. This market cycle has been characterized in part by historically low interest rates. A plethora of companies have taken advantage of these rates by levering up their capital structure. Much of this borrowed money has been used to finance growth and found its way into the stock market through either M&A activity or, in many cases, stock buy-backs. In the US, the BBB-rated bond sector has grown to nearly half the total outstanding corporate debt markets from roughly a third ten years ago. In Europe (also replete with unusually low interest rates), the growth of the BBB market is even more pronounced. Ten years on—its time to start thinking about this debt coming due. Interest rates, at least here in the US, may not be as attractive for refinancing purposes, and growth which has been financed may prove elusive. CCR Wealth Management’s investment team has been paying closer attention to our asset manager’s screening criteria for this very reason. While corporate balance sheets remain healthy on average today, we do see the potential for more leveraged companies to face stiffer head-winds ahead, and for Wall Street to begin to recognize this.
FIXED INCOME
In trying to strike a balance between caution and optimism, we turn our attention to the fixed income markets. We recognize that to many of our clients, like investors generally, their bond allocations are an afterthought. It is the equity markets that tend to receive all the press, after all. Yet, if bonds account for 30%, 40% or even more of an asset allocation, clearly the return of bonds plays a major role in the return of the portfolio—and should play a major role in your portfolio return expectations. We have done the math before—but it bears repeating. If expectations of bond returns are 0%-2% and you are allocated 40% to bonds, then using the mid-point of the expectation, your portfolio return will be (.40 x 1%) + (.60 x equity return).
0%-2% has been CCR’s long-standing forecast for the bond market (the Bloomberg Barclay’s Aggregate Bond index, or BarcAgg). Last year the BarcAgg came in at 0.01%--having spent much of the year in negative return territory. Our forecast has been entirely informed by our expectations of interest rate hikes.
We think we see light at the end of the tunnel as far as these low returns are concerned, though in the near term (2019)—we think returns will be at the higher end of the 0%-2% range. Important to this outlook is that we are talking primarily about duration risk (interest rate risk). Slightly better bond returns will be driven by two factors, in our view. First, we think the Federal Reserve will raise rates only once in 2019 (if we are wrong, they raise them twice, but certainly not four times, as was the Fed consensus as little as three months ago). Second, we believe the return of volatility to the equity markets, as last year, will support bond prices. The BarcAgg index rose 2.36% from its low at the end of last year as equity volatility accelerated, despite the mid-December rate hike. Bonds and stocks compete for the same investment dollars as we have pointed out before. Higher interest rates provide a viable alternative to the risk in the stock market—particularly for many institutional investors.
We remain somewhat more cautious on credit risk. Thus far, few holes have been poked in the credit balloon we discussed above (BBB’s). But equity market gyrations tend to have a high correlation with the width of credit spreads. Bonds and stocks are both concerned with the earnings outlook (but for different reasons), and “end of cycle” remains the current narrative. CCR Wealth Management’s bond allocation was largely de-risked from a credit standpoint (not to infer there is no credit risk). We think sacrificing a percentage point or so on yield is worth it to avoid the potential rollercoaster of widening yield spreads.
COMMODITIES
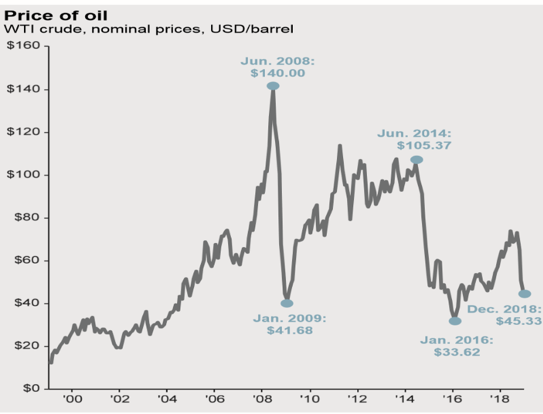
We cannot wrap up without commenting on commodities, given the modest positioning we took last spring, as well as the disappointing results. Shortly after a roughly 5% portfolio position initiation, the trade dispute with China erupted with animosity. Our chosen vehicle was a fund that does not place a huge emphasis on energy (unlike most commodity indices), but rather spreads the risk among commodity classes equally. As a result of trade tensions with China, many agricultural commodity prices were hit hard over the summer (Soybeans were down ~12%), while oil prices rose 24% over the same period. Being underweight the rising commodity and overweight the falling commodity is no fun. But then oil collapsed by nearly 40% in the fourth quarter, with WTI crude falling from $75.30 per barrel to $45.41 by year-end. Bad luck, lousy timing. Invest long enough and it will happen to everyone.
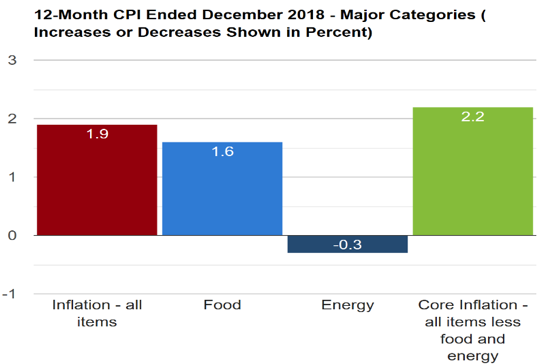
From a portfolio management standpoint, a double-digit blemish for a line-item investment is frustrating—enough so that we have avoided crowing about our lack of emerging markets exposure all year (EM down over 14% in 2018). On the other hand, a 5% position (which is now likely 4%) does not deliver a devastating blow to resilient portfolios. When actual events do not cooperate with an investment thesis over the short term, the proper thing to do is to revisit the thesis. We have done so on a regular basis since the summer. We outlined our motivation for adding the asset class in our May Outlook. Recall that the Fed’s outlook for core inflation then was ~2.00%. Our view was two-fold: 1) that core inflation would continue to rise, likely higher than 2.00%, and that 2) historically, there is ample evidence that commodities do well in late market-cycles. “Core” refers to the CPI stripped of food and energy inputs because of their inherent short-term volatility. Core inflation for 2018 came in at 2.20% for 2018, slightly ahead of the Fed’s expectations and in-line with the expectations we wrote about in May. As we outline above, “core” hasn’t been the problem. The issue has been agricultural prices (food), and then energy prices (crude oil). The exogenous nature of factors affecting agriculture and energy prices has kept us from abandoning—or adding to commodities for the last nine months. A trade resolution with China could have us revisiting this position one way or another in the coming months. However, it will be in keeping with our cautiously optimistic outlook.
A New Year is often an opportunity for renewal, and for some perhaps, resolution. In either case, CCR Wealth Management would like to use the occasion to renew our grateful appreciation of your continued trust and business. And of course, we wish all our clients a healthy and happy 2019!
The views are those of CCR Wealth Management LLC and should not be construed as specific investment advice. Investments in securities do not offer a fixed rate of return. Principal, yield and/or share price will fluctuate with changes in market conditions and, when sold or redeemed, you may receive more or less than originally invested. All information is believed to be from reliable sources; however, we make no representation as to its completeness or accuracy. Investors cannot directly invest in indices. Past performance does not guarantee future results. Securities offered through Cetera Advisors LLC. Registered Broker/Dealer, Member FINRA/SIPC. Investment Advisor Representative, CCR Wealth Management, LLC. Registered Investment Advisor. Cetera Advisors LLC and CCR Wealth Management, LLC are not affiliated companies. Cetera Advisors LLC does not offer tax or legal advice. CCR Wealth Management 1800 W. Park Drive, Ste 150, Westborough, MA 01581. PH 508-475-3880
© CCR Wealth Management
Read more commentaries by CCR Wealth Management