Summary: Since the 20% fall in equities into Christmas Eve, equities have rallied 3 weeks in a row, gaining over 10%. So is the correction over?
Sharp falls of at least 15% have a strong tendency to have their original low retested in the weeks/months ahead. That is true even, as now, a sharp 10% bounce occurs. But what is notable this time is the persistence of the gains each week, and the exceptional breadth (participation) that has driven the indices higher.
This is important because, in the past 70 years, this has never taken place within the context of a bear market. In fact, breadth momentum like this is often associated with the start of new bull markets. Net: the Christmas low may still get retested, but it seems likely to hold and new highs are probably ahead. Nothing in the stock market is ever guaranteed, but this has been the consistent, historical pattern.
The bounce that started on Christmas Eve continued this week. SPX gained for a third week in a row, adding 2.6%. NDX was up 3% and small caps were up nearly 5%. Volatility fell 10% (table from alphatrends.net). Enlarge any chart by clicking on it.

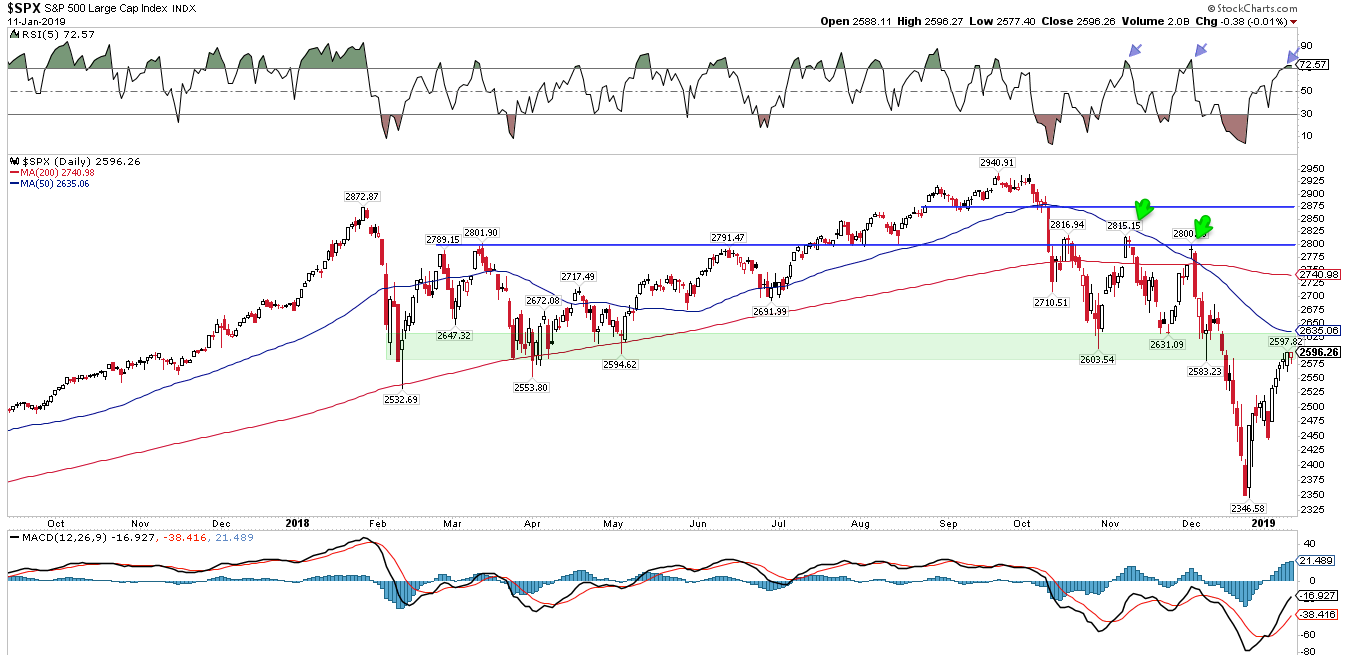
The rally has brought SPX back to the area where it failed in mid-December and from which a 10% drop over 7 days occurred (green shading). The 50-dma (blue MA) is at the top of this range; it's been resistance since the September high (green arrows). As stated last week, there are a lot of eyes on this chart; expectations are that prior support becomes resistance and the rally at least stalls (or outright fails) here. A move higher (above the green zone) would therefore be noteworthy.
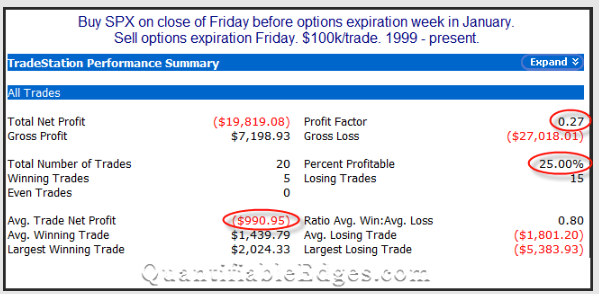
This bounce will face a seasonal headwind in the coming options expiration week. 15 of the last 20 January OpX weeks have closed down by an average of 1%. Risk/reward has been 3:1 down. It is the second worst week of the year (from Quantifiable Edges).
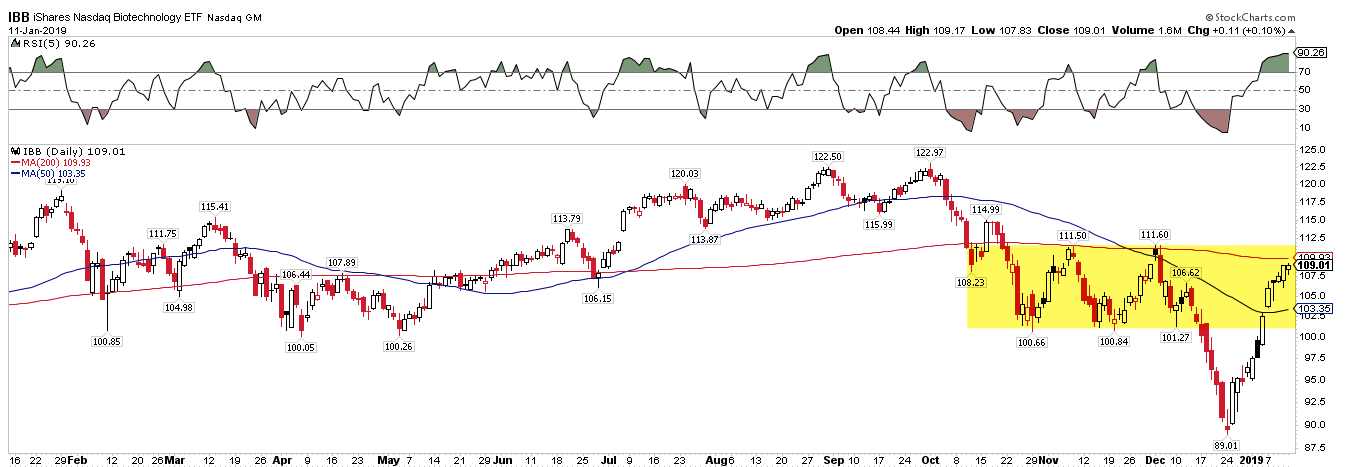
The leader since Christmas Eve has been biotech, with the sector up 21% in 12 days. It is firmly back within its October-December range (yellow shading). The last two rallies failed right at the top of this range, about 1.5% higher.
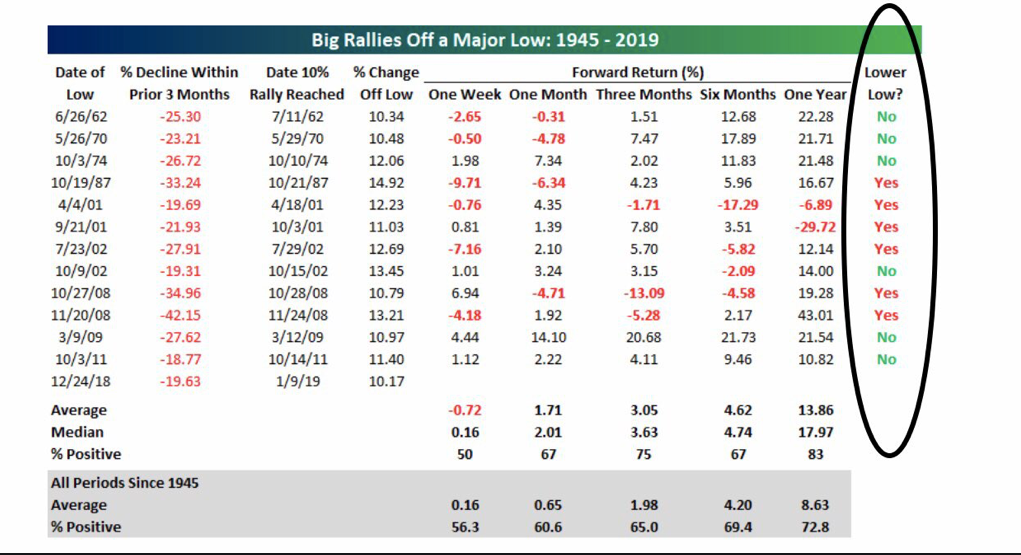
The rally off the Christmas Eve low has now exceeded 10% for SPX. A sharp fall (more than 15% in less than 3 months) followed by a sharp rally (at least 10% in 10 days) like this has only occurred 12 times in the past 75 years. Forward returns were very good: SPX was higher 75% of the time after 3 months and 83% of the time after 12 months, with a median gain of 18% (from Bespoke).
But the catch is that in half of these cases, the sell off low (in this case, Christmas Eve) was exceeded in the interim period, creating a "lower low" (far right column in the table above). It's actually worse than that because in 4 more cases (1962, 1970, 1974 and 2002; shown below) the first low was retested, but not broken, in the months ahead. That means that there was significant interim weakness after the first big bounce in all but two instances (83%; chart from Stooq).
This is consistent with our post from last week. In the more than 10 instances since 1980 where SPX fell 15-20% or more, it retested that low in all but two cases (1982 and 2009, both major lows following bear markets lasting 21 and 17 months, respectively).
According to Renaissance Macro Research the past 12 months have the highest correlation to the 1956-57 period. Take any single analog with a sea of salt, but in the months ahead, the low was retested before the next bull market began in earnest.
But this rally has been impressive in several ways that suggest the Christmas low is likely to hold and that new highs are probably ahead over the next several months.
First, SPX has gained more than 1.8% each week in the past 3 weeks. Since 1950, that has happened only 13 times. Over the next 1, 3 and 6 months, only one year experienced a significant drawdown (1973, the year of the oil embargo). The other 12 instances (92%) gained an average of another 6% and 9% in the next 3 and 6 months, respectively (table from Troy Bombardia).
In particular, note that of these 13 instances, only two took place within the context of a bear market (1973 and 2001). In the other 11 (85%), this type of strength was a feature of an ongoing bull market. In fact, the instances in 1962 and 1982 marked the initiation of new bull markets.
Second, breadth (i.e., the number of stocks participating in the rally) has been exceptional over the past 2 weeks.
On Tuesday, the NYSE experienced a "Zweig breadth thrust." Created by Marty Zweig, his eponymous indicator occurs when the 10-day average percentage of advancers swings from less than 40% to over 61% within 10 days. As Tom McClellan says, "it is a sign that a rapid surge of money is trying to push its way through the door to get into the market." Since 1962, there have only been 11 Zweig breadth thrusts.
The forward results are impressive. Since 1970, SPX has continued to rally every time over the next 20 days by a median of about 6% (table from Quantifiable Edges).
Looking back at the Bespoke table of 10% rallies after a 15% drop, only 4 of those 12 rallies triggered a Zweig breadth thrust (June 1962, October 1974, March 2009 and October 2011). In none of those 4 was there a "lower low", although in 2 (1962 and 1974) a low retest occurred. In other words, exceptional breadth after a sharp fall of more than 15% has marked the cyclical low.
Of the 11 Zweig breadth thrusts in the past 60 years, only one (in 2015) was followed by a lower low before a new high was achieved. In that one instance, the February 2016 low was just 2% below the low on August 2015 (closing basis). Importantly, in between those two dates, SPX came within 1% of its all-time high from May 2015.
All instances of the Zweig breadth thrust since 1962 are shown below.
Again, what is noteworthy about both the Zweig and breakaway breadth thrusts is that none took place within the context of a bear market. This adds evidence that the current swoon is a correction within a still ongoing bull market.
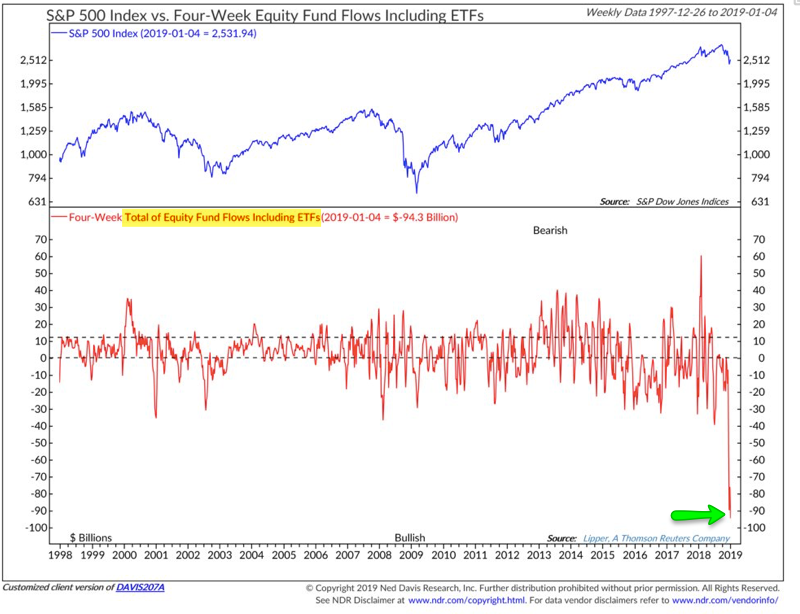
That is consistent with our macro economic view that a recession is not currently unfolding (read here). It is also consistent with our view that the correction was mostly a panic attack in which investors dumped equities on an unprecedented scale (first chart from the FT, the second from NDR).
In summary: sharp falls of at least 15% have a strong tendency to have their original low retested in the weeks/months ahead. But what is notable this time is the exceptional breadth that has driven the indices higher: in the past 70 years, this has never taken place within the context of a bear market. The Christmas low may still get retested, but it seems likely to hold and new highs are probably ahead. Nothing in the stock market is ever guaranteed, but this has been the consistent, historical pattern.
On the calendar this week: retail sales on Wednesday, housing starts and permits on Thursday and industrial production and Options Expiration on Friday (from IBD Investors).
© The Fat Pitch
Read more commentaries by The Fat Pitch