Summary: Equities fell 20% from their September high into Christmas Eve. Since then, they have rallied almost 8%. While this is encouraging, there were two similar rallies, at the start of November and December, that both fizzled out. What is different this time?
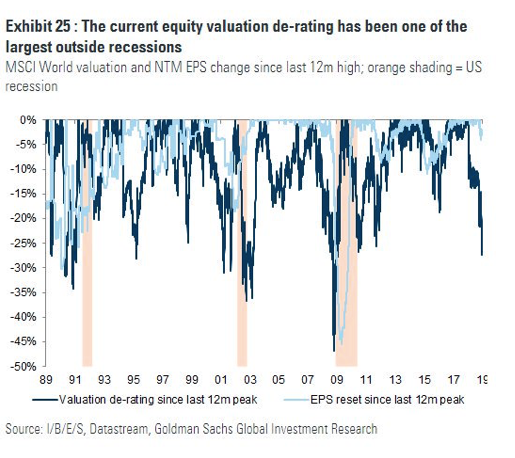
For one, there have been two massive accumulation days in the past week. Second, outflows from risk-seeking equity and credit funds and into safe assets has become the most extreme, by far, in the past 10 years. Third, the volatility index spike on Christmas Eve matches those near the lows in SPX following every major sell off since 2010. Fourth, the valuation de-rating is now the largest outside of a recession since 1994.
Nonetheless, when SPX drops 15-20% or more, it has a strong tendency to retest those lows in the weeks/months ahead.
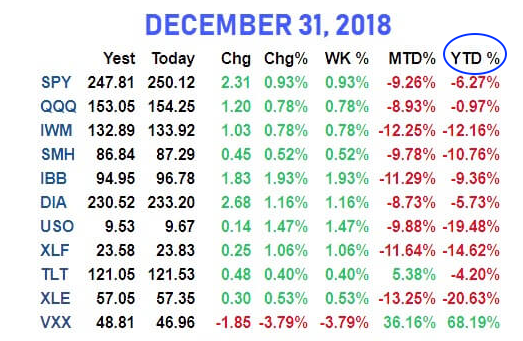
2018 ended with a thump. NDX lost 1%, SPX lost 6%, small caps lost 12% and financials (the consensus favorite a year ago) lost 15%. Treasury bonds also dropped for the year, as did commodities. The only winner in 2018 was volatility (table from alphatrends.net). Enlarge any chart by clicking on it.

From their ATH on September 20, SPX and the Russell 3000 (which represents 98% of US market cap) declined 20% into the low on Christmas Eve.
For the first time in 50 years, no major asset class registered a gain of even 5%. 2018 was the year nothing worked (from NDR).
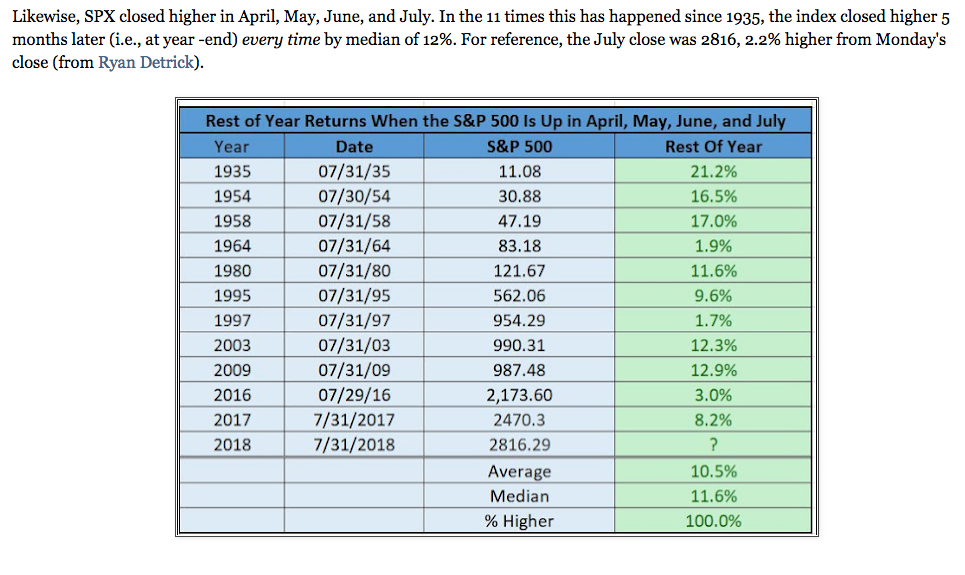
After gaining every month from April-July, SPX had ended the year higher every time since 1935, with an average gain of 11%. Instead, SPX ended this year 11% lower, another first (from Ryan Detrick).
There are many more examples like these using trend, breadth, sentiment, volatility and seasonality (see our Weekly Market Summary for details). To summarize, the past three months have been a pretty extreme outlier.
We had expected US equities to weaken from their highs in September (and then move higher), but subsequent events have been way outside of our expectations. This was a very low probability outcome, but, unfortunately, there are never any certainties in the equity market. We work with the most likely outcome and own the results. Over time, this process produces the best results for us.
2018 will likely be remembered as a year like 1987 and 1962: these years also had large drops outside the context of an economic recession. These are once in 20-30 year outcomes (from JPM).
(For better or worse, "bear markets" are most commonly defined as a high to low drop of more than 20% in SPX on a closing basis. Is it arbitrary? Yes. So is a cut-off of 15%, 19% or 25%. Thus, 1998 and 2011 don't strictly qualify. We don't make the rules).
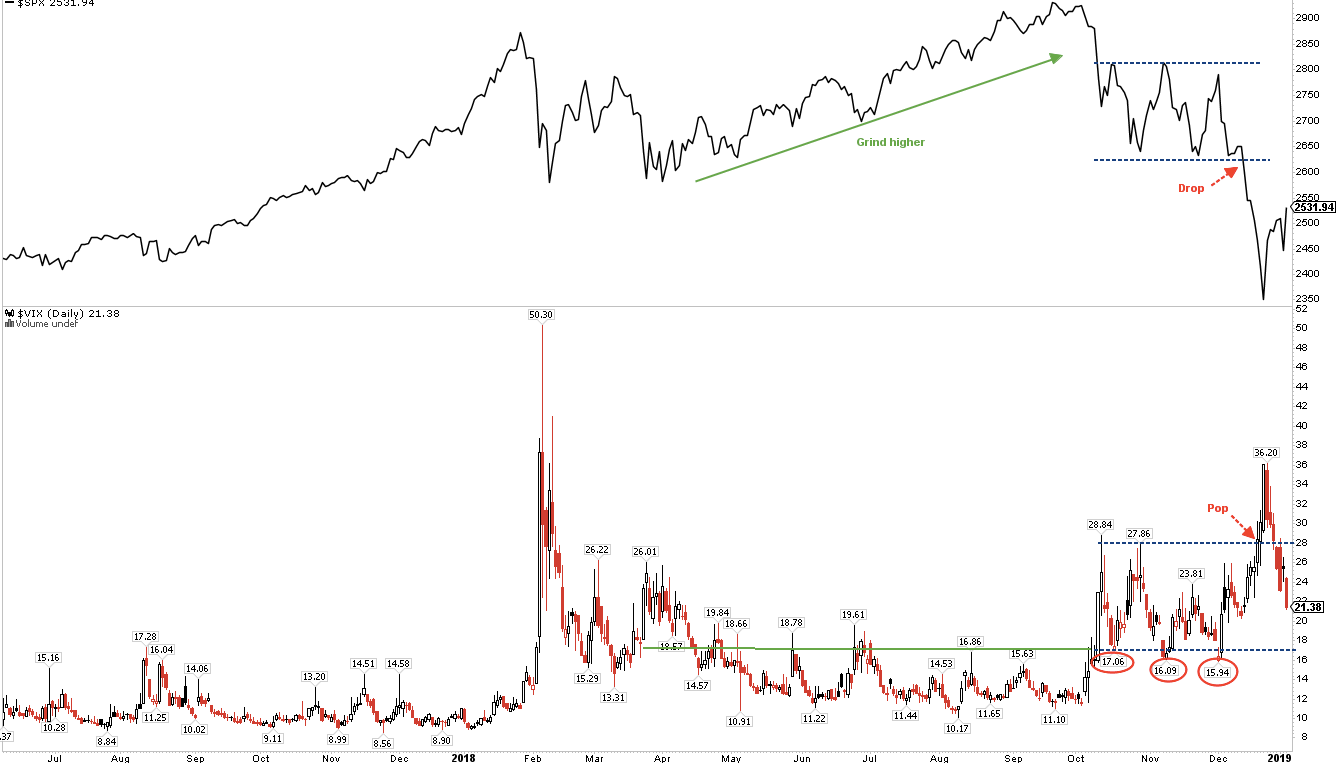
At the time of our last update, SPX appeared to be basing within a two month range (blue lines in the chart below). An intraday reversal on December 10 (red circle) looked like a false break of support, but this reversal failed 4 days later and SPX cascaded down 10% over the next 7 days.
The area of that failure is now 2-4% above Friday's close (green highlight). The 50-dma (blue MA) is at the top of this range; it's been resistance since the September high (green arrows). There are a lot of eyes on this chart; expectations are that prior support becomes resistance and the rally at least stalls (or outright fails) there. A move higher would therefore be noteworthy.
The next chart zooms in on the past two months (60 minute timescale). On December 19, a 2% daily gain turned into a 3% loss; the key reversal hour is circled. Friday closed at the bottom of this candle. There's a "cup and handle" forming, with a full measured move to 2700. Again, expectations are that any bullish move encounters resistance at the top of the candle and the green prior support zone.
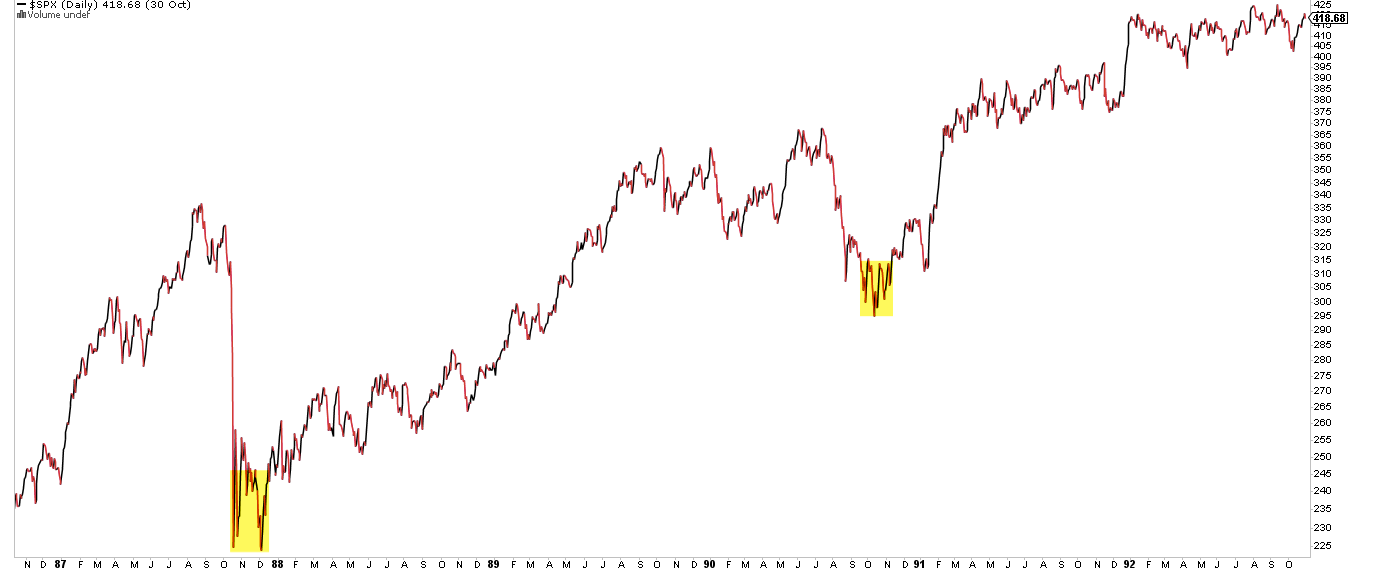
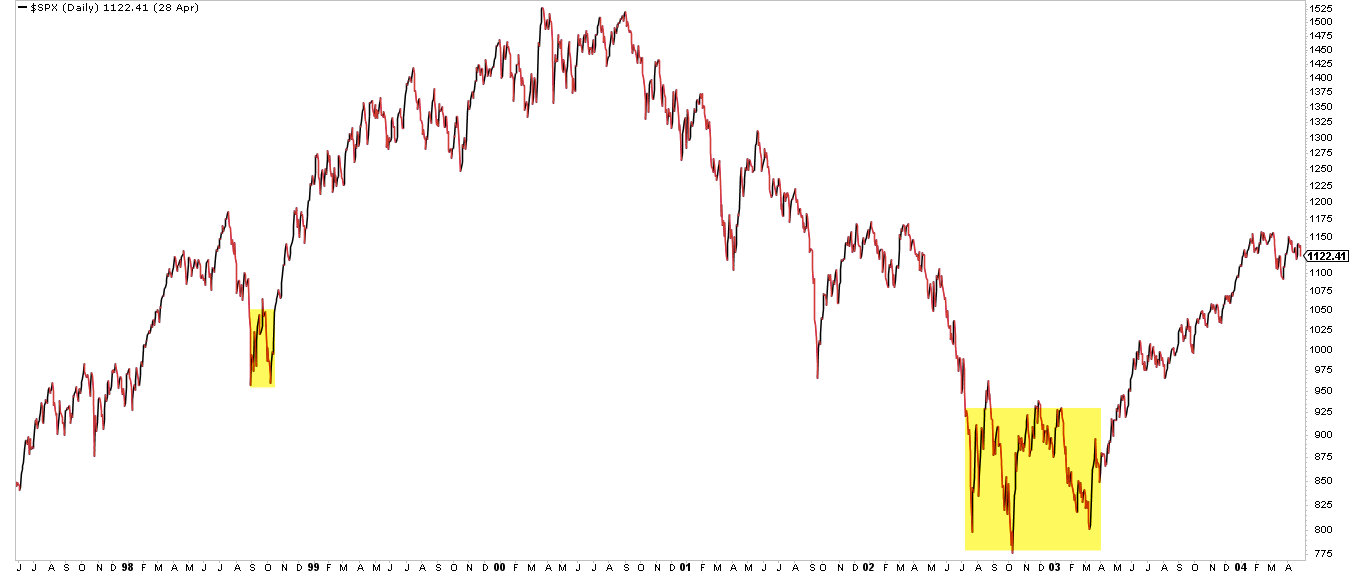
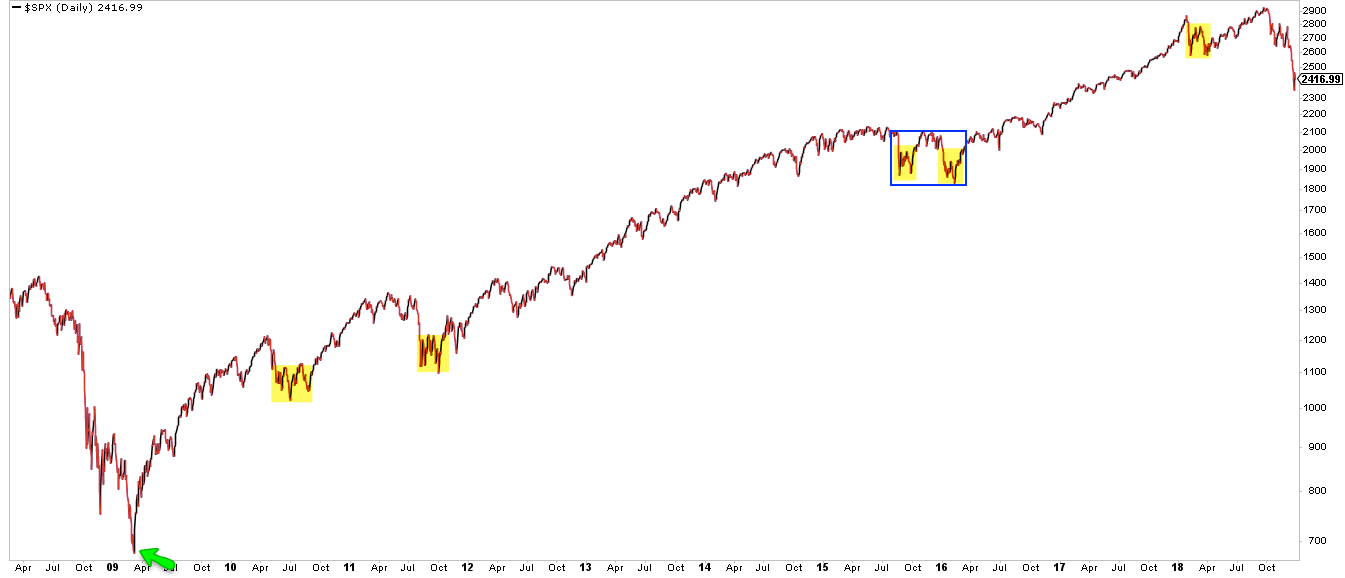
When SPX drops 15-20% or more, it has a strong tendency to retest those lows in the weeks/months ahead. Since 1980, there have been at least 10 of these periods and all but two formed a base at the low (i.e., a low retest) before moving higher (yellow highlights). The two exceptions (1982 and 2009) are hard to compare to the present as SPX fell 27% and 57% over 21 and 17 months, respectively. Momentum normally takes time to be reversed and the current drop is barely 3 months old.
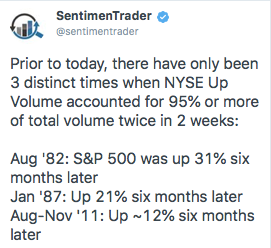
Similarly, SPX had four one standard deviation down days into Christmas Eve followed by a four standard deviation up day on December 26. That has only happened 3 times before, in 1962, 2002 and 2015 (a small sample). One year forward returns were very good but the low was retested in the months ahead each time (from NDR).
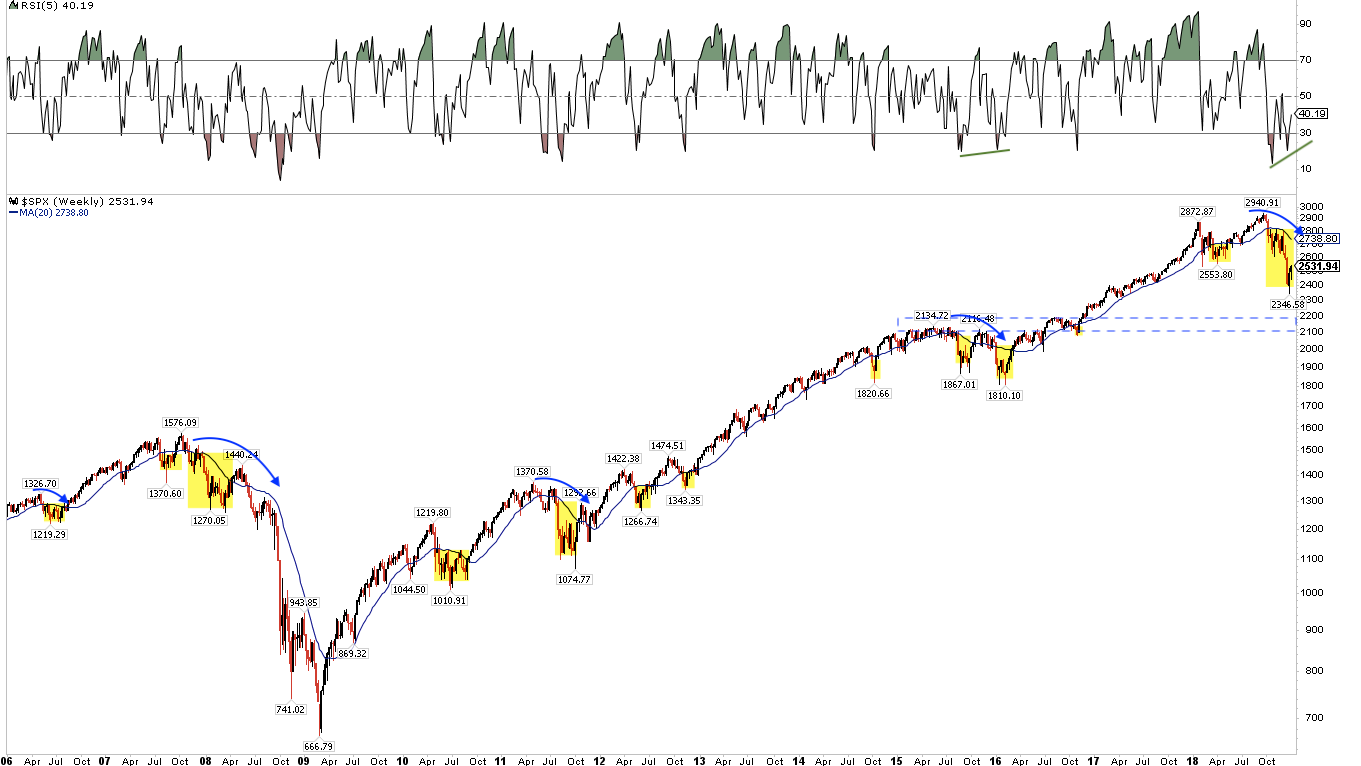
The 20-weekly MA (blue line) that we use delineate uptrends from downtrends is now at 2740. Equities are in a downtrend until that level is recaptured (yellow highlights). The 20-wma has rolled over (blue arrows); in the past, that has led to a more complex bottom, not one shaped like a V. If the Christmas Eve low is broken, SPX is probably headed to 2100-2200, the pre-election high and post-election low in 2016 (blue dashed box).
The rally over the past 7 days has been encouraging. SPX has gained almost 8%. But there were rallies at the beginning of November and December that gained a similar amount in the same amount of time that both failed. Follow through has been lacking.
We are very skeptical about the ability of companies to grow their earnings in 2019. Margins jumped a massive 260bp in just the past three quarters and sustaining that level (let alone expanding margins further) is too aggressive an assumption, especially in light of rising labor and interest expenses.
since 1994 Robin Wigglesworth
On the calendar this week: FOMC minutes on Wednesday and CPI on Friday (from IBD Investors).
© The Fat Pitch
Read more commentaries by The Fat Pitch