Summary: US equities are down 10% from their all-time highs just 5 weeks ago. The trend in equities has turned bearish, and that is not something that should be taken lightly. The evidence pointing to a major top being formed has further increased. But the set up for higher prices, at least before a significantly lower low, appears to be very strong. This is not a certainty, but it is a high probability.
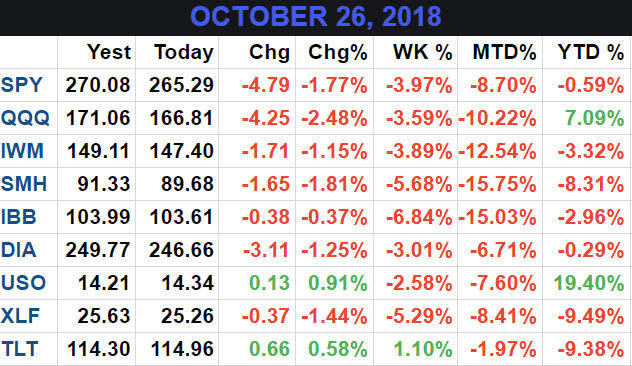
After falling 4% two weeks ago, and then closing a bit higher last week, US equities this week again fell 4%. They are down about 10% for the month of October. The nearly 10% gain in 2018 at the end of September for SPX is now all gone. Small caps have been hit the hardest and are now down 3% for the year (table from alphatrends.net). Enlarge any chart by clicking on it.

Our overall perspective has been that there was (1) solid near-term (next month) risk in equities but (2) that it was unlikely to be substantial or long lived, and (3) that new highs by year-end were very likely.
After falling a total of 7% by two weeks ago, we made two conclusions: (1) that the selling was not over and a lower low was likely before a sustained rally, and (2) that investors' bias should be for higher prices in the weeks/months ahead.
The fall in equities in the past month was much more than we expected. There is still a lot of downward momentum and the bottom may still not be in.
Why was the rapid fall more than expected (at least by us)?
SPX fell 10% in February this year. It's down 10% since its all-time high (ATH) in September. Two falls of 10% from an ATH in one year has only happened once since 1960 (in 1990; data from Josh Brown). It's an exceptionally rare event.
When SPX has been in an uptrend (defined as above the 12-month ma), SPX has fallen more than 9% in one month two times in one year only 3 other times: in 1980, 1990 and 2000 (yellow highlights). There was a recession and a bear market within a year each time (data from Steve Deppe).
2007 and 2018 are also circled in the chart above. The sequential drops of 10% didn't take place in one month or in one year in 2007, but the significance is the same. Markets weaken before they reverse, and major tops are typically defined by increased volatility and a loss of momentum. We detailed this two weeks ago. SPX seems to be making the same pattern again now.
There are several more ways to describe how rare the events over the past month have been.
Daily volatility is in some respects the most extreme in one month since 1963.
Stocks have fallen 15 days in October, the highest proportion since 1970 (data below from Ryan Detrick).
Moreover, SPX has not risen on two consecutive days in more than 5 weeks; since the 1930s, this has happened less than 10 times, and in the last 30 years it has happened only 3 times (data from Sentimentrader).
These are exceedingly rare events; their historical odds are small.
The rapid fall has pushed weekly momentum (RSI; top panel) over the past 5 weeks to under 14. In the past 40 years, this has only happened during bear markets: 1981, 1987, 1990, 2001-02 and 2008. None of these happened within 5 weeks of an all-time high, which is the case this time. SPX subsequently continued lower each time, although in 1981 and twice in 2001, SPX jumped 11%, 12% and 19% within two months (table below from Troy Bombardia).
Seasonality typically turns positive into the mid-term elections, but this month is the worst mid-term October since 1978 and the second worst since 1930. In the 22 mid-term Octobers since 1930, SPX has closed higher than a loss of 3% in 91% of all instances. This year is in the small minority. If you are looking for a silver lining, after October 1978, SPX rose 9 of the next 11 months by 17%.
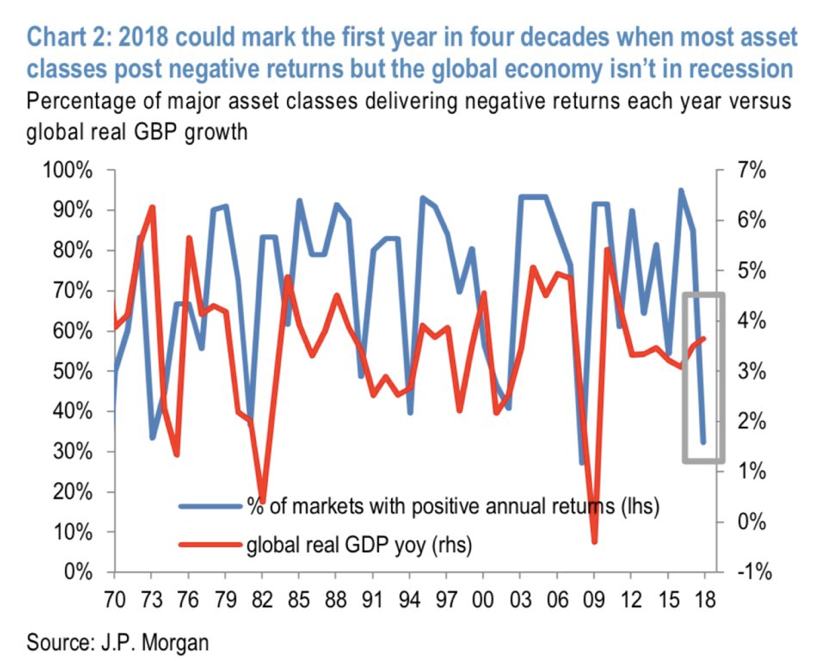
The broad weakness in equities is taking place within the context of a global economy that is in expansion, which hasn't happened in four decades (from JP Morgan).
So what happens next?
We can't ignore what's happened in the past month. SPX had formed a topping pattern even before October had started, and falling 10% this month only strengthens that pattern. The rapid loss of momentum in the past 5 weeks has only happened in bear markets, and in each case stocks continued lower, although it wasn't always right way. These are bearish developments.
Unlikely events happen. There are never any certainties. The Red Sox lead the Dodgers 3 games to 1. The historical odds of the Red Sox winning the World Series are 90%. This is a very high likelihood. But recall that the Chicago Cubs trailed the Indians 3 games to 1 in 2016 and then won all 3 of the remaining games to become champions. It was a low probability event but they do happen.
Our guess is that the bull market has not ended, that new highs are still ahead. Our recent posts highlight an abundance of data supporting that view. Instead of repeating ourselves. The odds are very high but it's not a certainty. That is never the case.
But the current topping pattern, together with creeping weakness in the housing market and the escalating trade war, implies a looming end to the bull market, maybe by the middle of 2019.
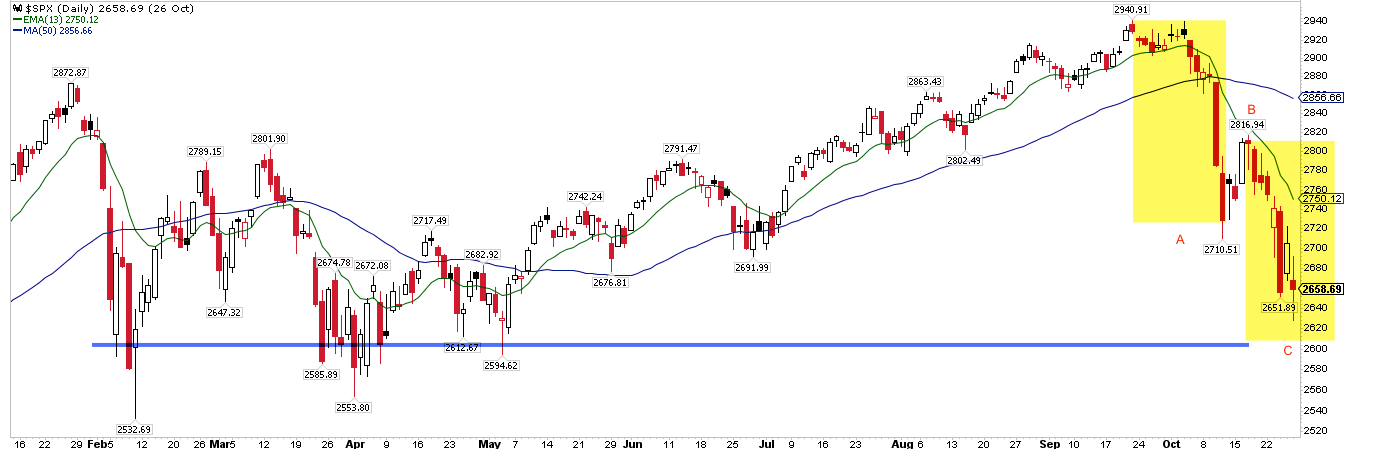
We had expected the 2700 area to hold as the low this month. It did not, and this opens the possibility of a low below 2600 where SPX bottomed in February, April and May. This 2.5% below current levels. But the next big move is more likely to be to the 50-dma (solid blue line) - this almost always gets backtested after a rapid fall, as it did in February - which is 7.5% higher.
The correction is so far tracing out an ABC pattern; the textbook target low, where A and C are equal (yellow highlights), is also near 2600. This level is weekly S1 this coming week.
Breadth has washed out and investors are in panic mode. The Fear & Greed index closed at 6 on Thursday. In the past 20 years, SPX has subsequently gained 86% of the time over the next month by a median of about 4%.
Many other sentiment measures are similar. The DSI for SPX dropped to 10 this week. That was followed by 8% and 6% rallies in the next month after similar DSI levels in February and April, respectively (chart from Thomas Thornton).
Similarly, the Quantifiable Edges Capitulative Breadth Index (CBI) closed at 10 on Wednesday. Since 1995, SPX has closed higher 95% of the time over the next month by an average of more than 5%.
A week ago, $17.5b flowed out of global equity mutual funds and ETFs. This is exceptionally large. The arrows in the chart below show similar outflows since 2010 (there were no equally large fund outflows prior to 2010). It doesn't always mark the exact low, but all of these were followed by a period of solid equity strength and attractive risk/reward.
The confidence of "dumb money" (don't get hung up on the name; this is shorthand for extremes in the equity-only put/call ratio, outflows from index funds, and small speculators' activity in equity index futures contracts) hit a low last week equal to that at the equity bottom in early 2016. In the past 20 years, SPX has risen 4% and 5% in the next 1 and 2 months, respectively, with a win-rate of 85% (from from Sentimentrader).
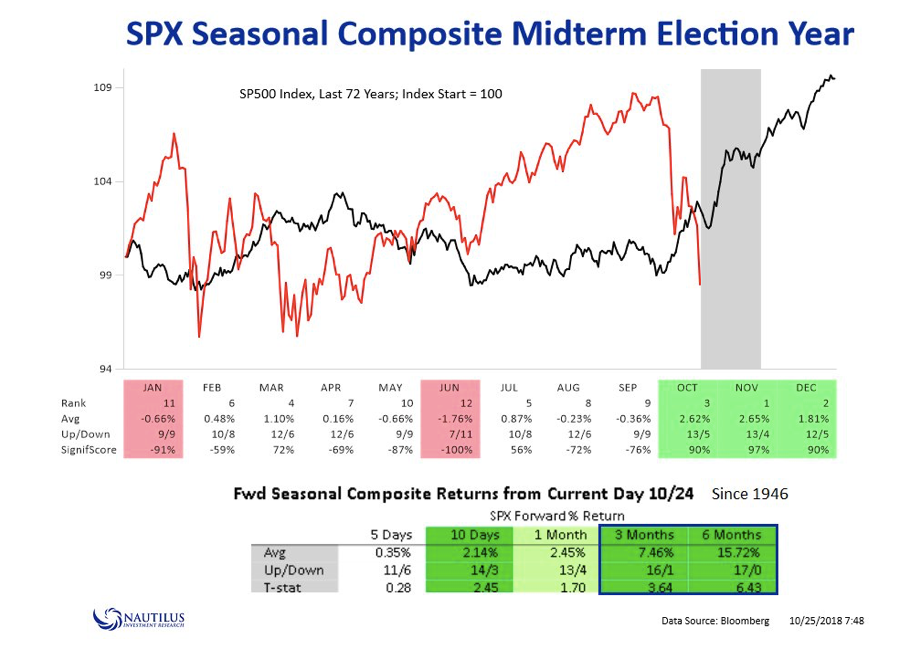
The swing to seasonal strength should be a further tailwind. During mid-term years since 1946, SPX has gained over the next 3 months 94% of the time by an average of 7.5% (from Nautilus Research).
SPX's returns after a more than 5% drawdown from a 52-week high is typically much stronger than it is otherwise. In the past 20 years, SPX has gained 3 times as much in the next 3 months and been higher 85% of the time (also from Nautilus Research).
Similarly, when SPX falls 10% in a month, it has been higher 94% of the time by a median of 5.6% 4 months later. Over the next 12 months the median draw-up has been 23%, more than 3 times greater than the median drawdown (table from Steve Deppe).
Moreover, there have been 7 other years since 1950 that were positive going into October and then lost all those gains during the month. November and December were positive in 6 of the 7 instances with an average gain of 4% (data from Ryan Detrick).
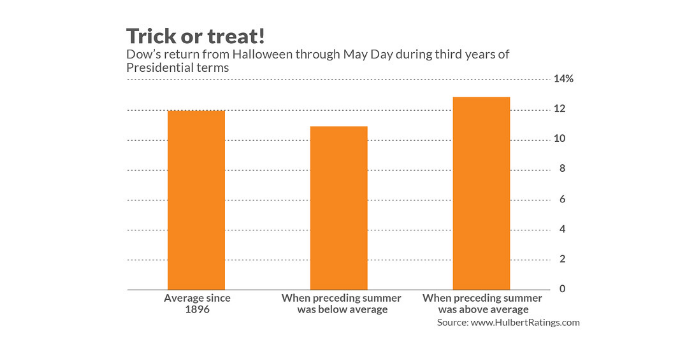
The equity returns over the next 6 months (when stocks typically rise) have averaged 12%. Those returns have been strong regardless of whether the preceding 6 months were weak (like this year) or strong (from Mark Hulbert).
US equities are down 10% from their all-time highs just 5 weeks ago. The trend in equities has turned bearish, and that is not something that should be taken lightly. The evidence pointing to a major top being formed has further increased. But the set up for higher prices, at least before a significantly lower low, appears to be very strong. This is not a certainty, but it is a high probability.
On the calendar this week: PCE on Monday, ECI on Wednesday and NFP on Friday (from IBD Investors).
© The Fat Pitch
Read more commentaries by The Fat Pitch