We Could See $100 Oil Again Soon, But Not for the Reason You Think
Membership required
Membership is now required to use this feature. To learn more:
View Membership Benefits
According to a recent Cornerstone Macro report, the three most influential macro trends this year have been 1) the strengthening U.S. dollar, 2) the flattening yield curve and 3) slowing global manufacturing expansion. I’ve written about all three topics numerous times this year, but the one I’ve watched the most closely has been global manufacturing, as measured by the purchasing manager’s index (PMI). Since its 12-month high of 54.5 in December 2017, the PMI has declined in eight of the past nine months. September marked the fifth straight month of slower manufacturing growth.
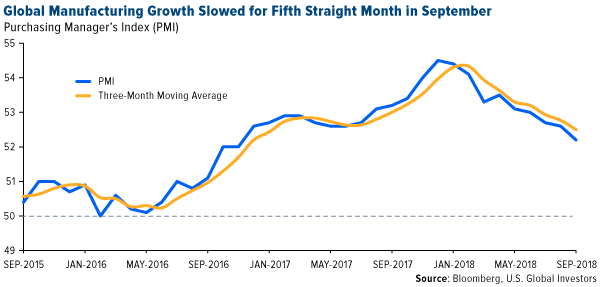
This matters because the PMI is a useful, forward-looking indicator of the economic health of the manufacturing sector, which accounted for around 15.6 percent of global gross domestic product (GDP) in 2016. Our research has shown that the index can be used to forecast world demand for materials and energy one, three and six months out, with a reasonable measure of accuracy.
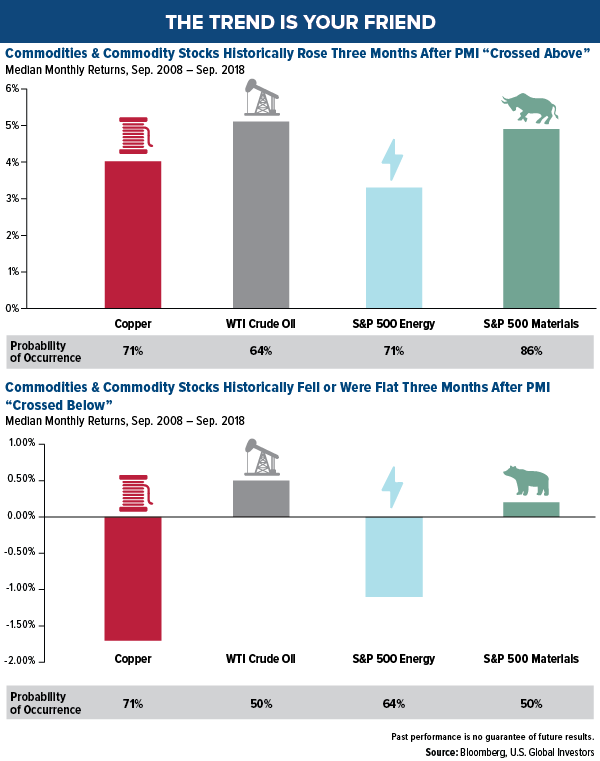
Take a look below. The chart shows that, based on 10 years’ worth of data, copper and West Texas Intermediate (WTI) crude, as well as energy and materials equities, all benefited in the three months after the PMI crossed above its three-month moving average. WTI saw the biggest jump; 64 percent of the time, it gained 5 percent on average.
Conversely, in the three months after the PMI crossed below its three-month moving average, those same assets either fell or were effectively flat. Seventy-one percent of the time, copper lost a little over 1.5 percent on average when manufacturing growth began to slow.
Energy Up, Materials Down
 |
So how accurate has the PMI been so far this year? The index crossed below its moving average in February, and since then, materials have predictably failed to gain traction. The S&P 500 Materials Index is down about 6 percent, while copper prices are off 13 percent on fears that demand in China, the world’s largest consumer of the metal, is shrinking. (Australian miner BHP Billiton reported this week, however, that it believes Chinese copper consumption is actually set to increase substantially, by as much as 1.6 million metric tons, between now and 2023, thanks to its ambitious Belt and Road Initiative (BRI)).
Crude oil and energy stocks, on the other hand, have fared very well on tightening supply in Venezuela and Iran, the latter of which is scheduled to face a new round of U.S. sanctions effective November 4. Since February, WTI prices have surged 13.6 percent and are now at four-year highs, while the S&P 500 Energy Index is up 2.7 percent. Oil traders are now betting that crude could rise to as high as $100 a barrel by next year, Reuters reports.
Does oil’s outperformance, despite a steadily cooling PMI, mean our research is flawed? Hardly. The index, remember, only tells us the probability that a price change will occur. Extraordinary government policies, such as the U.S. reimposing sanctions on Iran, must also be taken into consideration. If the PMI alone were 100 percent accurate 100 percent of the time, we would all be multibillionaires from betting on the winners every time. Sadly, that’s not the case.
Could We Reach “Peak Oil” Sooner Than Anticipated?
But back to $100-per-barrel oil. Not only are traders betting on a return to these prices, but banks are also baking it into their forecasts. In a note this week, HSBC said it sees “real risks of this happening” by 2020, adding that “there are clear signs of falling exports and builds in Iranian exports. We would expect to see much more tangible signs of falling exports ahead of the November cut-off.”
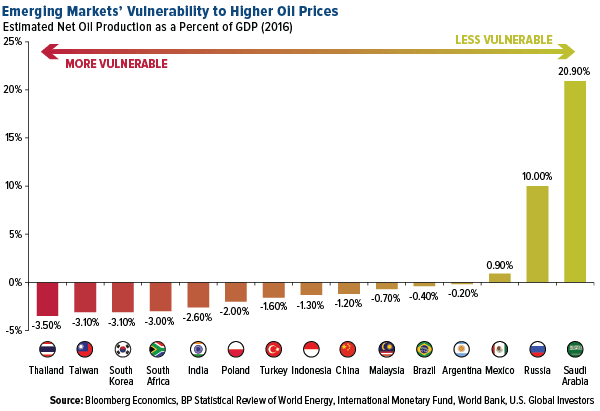
So how will this affect the global economy? It shouldn’t come as a surprise that net import countries would be most impacted by higher fuel costs. Among the emerging markets Bloomberg Economics estimates would feel the greatest pain are Thailand, South Korea, South Africa and India. Conversely, the economies that stand to benefit the most from rising oil prices are Mexico, Russia and Saudi Arabia.
Even higher prices could become a reality as soon as the next decade if world supply continues to tighten. Energy and mining research firm Wood Mackenzie (WoodMac) recently issued a warning that not enough oil discoveries are being made to replace capacity. “We need more Guyanas, a lot more, and we need them soon,” WoodMac chairman and chief analysts Simon Flowers urged, referring to the massive find made in the South American country early last year.
Spending on exploration collapsed following the price crash in 2014, which has propelled the world closer to “peak oil” much sooner than anticipated.
“The oil market could be running short of oil capacity by the late-2020s at the current low discovery rate,” Flowers said. “That’s worryingly near at hand given it takes the best part of 10 years for the average new discovery to build to peak production.”
The supply gap, according to WoodMac, could reach 3 million barrels per day (b/d) by 2030, 9 million b/d by 2035 and a “formidable” 15 million b/d by 2040.
A Promising New Copper Discovery
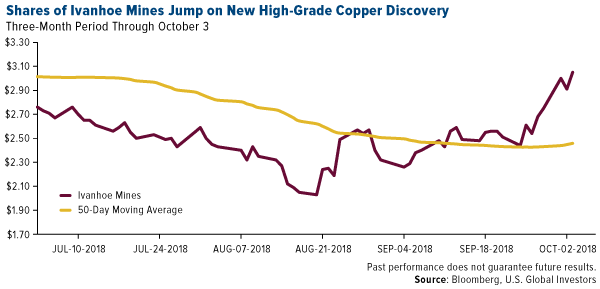
Speaking of new discoveries, I want to congratulate my friend Robert Friedland, founder and executive chairman of Ivanhoe Mines. The Canadian copper mining company announced this week the “important new discovery” of the metal on its 100 percent owned Western Foreland property in the Democratic Republic of Congo (DRC). Makoko, as it’s called, is Ivanhoe’s third major find in the DRC, following Kamoa-Kakula, which WoodMac has called the world’s largest, undeveloped, high-grade copper discovery.
After Monday’s announcement, shares of Ivanhoe popped 9 percent on the Toronto Stock Exchange.
In the press release, Robert chalked the find up to “the accumulation of in-depth, proprietary geological insights gained by Ivanhoe’s exploration team during nearly two decades of exploring in the region.”
“Given the early drilling success at Makoko,” he added, “we are highly confident that we have the secret blueprint for additional exploration successes in the Western Foreland area in 2019 and beyond.”
Earlier this year, Robert visited our office and said that by 2021, “you’re going to need a telescope to see copper prices.” China’s BRI, as I mentioned earlier, is expected to boost demand dramatically as scores of new power plants and electrical grids come online. The Asian giant has also joined several other countries in requiring that electric vehicles (EVs) replace gas-powered ones over time. EVs need three to four times as much copper as traditional vehicles do.
With copper prices down close to 16 percent for the year, now might be an ideal buying opportunity.
Poland Adds to Its Gold Reserves. Should You?
Stocks sold off more sharply today and yesterday than we’ve seen since late June, with the S&P 500 Index sliding below its 50-day moving average. The unemployment rate fell to 3.7 percent, its lowest level in nearly half a century, convincing many investors that the Federal Reserve will now begin to raise rates more aggressively in an effort to prevent the economy from overheating.
As I’ve shared with you before, all but three recessions of the past 100 years were preceded by a rate hike cycle.
Meanwhile, the trade dispute between the world’s two largest economies doesn’t appear to be abating anytime soon. Now that President Donald Trump has succeeded in rebooting NAFTA—provided it gets ratified by Congress—he’s likely to turn up the heat on Beijing. Some analysts predict the U.S. will eventually max out tariffs on all Chinese imports. J.P. Morgan now forecasts a “full-blown trade war” as its “new base case scenario for 2019.”
The U.S. economy is humming along robustly, but it’s better to prepare for the next downturn while the bull is still running than after it’s crashed into a wall. This week I spoke with Daniela Cambone of Kitco News and explained the reasons why I’m bullish on gold, including Vanguard’s decision to slash its exposure to metals and mining, and the recent Barrick Gold-Randgold Resources merger deal.
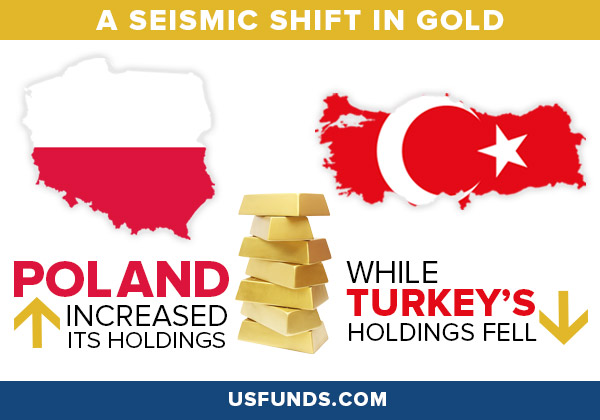
During the interview, I also discussed the news that Poland purchased gold this summer at a pace not seen in 20 years. The Eastern European country, which was just upgraded to a developed market, added nine metric tons to its gold reserves in July and August, the most since 1998, and the most by any European Union country in the past two decades. Speaking with Bloomberg, mBank senior economist Marcin Mazurek said the Polish central bank’s decision was likely based on diversification, “combined with the expectation for higher global inflation.”
You can watch my full interview with Daniela Cambone by clicking here.
Index Summary
- The major market indices finished down this week. The Dow Jones Industrial Average lost 0.04 percent. The S&P 500 Stock Index fell 0.97 percent, while the Nasdaq Composite fell 3.21 percent. The Russell 2000 small capitalization index lost 3.80 percent this week.
- The Hang Seng Composite lost 4.17 percent this week; while Taiwan was down 4.44 percent and the KOSPI fell 3.22 percent.
- The 10-year Treasury bond yield rose 17 basis points to 3.232 percent.
Domestic Equity Market
Strengths
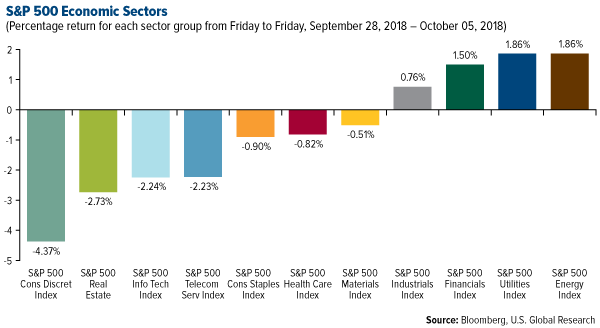
- Energy was the best performing sector of the week, increasing by 1.86 percent versus an overall decrease of 0.84 percent for the S&P 500.
- General Electric was the best performing stock for the week, increasing 16.74 percent.
- Upwork soared in its trading debut, with shares gaining as much as 57 percent in its Nasdaq opening. The stock finished the day up 41 percent at $21.18 a piece.
Weaknesses
- Consumer discretionary was the worst performing sector for the week, decreasing by 4.37 percent versus an overall decrease of 0.84 percent for the S&P 500.
- IPG Photonics was the worst performing stock for the week, falling 14.94 percent.
- Super Micro Computers crashed after a report said it sold data servers compromised by Chinese spies. Shares plunged 41 percent after a Bloomberg report said Chinese spies implanted tiny chips in some of the company's server motherboards that ended up being sold to firms including Amazon and Apple.
Opportunities
- Square is expanding its lending services by bankrolling merchants to let them extend credit to shoppers. The company will extend credit to customers of merchants for purchases between $250 and $10,000 through its consumer-side lending service "Square Installments," Reuters reported.
- YouTube TV is rolling out several new features to woo customers away from cable TV. On Thursday, YouTube TV introduced a host of functions that improve the user experience of the subscription streaming service and enhance its DVR capabilities.
- China's biggest music streaming service has filed for a U.S.-listed initial public offering (IPO). Tencent Music, the service backed by tech giant Tencent, could fetch a valuation of more than $25 billion, making it one of the biggest tech IPOs ever.
Threats
- Snap fell below $8 a share for the first time. Shares fell as much as 7.8 percent on Thursday after Evercore analyst Anthony DiClemente said Instagram was "irreversibly" hurting the company.
- Blue Apron fell to a record low this week. Shares hit $1.44 on Tuesday after the meal kit maker said it was launching a pilot program for on-demand delivery in New York City on Grubhub and Seamless online and mobile platforms.
- The owner of MoviePass just freed up room to sell more stock. Helios & Matheson reached an agreement with creditors that would reduce the number of shares it needs to set aside for notes it issued that can be converted into stock, potentially paving the way for more share sales. The MoviePass parent has increased its share count by 80,000 percent since July.
The Economy and Bond Market
Strengths
- The unemployment rate dropped to a level not seen in nearly 50 years, according to Labor Department figures released Friday. The rate fell two-tenths of a percentage point to 3.7 percent, the lowest level since December 1969 and one-tenth of a percentage point below expectations.
- Last month, the U.S. services sector expanded at its fastest pace on record, according to data released Wednesday by the Institute for Supply Management. The ISM non-manufacturing index rose to 61.6 in September, the highest level since the index was created in 2008. Economists had only expected the index to hit 58 according to CNBC.
- The closely watched average hourly earnings component showed a 2.8 percent year-over-year increase, in line with Wall Street estimates.
Weaknesses
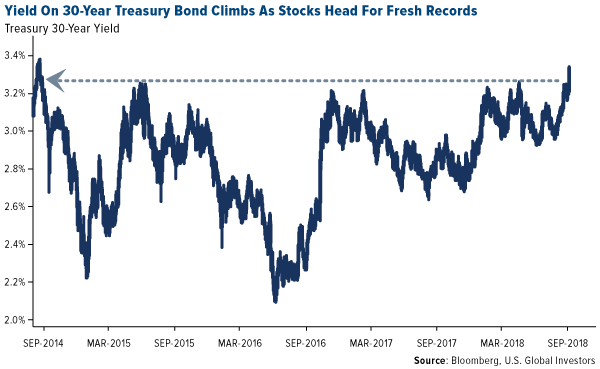
- Borrowing costs have jumped worldwide as investors anticipate faster U.S. interest-rate increases amid continued economic growth. The yield on the 30-year Treasury bond hit its highest since September 2014, while that of the benchmark 10-year note reached the highest since July 2011.
- Job creation for September fell to its lowest level in a year, according to Labor Department figures released Friday. Nonfarm payrolls rose 134,000, the worst performance since last September and well below estimates of 185,000.
- Vice President Mike Pence made pointed allegations against China during a speech on Thursday, accusing the foreign power of targeting the American political system. Pence laid out the alleged measures Beijing is employing to undermine the Trump administration, including public steps such as targeting Chinese tariffs to industries in states that are crucial to Trump in the midterms as well as behind-the-scenes actions like coercing U.S. businesses to speak out against the Trump administration and intimidating scholars. The unusually expansive and aggressive criticism of Beijing by a senior U.S. official indicated that Washington could be preparing to take a more confrontational approach with China on issues beyond just the trade dispute.
Opportunities
- Inflation gauges will be the primary U.S. data release next week. The 12-month rate of consumer price index (CPI) is expected to have risen by 2.4 percent in September, edging down from the prior 2.7 percent. However, the core CPI index is anticipated to tick higher by 0.1 percentage points to 2.3 percent year-on-year.
- The only major non-inflation data next week will come from the University of Michigan’s preliminary reading of the consumer sentiment index for October. It is forecast to remain at elevated levels.
- President of the European Central Bank Mario Draghi described the increase in underlying inflation as “relatively vigorous” in the most recent European Parliament hearing. An account of the ECB’s September policy meeting is due on Thursday and may contain signs on why policymakers are becoming more confident about the Eurozone’s inflation outlook.
Threats
- Prices and input costs have been rising with consumer price inflation hovering around the Federal Reserve’s 2 percent inflation target. Indications are that core inflationary pressure may continue to rise as the economy grows further and import tariffs filter through. While this steady rise in prices doesn’t necessarily indicate spiraling inflation, it does translate into reduced disposable income, which is a potential restraint on economic growth.
- Rates for home loans moved sideways in the most recent week. However, the swelling bond market sell-off will likely hit mortgages in the coming weeks, setting up another test for a strained housing market.
- With the U.S. administration announcing that China tariffs would rise to 25 percent on January 1 and cover all imports from China in the case of retaliation, it appears further trade war escalation is likely.
October 5, 2018Signs It's Time to Get Bullish on Gold |
October 5, 2018Many Signs Point to a Gold Price Bottom |
October 3, 2018U.S. Global Investors Continues GROW Dividends |
|||
Gold Market
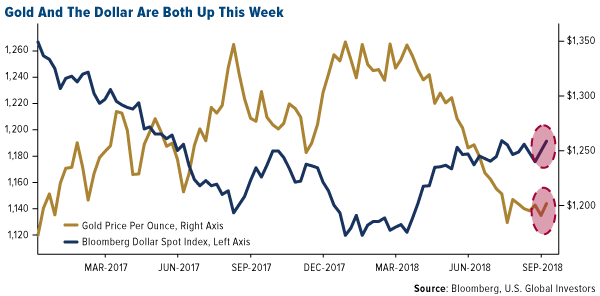
This week spot gold closed at $1,203.22 up $10.72 per ounce, or 0.90 percent. Gold stocks, as measured by the NYSE Arca Gold Miners Index, ended the week higher by 0.62 percent. Junior-tiered stocks underperformed seniors for the week, as the S&P/TSX Venture Index was down 0.49 percent. The U.S. Trade-Weighted Dollar rose 0.54 percent this week.
| Date | Event | Survey | Actual | Prior |
|---|---|---|---|---|
| Sep-29 | Caixin China PMI Mfg | 50.5 | 50.0 | 50.6 |
| Oct-1 | ISM Manufacturing | 60.0 | 59.8 | 61.3 |
| Oct-3 | ADP Employment Change | 184k | 230k | 168k |
| Oct-4 | Initial Jobless Claims | 215k | 207k | 215k |
| Oct-4 | Durable Goods Orders | 4.5% | 4.4% | 4.5% |
| Oct-5 | Change in Nonfarm Payrolls | 185k | 134k | 270k |
| Oct-10 | PPI Final Demand YoY | 2.7% | -- | 2.8% |
| Oct-11 | CPI YoY | 2.4% | -- | 2.7% |
| Oct-11 | Initial Jobless Claims | 210k | -- | 207k |
| Oct-12 | Germany CPI YoY | 2.3% | -- | 2.3% |
Strengths
- The best performing metal this week was gold, up 0.90 percent. Gold traders and analysts maintained their bullish outlooks this week amid bets that the gold selloff has passed, according to the weekly Bloomberg survey. In a big surprise, the yellow metal is headed for a weekly gain and so is the U.S. dollar. While the assets historically move in opposite directions, they are both headed up. Gold is performing well despite the dollar’s gains and as U.S. Treasury yields climb. Bloomberg’s Ranjeetha Pakiam writes that investors might now be mindful of warnings from prominent money managers, such as Ray Dalio, that soaring debt levels could trigger the next financial crisis.
- Poland added nine metric tons of gold to its reserves in July and August, marking the country’s largest purchase since 1998. This is also the largest addition to gold reserves of a European Union nation in 20 years. The Perth Mint released strong September data on gold coin and bar sales. Last month they sold 62,552 ounces of gold, which is far greater than August sales of 38,904 ounces, and is the largest sales jump since January 2017. Sales of silver products more than doubled from August to 1.3 million announces in September, reports Bloomberg.
- More positive news continues from the Perth Mint. The precious metal seller has introduced a mobile app enabling investors to buy, sell and store bullion via digital certificates. CEO Richard Hayes says that the app “will certainly be aimed toward the younger investor, be they millennials or perhaps a little bit older.” The app will allow transfers of gold to other users and digital certificates for physical gold or cash can be redeemed.
Weaknesses
- The worst performing metal this week was silver, down 0.39 percent. According to Bloomberg, BullionVault’s gold index that measures the balance of buyers against sellers decreased to 55 in September, down slightly from an August reading of 50. A reading above 50 indicates more buyers than sellers among clients. However, their silver index rose to a seven-month high of 54.3, up from 53.9 in August, as the metal rose in September. Turkey’s central bank continues to sell off gold reserves in an effort to support the struggling lira. Reserves fell $166 million from the previous week, marking a decline of 14 percent year over year.
- The Bank of Nova Scotia has been ordered to pay a fine of $800,000 by the Commodity Futures Trading Commission after self-reporting that traders were found to have placed fake orders for gold and silver futures contracts, commonly known as “spoofing”. Bloomberg writes that spoofing is a practice where a trader attempts to push the price of contracts up or down and the incidents of this at the bank occurred from at least June 2013 through June 2016. By self-reporting the misconduct, the bank received a significantly reduced fine.
- Although Centamin PLC had strong gold production in the past quarter, a 27 percent increase, the company lowered overall 2018 guidance for a second time this year and the stock fell 12 percent on Friday.
Opportunities
- Goldman Sachs economists released three reasons to buy gold right now after this year’s selloff. Firstly, they forecast emerging market growth stabilization and maintain a constructive outlook on emerging market currencies. Secondly, they view the recent gold ETF and CFTC net specs liquidation as a one-off cleaning up on speculative positions. Thirdly, they view the rising interest rate environment as not necessarily bearish for gold, as many believe. Others are bullish on gold too as Tai Wong, head of base and precious metals trading at BMO Capital Markets, said this week that “there’s no appetite to sell gold from current levels” as gold heads for a gain amid a stronger dollar.
- Budget turmoil in Italy this week led to boosted gold and silver demand with volumes spiking on Tuesday. Bloomberg writes that in a span of 10 minutes, December gold contracts equaled almost 1.57 million ounces traded on the Comex, which is almost 12 times the 100-day average volume. This demonstrates renewed interest in gold during times of geopolitical uncertainty and marks gold’s biggest one-day climb in more than five weeks. Stephen Innes, head of Asia Pacific trading at Oanda Corp, said in a note that “shorts are being caught out on this one.” Russia disappeared from the list of major foreign holders of U.S. Treasuries earlier this year and might now be buying more Chinese yuan, according to the latest foreign reserve data from the IMF.
- Shandong Gold Mining could be setting up to buy some of Barrick’s assets as it has hired several banks to arrange a $300 million denominated bond issuance, according to Bloomberg. Shandong recently completed a $1 billion initial public offering (IPO) in Hong Kong. Americas Silver Corporation and Pershing Gold announced this week that they will be combining their businesses to create a low-cost precious metal growth company in the Americas. Another Nevada asset picked off before the North American senior miners awake from their slumber, yawning at the gold price. Deutsche Bank upgraded their recommendation on St. Barbara Ltd. to buy from hold.
Threats
- Bill Gross, prominent bond fund manager, tweeted on Wednesday that “Euroland, Japanese previous buyers of 10yr Treasuries have been priced out of market due to changes in hedge costs.” Bloomberg writes that Gross is referring to the falling cross-currency basis, which has driven U.S. 10-year yields to minus 0.06 percent for European investors and 0.09 percent for Japanese buyers who hedge against currency fluctuations. Gross said that a lack of foreign buying at these levels could likely lead to higher Treasury yields. A buyer of put options risked $2.5 million for a hedge against a rise in the 10-year yield to 3.6 percent expiring two days after the Fed’s December meeting.
- The whole world uses the U.S. dollar, but it could be falling out of favor and lose its dominance. Peter Coy of Bloomberg writes that there is a paradox at the heart of global finance whereby the U.S. share of the world economy has drifted lower for many decades, yet the dollar remains strong even in times of growing isolationism from President Donald Trump. There are signs of dollar pushback, such as president of the European Commission Jean-Claude Juncker saying that it is “absurd” that European companies buy planes in the dollar, versus their own currencies. Coy continues to write that “a slippage in the dollar could also be viewed as a symptom of U.S. isolationism.”
- Company executives have been guiding down earnings forecasts in a sign that peak earnings might be slowing. Bloomberg’s Lu Wang writes that “ever since Caterpillar Inc. mentioned a ‘high water mark’ in growth, Wall Street has been on alert.” Data shows that the number of S&P 500 companies saying that profits will trail analyst estimates outnumbered those saying they’ll beat them by a ratio of 8 to 1 in the third quarter, the most in Bloomberg data going back to 2010. Rising costs and weakening overseas demand could threaten to dampen the strong growth experienced for a time now. The brutal sell-off in technology stocks this week has pushed the front month VIX futures contract to a premium relative to the second-month contract. The backwardation of the VIX curve indicates that traders are concerned with the near-term outlook for equities.
October 4, 2018Industry Consolidation Could See Gold Rise |
October 3, 2018Minute with the Analyst: Meet Joanna Sawicka |
October 1, 2018Gold's Bottom Could Be Investors' Lost Treasure |
|||
Blockchain and Digital Currencies
Strengths
- Of the cryptocurrencies tracked by CoinMarketCap, the best performing for the week ended October 5 was Swarm, which gained 242.51 percent.
- According to a report from CoinDesk Korea, Min Byung-Doo, chairman of South Korea’s National Policy Committee, has called for the legalization of initial coin offerings (ICO), provided that a regulatory framework is established and enforced. Min said that he “does not want the ICO door closed completely” and that “fraud, speculation and capital laundering must be strictly prohibited.” Several bills have been proposed to provide a legal framework for cryptocurrencies and with chairman Min’s support, South Korea could be closer to passing legislation.
- Winding Tree, a blockchain-based travel distribution platform, announced on Thursday that it is partnering with Air France to reduce costs for passengers by cutting out intermediaries. “We are excited to join [Air France] in its goal and commitment towards becoming the leading airline in customer intimacy and we are excited to bring blockchain technology as the tool needed to achieve real innovation and enhanced customer satisfaction,” said Pedro Anderson, founder of Winding Tree. The company already has contracts with Lufthansa, Swiss Air, Air New Zealand and Eurowings, according to Coin Telegraph.
Weaknesses
- Of the cryptocurrencies tracked by CoinMarketCap, the worst performing for the week ended October 5 was SafeInsure, which lost 35.37 percent.
- Galaxy Digital Capital Management CEO Mike Novogratz told his audience at the Economist Finance Disrupted conference on Wednesday that he doesn’t expect bitcoin to break $9,000 this year, according to Coin Telegraph. While cryptocurrency prices skyrocketed in November 2017, Novogratz predicted on CNBC’s Fast Money that “Bitcoin could be at $40,000 at the end of 2018.” Since then, his expectations have cooled, revising his prediction to say cryptocurrencies and blockchain are “still five to six years away” from mass adoption.
- New Zealand’s Customs and Excise Act 2018 came into effect this week, giving customs officials the ability to fine travelers who refuse to hand over the “access information” for their cellphones according to Business Insider. The law states that “[I]f the person has no reasonable excuse for failing to comply…the person commits an offence, and is liable on conviction to a fine not exceeding $5,000,” roughly $3,400 USD. Officials are expected to have reasonable cause for suspecting criminal activity. However, some crypto-investors are concerned that bitcoin wallets discovered by “digital strip searches” could inadvertently lead to law-abiding travelers being treated as guilty until proven innocent of criminal activity.
Opportunities
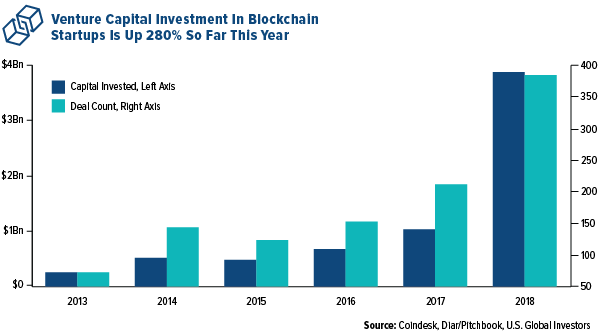
- Despite a decline in ICOs in the cryptocurrency industry, traditional venture capital (VC) investment is on the rise, reports Coindesk. In fact, according to blockchain research group Diar, startups in the industry have raised nearly $3.9 billion through VC investments in the first three quarters of the year and the number of deals also nearly doubled this year.
- Bitcoin had a relatively calm month of September. The popular coin traded in a range of just under $1,500 over the month – its narrowest monthly trading range since July 2017. CoinDesk writes that this lower volatility, coupled with low trading volumes, could signal that bitcoin is gearing up for a strong move in either direction.
- As many as 30 automatic teller machines (ATMs) with cryptocurrency trading capacity could be built in Argentina by year end, reports Reuters. Athena Bitcoin is a U.S.-based company that specializes in the creation of these crypto ATMs. “In Argentina, there were no commercial [bitcoin] ATMs and the idea was to be the first to capture the market,” said Dante Galeazzi, the operations manager for Athena Bitcoin in Argentina. A shopping mall in Buenos Aires gained the countries’ first bitcoin ATM in September, according to a company spokesperson.
Threats
- Gamers with bitcoin wallets need to be vigilant to avoid a real-world financial loss as a result of their hobby, according to Coin Telegraph. With 125 million active players, Fortnite is one of the most popular online games at the moment. On Tuesday, Malwarebytes, a cybersecurity firm, published a report stating that “con artists” were preying on Fortnite players, offering free in-game currency as well as other “bogus cheats, wallhacks and aimbots.” Inside the additional content, hackers hid malicious code that, when downloaded, stole data relevant to users’ bitcoin wallets.
- Venezuela’s oil-backed cryptocurrency – Petro – has reportedly plagiarized major elements from Dash. Although many cryptocurrencies share common bits of code, Petro includes Dash’s well-known masternode mechanism, as well as its X11 Proof-of-Work (PoW) mining algorithm and Instant Send system. On Tuesday, Joey Zhou, a core developer of Ethereum, tweeted an official whitepaper on Petro which included an exact copy of an image from Dash’s repository on Github, calling the state-owned crypto “a blatant Dash clone.” In August, Dash Core Group CEO Ryan Taylor announced that “Venezuela became our number two market [earlier this year] even ahead of China and Russia,” citing the devaluation of the bolivar as one explanation for Dash’s popularity. It remains to be seen how this state-sponsored plagiarism will impact either coin. Official sales of Petro are scheduled to begin on November 5.
- Seven officers from Russia’s Main Intelligence Directorate (GRU) have been charged by the U.S. Department of Justice (DoJ) for cryptocurrency-funded global hacking and related disinformation, writes Coin Telegraph. According to the DoJ press release published October 4, the officers are being charged on multiple counts of “computer hacking, wire fraud, identity theft and money laundering.”
Energy and Natural Resources Market
Strengths
- Natural gas was the best performing commodity, rising 4.72 percent for the week. The commodity outperformed as unusually frigid weather is expected to descend on the U.S. east coast, while record exports limit inventory build-up in preparation for the winter.
- The best performing sector for the week was the S&P 1500 Fertilizers and Agricultural Chemicals Index. The index rose 2.12 percent benefitting from a sharp rally in nitrogen fertilizer prices, spurred by rising natural gas prices in Europe, which increase input costs for certain market participants. It is expected North American peers would have wider margins as they have access to better priced gas.
- The best performing major natural resource stock for the week was Mercer International Inc. The downstream paper products producer rose 9.88 percent, hitting a 22-year high after announcing it is acquiring Daishowa Marubeni International, a Japanese peer. Numerous analysts agreed that the deal was highly accretive to Mercer shareholders.
Weaknesses
- Copper was the worst performing commodity for the week. The commodity dropped 1.55 percent mainly due to an escalation of the U.S.-China trade jitters. In addition, Goldman Sachs lowered its 2019 copper price forecasts, suggesting the copper market is not on the brink of a major deficit, as other market participants had suggested.
- The worst performing sector year-to-date is the S&P 1500 Paper & Forest Index. The index dropped 4.06 percent after Fed Chairman Jerome Powell suggested the rate hiking cycle will not slow down and that rates still have a ways to go. As a result, rate-sensitive sectors such as housing and its suppliers declined.
- The worst performing stock for the period was Peabody Energy Corp. The major coal producer dropped 1.98 percent after it reported a major fire at its North Goonyella Mine in Australia. Later reports suggest production at the mine may be halted at least until next year.
Opportunities
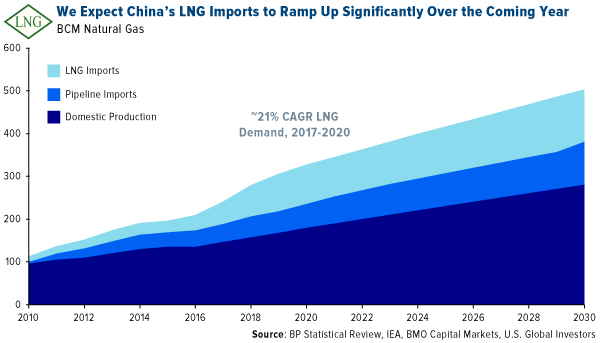
- The liquified natural gas market (LNG) is about to undergo a Chinese makeover, according to BMO commodity analysts. The report suggests trade volumes for the commodity are expected to rise, aided by China’s clear commitment to tackling pollution. BMO forecasts a bullish LNG uptake rate of 21 percent on an annualized basis over the next three years, implying China will overtake Japan as the world’s largest consumer of LNG by 2020.
- New records in two-way trade between China and Australia were set in August, suggesting the trade war with the U.S. may not reach global proportions. Australian exports to China have grown 15 percent year-to-August, highlighting an increase in fuel supply to China which seeks to replace U.S. oil and gas. Similarly, Australian imports from China hit an all-time high, highlighting the strength of the two-way trade.
- The U.S. economy should see a strong fourth quarter to cap a spectacular year led by strong capital expenditures support. Analysts at Cornerstone Macro suggest the ISM Manufacturing PMI reading of 59.8 for September showcases healthy domestic demand. In addition, they expect U.S. real capex growth to accelerate to nearly 9 percent by the fourth quarter of 2019, lagging the corporate tax cuts, and supporting the PMI and the economy.
Threats
- White House officials are betting that concluding a trade deal with Mexico and Canada will give them more ammunition to raise the stakes in its trade dispute with China, says Bloomberg. In particular, a liberalization of digital trade among the North American nations may weaken China’s position to produce next generation technology. Foreign companies may relocate production and research and design out of China and into countries friendlier to the U.S. and seek to trade from those locations.
- The bullish consensus on crude prices may be overstated, warns Tudor Pickering Holt. The broker’s analysts believe the global oil market is not as undersupplied today as time spreads indicate, suggesting market participants are accounting for Iran exports to remain depressed for an extended period of time. The brokerage house also warned that any further gains in crude prices may trigger a voluntary release by the U.S. Strategic Petroleum Reserve (SPR), thus capping prices in the short term.
- Iran may be nearing a deal to sidestep U.S. sanctions in its oil sales to Europe. Iran’s foreign minister, Mohammad Javad Zarif, said Tehran was closing in on terms to sell oil to European nations while avoiding the SWIFT system, and altogether avoiding violations of the U.S.-imposed sanctions. If true, a substantial amount of crude exports may be placed back on the market, upending the recent rally in crude prices.
China Region
Strengths
- In terms of relative strength for the week, Vietnam’s Ho Chi Minh Index fell only 76 basis points, while the FTSE Bursa Malaysia Kuala Lumpur Composite dropped only 89 basis points. Mainland Chinese markets were closed all week on holiday.
- Amid a risk-off week, telecom was the best-performing sector in the Hang Seng Composite Index, falling only 14 basis points.
- China’s official Non-Manufacturing PMI actually beat expectations, coming in at 54.9, ahead of analysts’ anticipated 54.0 reading and up from last month’s 54.2 print.
Weaknesses
- In a fairly ugly week for regional markets, India turned in the ugliest performance of all as the SENSEX and NIFTY indices fell 5.11 and 5.62 percent, respectively. Indonesia’s Jakarta Composite and Hong Kong’s Hang Seng Composite both tumbled more than 4 percent, and the rest of the region also closed down for the week. The Caixin China Manufacturing PMI dropped to 50.0, missing estimates.
- Information technology was the worst-performing sector for the Hang Seng Composite Index this holiday-shortened week, dropping 5.93 percent in trading since last Friday.
- Bloomberg News reported that Malaysian exports shrank 0.3 percent in August from a year earlier, surprising economists that had estimated growth of 8 percent. However, import growth accelerated to 11.2 percent, versus estimates it would slow.
Opportunities
- Singaporean companies have now made more than $91 billion in overseas transactions year to date, up 7.8 percent from last year and significantly higher than the global 2 percent average.
- South Korea is reportedly seeking exemptions from international sanctions on “various” projects with North Korea “in the event they are necessary,” according to Bloomberg News.
- U.S. Secretary of State Mike Pompeo will make a stop in Pyongyang over the weekend as part of a broader trip through East Asia. Pompeo is expected to meet with North Korean leader Kim Jong Un, with more discussion about a possible war-end declaration reportedly on the table.
Threats
- Trade war concerns remain central as the U.S.-China spat deepens, and as media reports this week revealed a Chinese microchip hardware hack affected a large number of American companies and products.
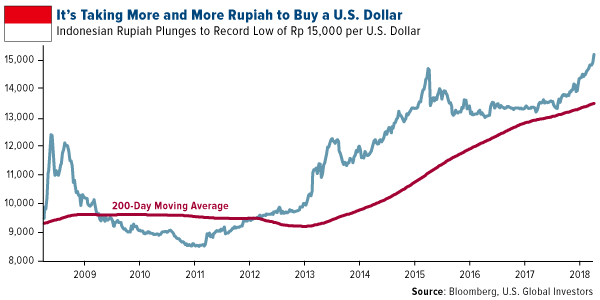
- Indonesia’s central bank Governor Perry Warjiyo reiterated that the country remains prepared for the global risks that have driven the rupiah to a two-decade low. Bank Indonesia will take steps to stabilize the currency and ease volatility, said Warjiyo. The rupiah weakened to new 52-week lows (highs) this week, as did the Indian rupee and the Philippine peso.
- Philippine inflation sped up to 6.7 percent in September, Bloomberg data shows, the fastest pace in more than nine years. Economists had estimated 6.8 percent, which would have been up from August's 6.4 percent pace.
Emerging Europe
Strengths
- The Czech Republic was the best performing country this week, gaining 13 basis points. The country’s budget surplus rose to 16.8 billion in September, up from 14.8 in August. The budget is expected to strengthen this year due to higher tax revenue and a delay in salary increases for teachers, which will go into effect next year.
- The euro was the best relative performing currency this week, losing 70 basis points against the dollar. Economic data released this week was relatively strong with the unemployment rate dropping in August, producer price index (PPI) increasing and retail sales jumping. Markit Eurozone Composite PMI was reported slightly lower at 54.1 in September versus 54.2 in August.
- Health care was the best performing sector among eastern European markets this week.
Weaknesses
- Turkey was the worst performing country this week, losing 5.1 percent. Equites trading on the Istanbul stock exchange sold off after higher than expected inflation. The CPI jumped to 24.52 percent in September year-over-year, up from 17.9 percent in August. An increase of 21.1 percent was expected.
- The Russian ruble was the worst performing currency this week, losing 1.5 percent against the dollar. Authorities from the United States, the Netherlands and Great Britain accused officers from Russia’s GRU military intelligence agency of cyberattacks. The United Kingdom may discuss further sanctions on Russia with its allies.
- Real estate was the worst performing sector among eastern European markets this week.
Opportunities
- Greece is preparing a plan to help banks speed up their bad loan disposal and possibly include a government guarantee. The details of the plan are still unknown, but the proposal would see lenders transferring some bad loans into special purpose vehicles, which would improve banks’ balance sheets and boost confidence in the sector.
- Russia could become the largest wheat exporter this year as its forecast to export 45 million tons of wheat, a figure that includes both corn and barley. Algeria is the key buyer of wheat in Europe, mainly importing it from France. However, Russia and Algeria have recently taken preliminary steps to increase trade. European farmers have struggled to compete with low cost Russian production.
- Russia’s oil production rose to a post-Soviet high last month. The country produced a record 11.356 million barrels per day (bpd) of oil in September, according to data released on Tuesday by the Energy Ministry. This demonstrates that Russia completely erased its 300,000 bpd cut agreed on with OPEC in 2016 and has added over 100,000 barrels a day more.
Threats
- After Moody’s and the S&P downgraded Turkey, another rating company, Fitch, has downgraded 20 Turkish banks’ long-term foreign currency issuer ratings. Fitch views that the banks’ performance, asset quality, capitalization, liquidity and funding profiles are now more likely to come under pressure because of the further depreciation of the Turkish lira, the spike in interest rates and a weaker growth outlook. This development is potentially negative for banking stocks, according to analyst at Yapi Kredit Yatrim, Hulusi Zarpli.
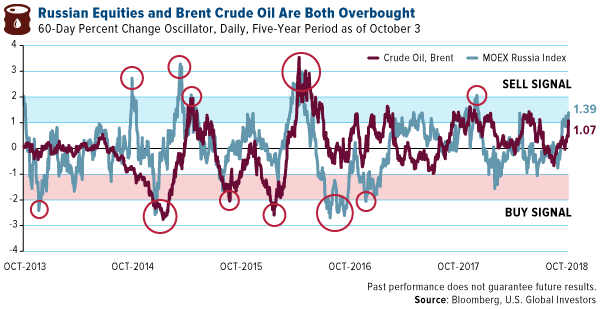
- Brent crude oil gained 10 percent in the past month and Russian equites have moved in line with the surge, also gaining 6 percent during the same period. However, as the below oscillator chart illustrates, both have entered oversold territory and a correction could follow.
- Eurozone final manufacturing PMI data for September was recorded at 53.2, versus a preliminary reading of 53.3. This marks the lowest reading for manufacturing output in 28 months. In central emerging Europe, Turkey saw the sharpest drop in PMI, falling to 42.7 from 46.4. PMIs in Hungary, the Czech Republic, Greece and Poland were also reported weaker, but still above the 50 level that separates growth from contraction. The strongest reading was recorded in Russia, with PMI bouncing back to 50, from 48.9 in August.
© US Global Investors
Membership required
Membership is now required to use this feature. To learn more:
View Membership BenefitsSponsored Content
Upcoming Virtual Events View All


